. 2023 Jan 12;13(1):12.
doi: 10.1038/s41408-023-00787-w.

Prolyl-tRNA synthetase as a novel therapeutic target in multiple myeloma

Affiliations

Prolyl-tRNA synthetase as a novel therapeutic target in multiple myeloma

Keiji Kurata et al. Blood Cancer J. .

Erratum in

  • Correction: Prolyl-tRNA synthetase as a novel therapeutic target in multiple myeloma.
    Kurata K, James-Bott A, Tye MA, Yamamoto L, Samur MK, Tai YT, Dunford J, Johansson C, Senbabaoglu F, Philpott M, Palmer C, Ramasamy K, Gooding S, Smilova M, Gaeta G, Guo M, Christianson JC, Payne NC, Singh K, Karagoz K, Stokes ME, Ortiz M, Hagner P, Thakurta A, Cribbs A, Mazitschek R, Hideshima T, Anderson KC, Oppermann U. Kurata K, et al. Blood Cancer J. 2023 Feb 7;13(1):24. doi: 10.1038/s41408-023-00793-y. Blood Cancer J. 2023. PMID: 36746923 Free PMC article. No abstract available.

Abstract

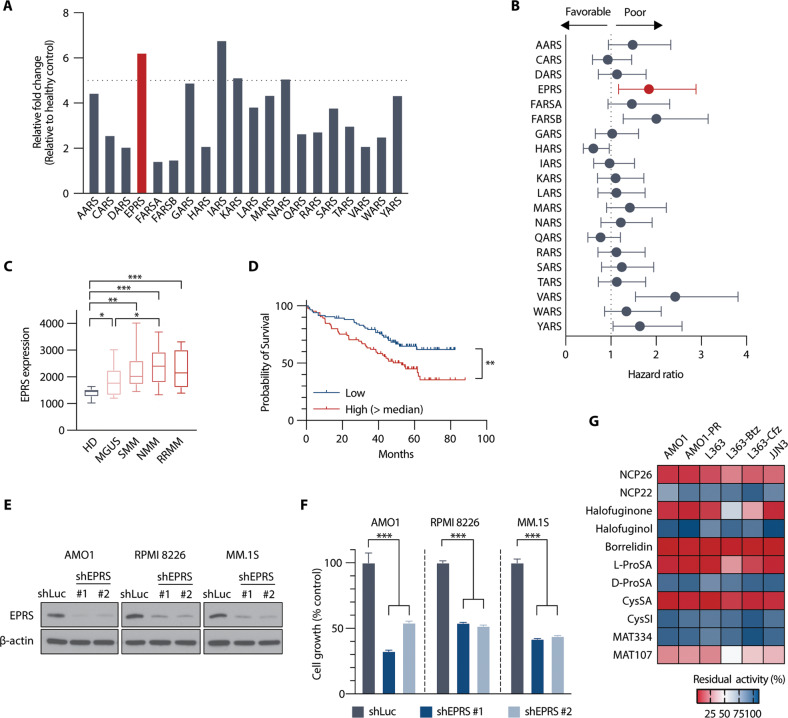
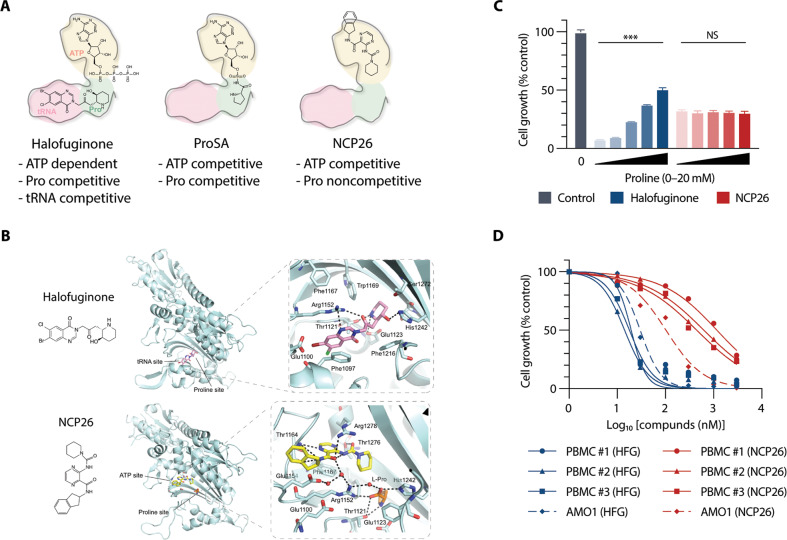
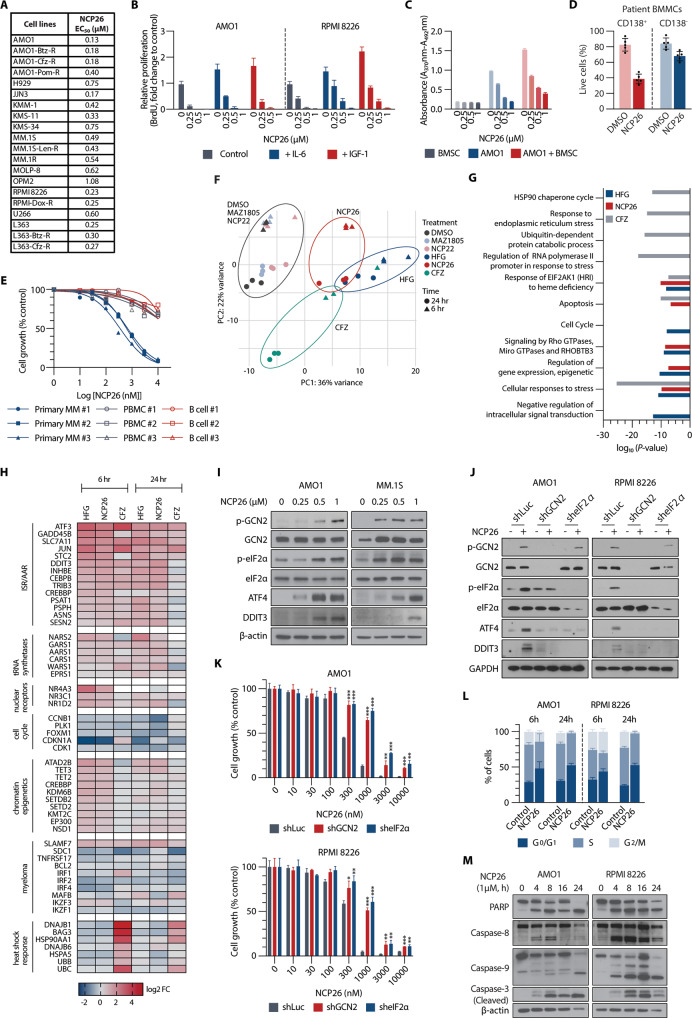
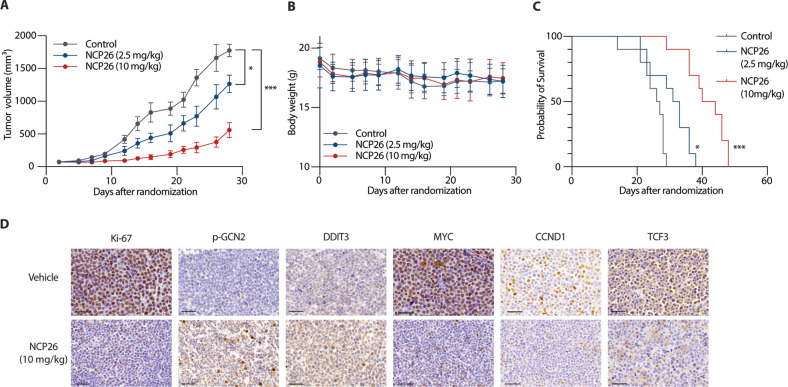
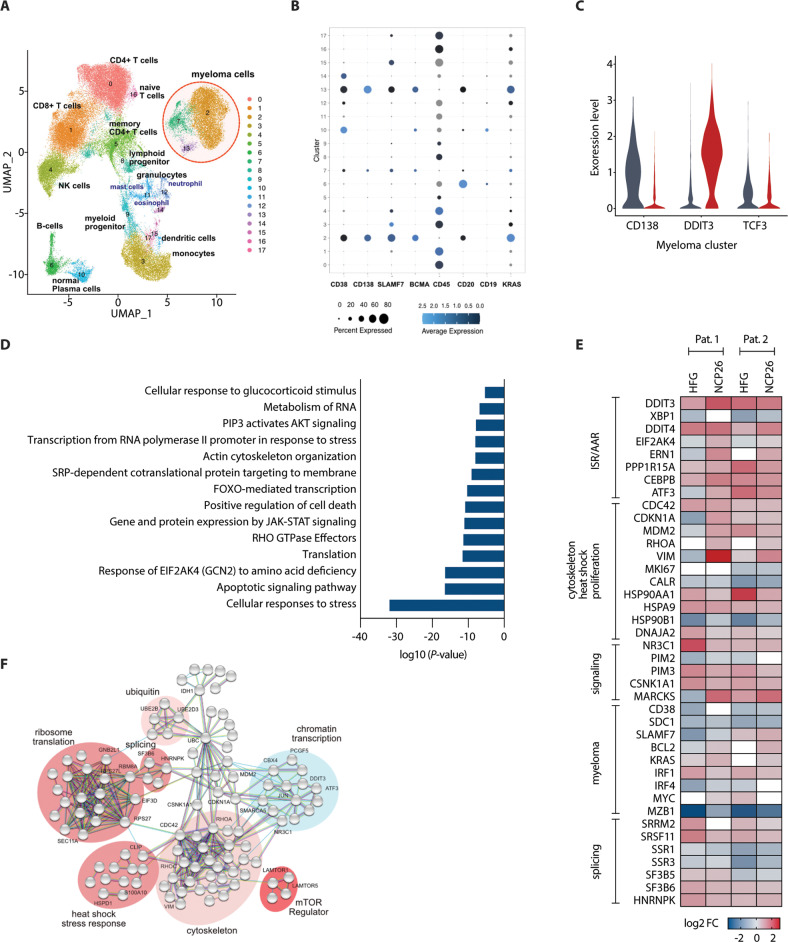
Multiple myeloma (MM) is a plasma cell malignancy characterised by aberrant production of immunoglobulins requiring survival mechanisms to adapt to proteotoxic stress. We here show that glutamyl-prolyl-tRNA synthetase (GluProRS) inhibition constitutes a novel therapeutic target. Genomic data suggest that GluProRS promotes disease progression and is associated with poor prognosis, while downregulation in MM cells triggers apoptosis. We developed NCP26, a novel ATP-competitive ProRS inhibitor that demonstrates significant anti-tumour activity in multiple in vitro and in vivo systems and overcomes metabolic adaptation observed with other inhibitor chemotypes. We demonstrate a complex phenotypic response involving protein quality control mechanisms that centers around the ribosome as an integrating hub. Using systems approaches, we identified multiple downregulated proline-rich motif-containing proteins as downstream effectors. These include CD138, transcription factors such as MYC, and transcription factor 3 (TCF3), which we establish as a novel determinant in MM pathobiology through functional and genomic validation. Our preclinical data therefore provide evidence that blockade of prolyl-aminoacylation evokes a complex pro-apoptotic response beyond the canonical integrated stress response and establish a framework for its evaluation in a clinical setting.


Conflict of interest statement

KKurata, AJB, MAT, LY, MKS, YTT, JD, CJ, FS, MP, KR, SG, MS, GG, MG, CP, JCC, KS, AC, TH have no competing interests relevant to this work. KCA is an American Cancer Society Clinical Research Professor; an advisor for Pfizer, Amgen, AstraZeneca, Janssen, and Precision Biosciences; and board member with equity interests in C4 Therapeutics, Dynamic Cell Therapies, NextRNA, Window, And Starton therapeutics. RM is a scientific advisory board (SAB) member and equity holder of Regenacy Pharmaceuticals, ERX Pharmaceuticals, and Frequency Therapeutics. MAT, NCP, and RM are inventors on patent applications related to this work. KKaragoz, MO, MS, PH and AT are employees and shareholders of Bristol Myers Squibb.

Figures

Fig. 1
Fig. 1. EPRS is upregulated and associated with poor prognosis in MM patient studies.
A Comparative GEP analysis of aminoacyl-tRNA synthetases between normal plasma cells and MM cells (GSE39754). B Hazard ratios of aaRS expression levels on survival in MM patients (GSE39754). C Comparative GEP analysis of EPRS between normal plasma cells and MM cells across disease stages (GSE6477). D Overall survival relative to EPRS expression in patients with newly diagnosed MM (log-rank test) (MMRF CoMMpass). E AMO1, RPMI 8226 and MM.1 S cells were transduced with shLuc (control) or shEPRS (#1, #2). Whole-cell lysates from MM cells were subjected to immunoblotting using indicated antibodies. F After puromycin selection, cells were cultured for 48 h, and growth was assessed by MTT assay. Data represent mean ± SD of triplicate cultures. G Heatmap of anti-proliferative activities of aaRS inhibitors in MM cell lines – 1 µM (NCP26, NCP22, halofuginone, halofuginol, borrelidin, MAT334 and MAT107) or 5 µM (L-ProSA, D-ProSA, CysSA amd CysSI), 72 h, MTT assay; n = 2–5 independent experiments in triplicate technical repeats. HD healthy donor, MGUS monoclonal gammopathy of undetermined significance, SMM smoldering myeloma, NMM newly diagnosed myeloma, RRMM relapsed/refractory myeloma; **P < 0.01, ***P < 0.001.
Fig. 2
Fig. 2. NCP26 is a novel PRS inhibitor chemotype that occupies the ATP pocket.
A Schematic depiction of PRS inhibitor chemotypes and mode of inhibition: pink—tRNA binding site, light green—proline binding site, olive—ATP binding site. B Crystal structures illustrating inhibitor binding modes against human PRS. Inhibitors in complex with human PRS (HFG (PDB ID 4K87; NCP26 PDB ID 7BBU) are shown as coloured stick representations. Key interacting PRS residues are shown in light cyan. C AMO1 cells were cultured with or without halofuginone (HFG, 0.5 µM) or NCP26 (0.5 µM) in the presence of proline (0, 1, 5, 10 and 20 mM) for 48 h. Data represent mean ± SD of triplicate cultures. ***P < 0.001. D PBMCs isolated from three healthy volunteers were cultured with NCP26 (0.01–10 µM) for 96 h. Data are mean ± SD viability, assessed by MTT assay of triplicate cultures, expressed as percentage of untreated controls.
Fig. 3
Fig. 3. NCP26 exposure induces the integrated stress response via GCN2 and leads to subsequent apoptosis in MM cells.
A Table of EC50 values for NCP26 determined for wild-type and drug-resistant MM cell lines. B Serum-starved AMO1 and RPMI 8226 cells were pre-incubated with NCP26 (0.25, 0.5 and 1 µM) for 1 h and then treated with IL-6 (10 ng/ml) or IGF-1 (50 ng/ml). C AMO1 and RPMI 8226 cells were cultured with NCP26 (0.25, 0.5 and 1 µM) for 48 h in the presence or absence of BMSC. D BMMCs from MM patients were cultured with or without NCP26 (1 µmol/L) for 48 h and analysed using multi-channel flow cytometry. Viability of CD138-positive MM cells and CD138-negative normal BM stromal cells was determined by Annexin V and PI staining. The percentage of viable MM cells from five different patients is shown. E Bone marrow CD138+ tumour cells from three MM patients and PBMCs and B cells isolated from three healthy volunteers were cultured with NCP26 (0.01–10 µM) for 48 h. F PCA plot of transcriptomic (RNAseq) changes in AMO1 cells after a 6- or 24 h exposure with HFG or NCP26 (both 1 µM) or carfilzomib (10 nM). G Pathway analysis shows enrichment for stress responses in the RNAseq dataset. H Heatmap of selected differentially expressed genes upon NCP26 treatment. I Western blot demonstrating dose-dependent responses to NCP26 for canonical ISR activation with concomitant GCN2 and eIF2α phosphorylation. J, K AMO1 and RPMI 8226 cells were transduced with shLuc (control), shGCN2 or sheIF2α. After puromycin selection, cells were treated with or without NCP26 (0.5 µM) for 6 h (J) or 24 h at indicated doses (K). Whole-cell lysates from MM cells were subjected to immunoblotting using indicated antibodies (J). L AMO1 and RPMI 8226 cells were cultured with NCP26 at 0.5 µM for 6 or 24 h. G0/G1, S and G2/M phase in cell cycle profiling was analysed by flow cytometry. Means ± SD from two independent experiments. M AMO1 and RPMI 8226 cells were cultured with NCP26 for the indicated times at the indicated dose. Whole-cell lysates were subjected to immunoblotting using indicated antibodies. Cell growth was assessed by MTT assay (A, B, E, K) or BrdU uptake (C). Data represent mean ± SD of triplicate cultures. **P < 0.01, ***P < 0.001.
Fig. 4
Fig. 4. Integration of proteomic, genomic and transcriptomic datasets identifies downstream mechanisms and targets of NCP26 inhibition.
A Scatterplot of proteomic and RNAseq datasets depicting changes after 6 h of NCP26 exposure in AMO1 cells. Proteins highlighted in blue are proteins downregulated by NCP26, and highlighted in red are discussed in the text (P < 0.01). B Pathway analysis of downregulated proteins highlights processes related to cell cycle and mitosis. C Venn diagram illustrating overlap between downregulated gene transcripts (RNAseq) and proteins (LC/MS proteomics) after 6 h of NCP26 exposure plus CRISPR knockdown targets in MM. D STRING analysis of overlapping downregulated proteins (73, intersecting with CRISPR genes and RNAseq (11), or CRISPR (62)) establishes an NCP26 network of essential myeloma mechanisms in AMO1 cells. Cell cycle checkpoints are highlighted in green. Red label: protein overlap from all three datasets. E Subset of downregulated proteins upon NCP26 treatment containing proline-rich motifs. F AMO1 and RPMI 8226 cells were cultured with NCP26 for 6 h at the indicated doses. Whole-cell lysates were subjected to immunoblotting using indicated antibodies. G AMO1, RPMI 8226, and MM.1 S cells were transduced with shLuc or shEPRS (#1, #2) shRNAs. Whole-cell lysates were subjected to immunoblotting using indicated antibodies. H TCF3 knockdown results in anti-proliferative activity in MM cells. After puromycin selection of shRNA constructs, cells were cultured for 48 h, and growth was assessed by MTT assay. Data represent mean ± SD of triplicate cultures. ***P < 0.001.
Fig. 5
Fig. 5. NCP26 reduces tumour burden and increases survival time in human MM xenografts in SCID mice.
A Mice engrafted with 5 × 106 AMO1 cells were treated intraperitoneally once a day with control vehicle or NCP26 (2.5 mg/kg or 10 mg/kg). Determination of mean tumour volume; error bars represent SD. B Body weight change of the mice is shown. C Host survival was evaluated from the first day of treatment until death using Kaplan–Meier curves. D Immunohistochemistry of selected targets p-GCN2, DDIT3, MYC, CCND1, and TCF3 from day 5 of AMO1 xenograft model. Scale bar = 50 µm. *P < 0.05, ***P < 0.001.
Fig. 6
Fig. 6. Anti-myeloma activity of NCP26 and HFG in human MM bone marrow assays.
A UMAP of single-cell RNAseq of human bone marrow samples (newly diagnosed MM), depicting major cell type clusters. B Dotplot of selected MM markers and cluster assignment. C Violin plot demonstrating the effect of NCP26 exposure (24 h) on myeloma cluster marker CD138 and NCP26 targets DDIT3 and TCF3. D Pathway analysis of top 200 regulated genes in myeloma subclusters. E Heatmap of selected differentially expressed genes after 24 h exposure with the PRS inhibitors HFG and NCP26. F STRING analysis of top regulated genes in the myeloma clusters after 24 h NCP exposure highlighting differentially regulated pathways.

References

    1. Kumar SK, Rajkumar V, Kyle RA, van Duin M, Sonneveld P, Mateos MV, et al. Multiple myeloma. Nat Rev Dis Prim. 2017;3:17046. - PubMed
    1. Saavedra-Garcia P, Martini F, Auner HW. Proteasome inhibition in multiple myeloma: lessons for other cancers. Am J Physiol Cell Physiol. 2020;318:C451–C462. - PubMed
    1. Hideshima T, Mitsiades C, Akiyama M, Hayashi T, Chauhan D, Richardson P, et al. Molecular mechanisms mediating antimyeloma activity of proteasome inhibitor PS-341. Blood. 2003;101:1530–4. - PubMed
    1. Ma MH, Yang HH, Parker K, Manyak S, Friedman JM, Altamirano C, et al. The proteasome inhibitor PS-341 markedly enhances sensitivity of multiple myeloma tumor cells to chemotherapeutic agents. Clin Cancer Res. 2003;9:1136–44. - PubMed
    1. Lee AH, Iwakoshi NN, Anderson KC, Glimcher LH. Proteasome inhibitors disrupt the unfolded protein response in myeloma cells. Proc Natl Acad Sci USA. 2003;100:9946–51. - PMC - PubMed

Publication types

MeSH terms

Substances