. 2023 Jan 11;14(1):156.
doi: 10.1038/s41467-022-35487-9.

Senescent cells perturb intestinal stem cell differentiation through Ptk7 induced noncanonical Wnt and YAP signaling

Affiliations

Senescent cells perturb intestinal stem cell differentiation through Ptk7 induced noncanonical Wnt and YAP signaling

Jina Yun et al. Nat Commun. .

Abstract

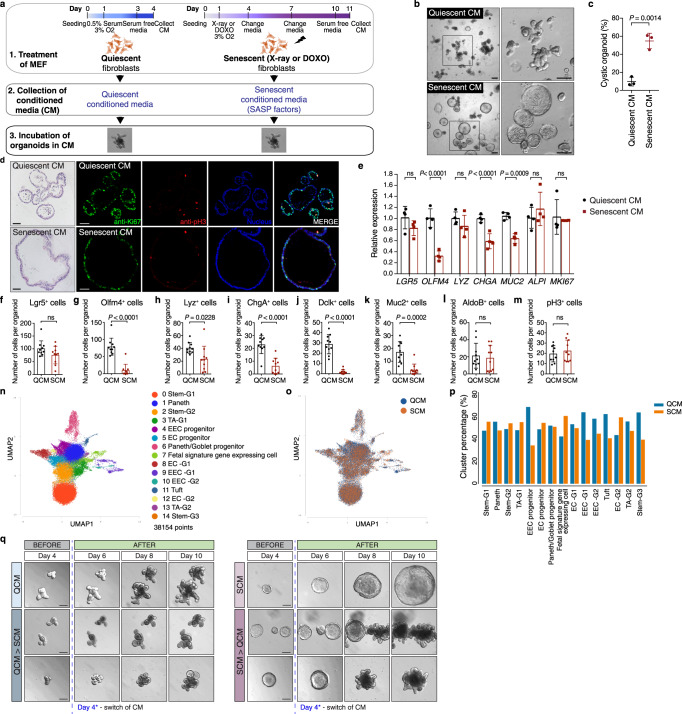
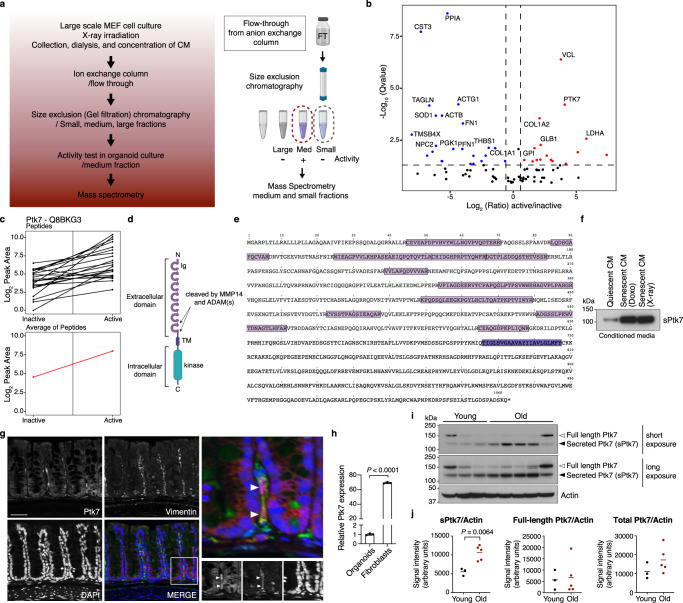
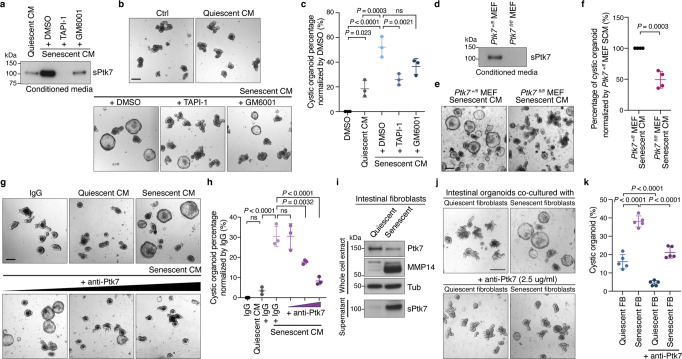
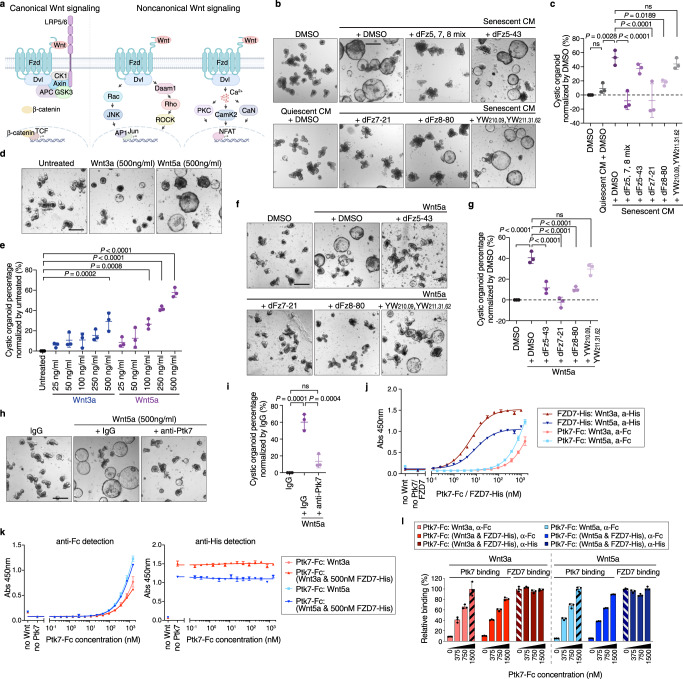
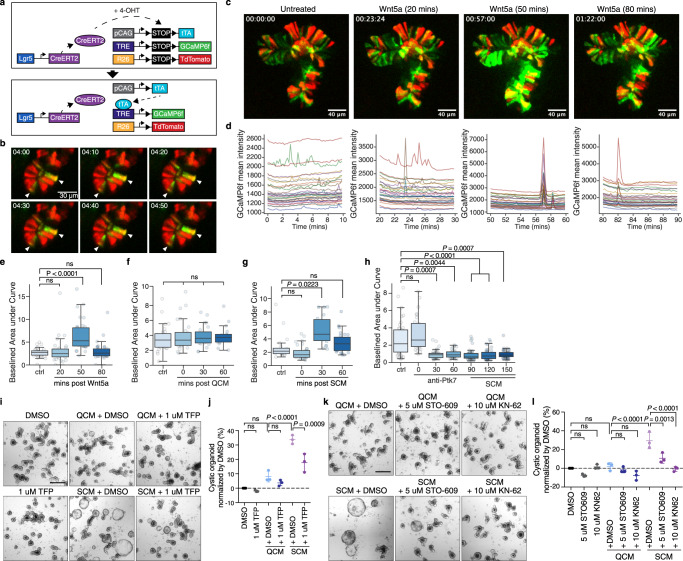
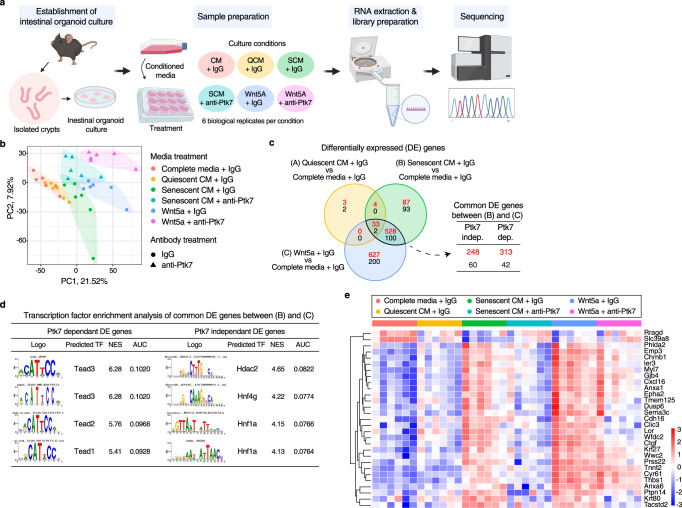
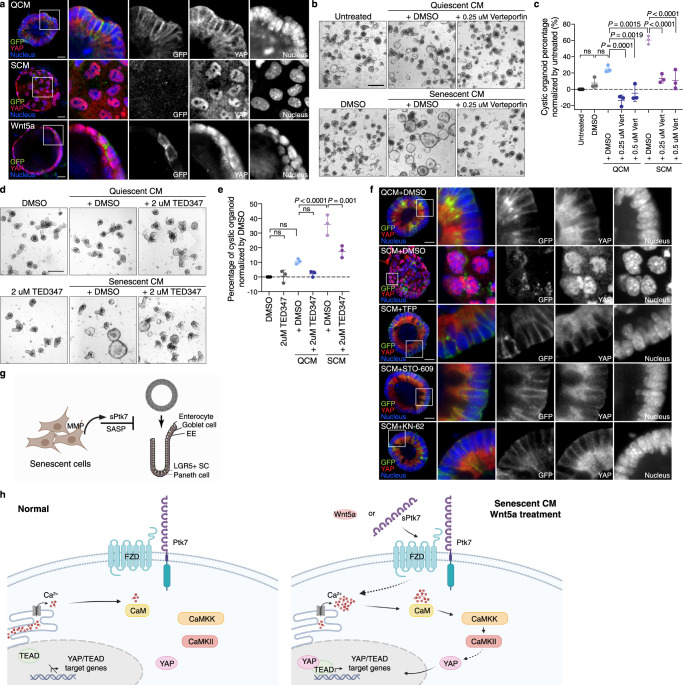
Cellular senescence and the senescence-associated secretory phenotype (SASP) are implicated in aging and age-related disease, and SASP-related inflammation is thought to contribute to tissue dysfunction in aging and diseased animals. However, whether and how SASP factors influence the regenerative capacity of tissues remains unclear. Here, using intestinal organoids as a model of tissue regeneration, we show that SASP factors released by senescent fibroblasts deregulate stem cell activity and differentiation and ultimately impair crypt formation. We identify the secreted N-terminal domain of Ptk7 as a key component of the SASP that activates non-canonical Wnt / Ca2+ signaling through FZD7 in intestinal stem cells (ISCs). Changes in cytosolic [Ca2+] elicited by Ptk7 promote nuclear translocation of YAP and induce expression of YAP/TEAD target genes, impairing symmetry breaking and stem cell differentiation. Our study discovers secreted Ptk7 as a factor released by senescent cells and provides insight into the mechanism by which cellular senescence contributes to tissue dysfunction in aging and disease.


Conflict of interest statement

J.Y., M.B.C., R.N.H., Y.Z., L.Z., C.C.O., D.G., H.J. are employees and/or stock holders of Genentech Inc. The remaining authors declare no competing interests.

Figures

Fig. 1
Fig. 1. Conditioned medium from senescent fibroblasts causes cystic morphology of mouse intestinal organoids.
a Schematic showing induction of quiescence and senescence in fibroblasts, conditioned media collection, and organoid culture in conditioned media. The figure was created with BioRender.com. b Representative images of organoids after 5 d of culture in conditioned media. Enlarged images (boxed area) are shown at the right. Scale bar, 200 μm. c Quantification of data from (b). The percentage of cystic organoids in organoids cultured in conditioned media is shown (mean ± s.d.; two-tailed t-test). Each dot represents a result from organoids established from a mouse, 3 biological replicates per experiment (n = 3). d H&E staining (left column) and immunostaining of paraffin-embedded organoids. Immunostaining for Ki67 (green) and phospho-Histone H3 (red) in intestinal organoids cultured in conditioned media and stained with Hoechst (blue). Scale bar, 50 μm. e Gene expression in organoids exposed to SCM determined by qPCR and represented as a ratio relative to organoids exposed to QCM (mean ± s.d.; n = 4; two-tailed t-test). fm Numbers of cells expressing the listed markers in organoids exposed to QCM or SCM (mean ± SEM; n = 10; two-tailed t-test). n UMAP of pooled snRNA-seq data of nuclei from QCM and SCM exposed organoids colored by cell-type annotation (right). o UMAP showing contribution of nuclei from QCM and SCM exposed organoids labeled in blue and orange, respectively. p Relative contribution of cells from QCM and SCM exposed organoids to each cluster. Cells from QCM and SCM exposed organoids were labeled in blue and orange, respectively. q Representative images of organoids taken every 2 days starting on day 4. From day 0 to 4, organoids were cultured in quiescent conditioned media (left panel) and senescent conditioned media (right panel). On day 4, quiescent-conditioned media was changed to senescent-conditioned media (left bottom panel), whereas senescent-conditioned media was changed to quiescent-conditioned media (right bottom panel). In all conditions, media was changed every other day. Scale bars, 100 μm. See also Fig. S1. Source data are provided as a Source Data file.
Fig. 2
Fig. 2. Identification of Ptk7 as a factor that causes cystic organoid phenotype.
a Schematic showing conditioned media preparation, column purification, activity test, and mass spectrometry (MS). The figure was created with BioRender.com. b Volcano plot representing the statistical significance and protein abundance ratios between medium (active) and small (inactive) fractions. Dashed lines depict a q = 0.05 cutoff (horizontal) and 1.5-fold difference cutoffs (vertical). Proteins that are present highly in medium (active) and small (inactive) fractions are represented in red and blue, respectively. Proteins with q < 0.01 and more than 1.5-fold difference are labeled. c Graphs showing peptide peak area profiles for Ptk7. Each Ptk7 peptide detected is shown as a black line, indicating the peak area measurements for the inactive and active fractions. The average of all Ptk7 peptides is presented as a red line. d Schematic representation of the Ptk7 protein domain structure. Ig: Immunoglobulin-like loops (lilac), TM: a transmembrane region (purple), and an inactive tyrosine kinase domain (blue). e A graphic representation of the list of peptides detected by MS. Ptk7 peptide sequences detected by MS in lilac and the transmembrane domain in purple. f Western blot for Ptk7 in conditioned media collected from quiescent and doxorubicin- or irradiation-induced senescent MEFs. Conditioned media corresponding to the same number of cells was loaded. Increased shedding of Ptk7 (soluble form of Ptk7; sPtk7) was detected in senescent conditioned media. g Immunofluorescence staining of Ptk7 (red) and stromal cell marker Vimentin (green) in the large intestine. Nuclei were counter stained with DAPI (blue). Scale bar: 50 μm. h The relative PTK7 expression in intestinal organoids and fibroblasts (mean ± s.d.; n = 3; two-tailed t-test). i Western blots of Ptk7 in the large intestine extract from young and old mice. Blot images of two different exposure times are shown. Each lane presents tissue lysate from one mouse (n = 3 for young mice, n = 5 for old mice). Actin was used as loading control. j Quantification of data from (i). Ptk7 and Actin protein levels were analyzed by ImageJ. Ptk7 protein levels normalized to Actin are shown as mean ± s.d. Two-tailed t-test was used for statistical analysis. See also Fig. S2. Source data are provided as a Source Data file.
Fig. 3
Fig. 3. SCM-induced cystic organoid phenotype is dependent on Ptk7.
a Western blot for sPtk7 in conditioned media collected from quiescent and senescent MEFs treated with vehicle or inhibitors for 24 h. Conditioned media corresponding to the same number of cells was loaded. b Representative images of organoids cultured in corresponding conditioned media. Scale bar, 200 μm. c Quantification of data from (b). The percentage of cystic organoids is shown. d Western blot for sPtk7 in conditioned media collected from senescent Ptk7+/fl and Ptk7fl/fl fibroblasts. Conditioned media corresponding to the same number of cells was loaded. e Representative images of organoids cultured in corresponding conditioned media. Scale bar, 200 μm. f Quantification of data from (e). g Representative images of organoids cultured in conditioned media together with IgG (5 μg/ml) or increasing concentration of anti-Ptk7 antibodies (1, 2, and 5 μg/ml). Scale bar, 200 μm. h Quantification of data from (g). i Western blots of full-length and secreted Ptk7 and MMP14 in whole-cell extract of quiescent and senescent primary intestinal fibroblasts or conditioned media collected from the fibroblasts. Tubulin was used as loading control. j Representative images of organoids co-cultured with quiescent or senescent intestinal fibroblasts in the presence of IgG or anti-Ptk7. Scale bar, 200 μm. k Quantification of data from (j). In (c), (f), (h), and (k), data are presented as means ± s.d. One-way ANOVA followed by Tukey’s post-hoc multiple comparison tests. Each dot represents a result from organoids established from a mouse, n = 3 in (c) and (h), n = 4 in (f), and n = 5 in (k). See also Fig. S2. Source data are provided as a Source Data file.
Fig. 4
Fig. 4. Ptk7 acts through noncanonical Wnt signaling.
a Schematic representation of canonical and noncanonical Wnt signaling pathways. While canonical and noncanonical Wnt signaling pathways share components such as FZD and Dvl, other components such as LRP5/6 and β-Catenin are specific for canonical Wnt signaling. The figure was created with BioRender.com. b Representative images of organoids cultured in corresponding conditioned media with DMSO or inhibitors. Scale bar, 200 μm. c Quantification of data from (b). The percentage of cystic organoids in organoids cultured in conditioned media is shown. d Representative images of organoids treated with DMSO (carrier), Wnt3a or Wnt5a. Scale bar, 200 μm. e Quantification of data from (d). The percentage of cystic organoids in organoids cultured in conditioned media is shown. f Representative images of organoids cultured in Wnt5a with DMSO or inhibitors. Scale bar, 200 μm. g Quantification of data from (f). mean ± s.d. percentage of cystic organoids in organoids cultured in conditioned media. h Representative images of organoids cultured in Wnt5a with IgG or anti-Ptk7 antibodies. Scale bar, 200 μm. i Quantification of data from (h). mean ± s.d. The percentage of cystic organoids in organoids cultured in conditioned media is shown. In (c), (e), (g), and (i), data are presented as means ± s.d. One-way ANOVA followed by Tukey’s post-hoc multiple comparison tests. Each dot represents a result from organoids established from a mouse, n = 3. j Representative ELISA binding curves showing binding of Ptk7 or FZD7 to Wnt ligands. k Representative ELISA binding curves showing binding of Ptk7 to Wnt ligands in the absence or presence of 500 nM FZD7. In (j) and (k), data are presented as means ± s.d. n = 3 (l) Relative Ptk7 and FZD7 binding to Wnt ligands from (k). Relative Ptk7 binding was calculated by normalization to Ptk7 and Wnt ligand binding at 1500 nM in the absence of FZD7 (black striped bar). Relative FZD7 binding was calculated by normalization to FZD7 binding to Wnt ligands in the absence of Ptk7 (white striped bar). Data are presented as means ± s.d. See also Fig. S3. Source data are provided as a Source Data file.
Fig. 5
Fig. 5. Ptk7 modulates cytosolic Ca2+ oscillations in intestinal organoids.
a Lgr5-CreERT2-mediated expression of GCaMP6f in this experiment. Cre removes stop cassettes upon addition of 4-OHT, allowing expression of tTA, GCaMP6f, and tdTomato. b Time lapse images showing Ca2+ flashes in the crypt domain of a mouse intestinal organoid. GCaMP6f and tdTomato expression is shown in green and red, respectively. Scale bar, 30 μm. c Representative frames from live imaging of an organoid expressing GCaMP6f before and after Wnt5a treatment. n = 5 d GCaMP3f mean intensity traces of 10-minute live imaging matching the frames shown in (c). Each trace represents one cell. Boxplots showing baselined area under curve of live imaging before and after Wnt5a (e), QCM (f), SCM (g), or SCM and anti-Ptk7 antibody (h) treatment. The graphs show results from a representative experiment. n = 5 in (e), n = 3 in (f), n = 6 in (g), and n = 6 in (h). In (h), organoids were imaged every 30 min. 90 min after the addition of the antibodies, SCM was added to the media containing anti-Ptk7. The graphs show results from a representative experiment. n = 6. In (eh), boxplots display median ± interquartile range with whiskers marking 1.5 times the interquartile range. Kruskal–Wallis test followed by Dunn’s post-hoc multiple comparison tests. i Representative images of organoids cultured in QCM or SCM with DMSO or 1 μM TFP. Scale bar: 200 μm. j Quantification of data from (i). mean ± s.d. percentage of cystic organoids in organoids cultured in conditioned media. k Representative images of organoids cultured in QCM or SCM with DMSO, 5 μM STO-609, or 10 μM KN-62. l Quantification of data from (k). mean ± s.d.; n = 3; two-tailed t-test. The percentage of cystic organoids in organoids cultured in conditioned media is shown. In (j) and (l), One-way ANOVA followed by Tukey’s post-hoc multiple comparison tests. Each dot represents a result from organoids established from a mouse, n = 3. See also Figs. S4, S5. Source data are provided as a Source Data file.
Fig. 6
Fig. 6. Transcriptomes of organoids shows enrichment of TEAD binding motifs among Ptk7-dependent DE genes.
a A diagram showing the workflow of intestinal organoid culture, media treatments, sample preparation, and RNAseq. The figure was created with BioRender.com. b Principal component analysis (PCA) of RNAseq results from the indicated organoids. Each point represents individual samples, and sample groups are indicated by using different colors as indicated in the legend provided. c Venn diagram showing overlap in differentially expressed genes (DEGs) between the indicated conditions. Numbers of DEGs upregulated and downregulated are shown in red and black, respectively. FDR < 0.05 and fold change >1.5 were used to acquire the list of DEGs. Overlapping DEGs from SCM and Wnt5a treated organoids were further divided into two groups by Ptk7 dependency. d Transcription factor enrichment analysis of common DEGs from (c) using i-cisTarget. Highly enriched motifs and predicted transcription factors for Ptk7-dependent and independent DEGs were ranked by normalized enrichment score (NES). e Heatmap showing expression of selected Ptk7-dependent DEGs with TEADs binding motifs in different conditions. Heatmaps of Ptk7-dependent DEGs with different TEAD binding motifs (TEAD 1–4) are found in Supplementary Fig. 6a–d. See also Fig. S6.
Fig. 7
Fig. 7. Correlation between nuclear YAP localization and cystic organoid morphology and connection to Ca2+ signaling.
a Whole mount immunostaining of organoids for YAP. Organoids established from Lgr5-DTR-GFP mice were stained for GFP, YAP, and nucleus in green, red, and blue respectively. Representative images of an organoid from each condition are shown. n = 8 per each condition. Enlarged images of boxed area are shown at the right. Scale bar: 20 μm. b Representative images of organoids cultured in QCM or SCM with DMSO or verteporfin. Scale bar: 200 μm. c Quantification of data from (b). The percentage of cystic organoids in organoids cultured in conditioned media is presented as means ± s.d. d Representative images of organoids cultured in QCM or SCM with DMSO or TEAD inhibitors. Scale bar: 200 μm. e Quantification of data from (d). The percentage of cystic organoids in organoids cultured in conditioned media is presented as means ± s.d. In (c) and (e), each dot represents a result from organoids established from a mouse, n = 3. One-way ANOVA followed by Tukey’s post-hoc multiple comparison tests. f Whole mount immunostaining of organoids for YAP in organoids treated with QCM or SCM with DMSO, TFP, STO-609, or KN-62. Scale bar: 20 μm. Enlarged images of boxed area are shown on the right. g Model for the disruption of organoid differentiation by sPtk7 secreted by senescent cells. Senescent cells shed sPtk7 through the action of Matrix metalloproteinases (MMPs), disrupting crypt formation and epithelial cell differentiation in intestinal organoids. h In contrast to normal condition, the presence of sPtk7 or Wnt5a stimulates Ca2+ signaling in intestinal epithelial cells. Activation of the CaM/CaMKK/CaMKII pathway promotes translocation of YAP to the nucleus where it binds to TEADs and upregulates YAP/TEAD target genes. These changes in gene expression affect stem cell differentiation, resulting in cystic organoid morphology. g and h were created with BioRender.com. See also Fig. S7. Source data are provided as a Source Data file.

References

    1. Childs BG, et al. Senescent cells: an emerging target for diseases of ageing. Nat. Rev. Drug Discov. 2017;16:718–735. doi: 10.1038/nrd.2017.116. - DOI - PMC - PubMed
    1. Gil J. Cellular senescence causes ageing. Nat. Rev. Mol. Cell Biol. 2019;20:388. doi: 10.1038/s41580-019-0128-0. - DOI - PubMed
    1. van Deursen JM. The role of senescent cells in ageing. Nature. 2014;509:439–446. doi: 10.1038/nature13193. - DOI - PMC - PubMed
    1. Baker DJ, et al. Clearance of p16Ink4a-positive senescent cells delays ageing-associated disorders. Nature. 2011;479:232–236. doi: 10.1038/nature10600. - DOI - PMC - PubMed
    1. Demaria M, et al. An essential role for senescent cells in optimal wound healing through secretion of PDGF-AA. Dev. Cell. 2014;31:722–733. doi: 10.1016/j.devcel.2014.11.012. - DOI - PMC - PubMed

Publication types

Substances