. 2023 Jan 11;14(1):13.
doi: 10.1038/s41419-023-05552-2.

FRMD3 inhibits the growth and metastasis of breast cancer through the ubiquitination-mediated degradation of vimentin and subsequent impairment of focal adhesion

Affiliations

FRMD3 inhibits the growth and metastasis of breast cancer through the ubiquitination-mediated degradation of vimentin and subsequent impairment of focal adhesion

Wenjun Shao et al. Cell Death Dis. .

Abstract

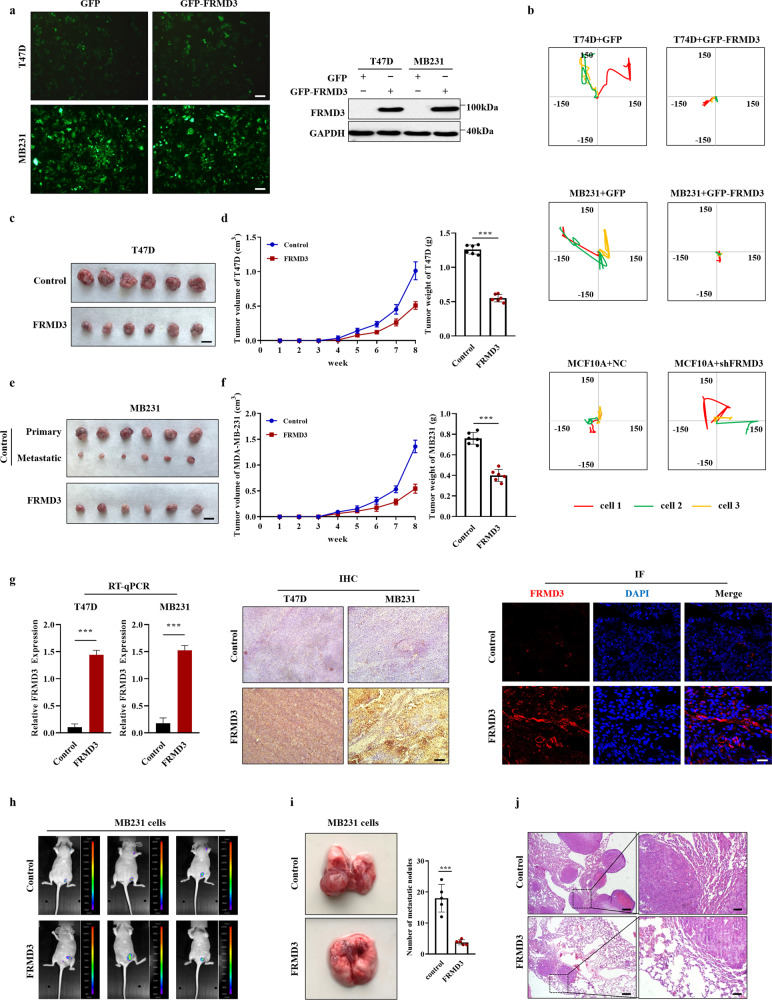
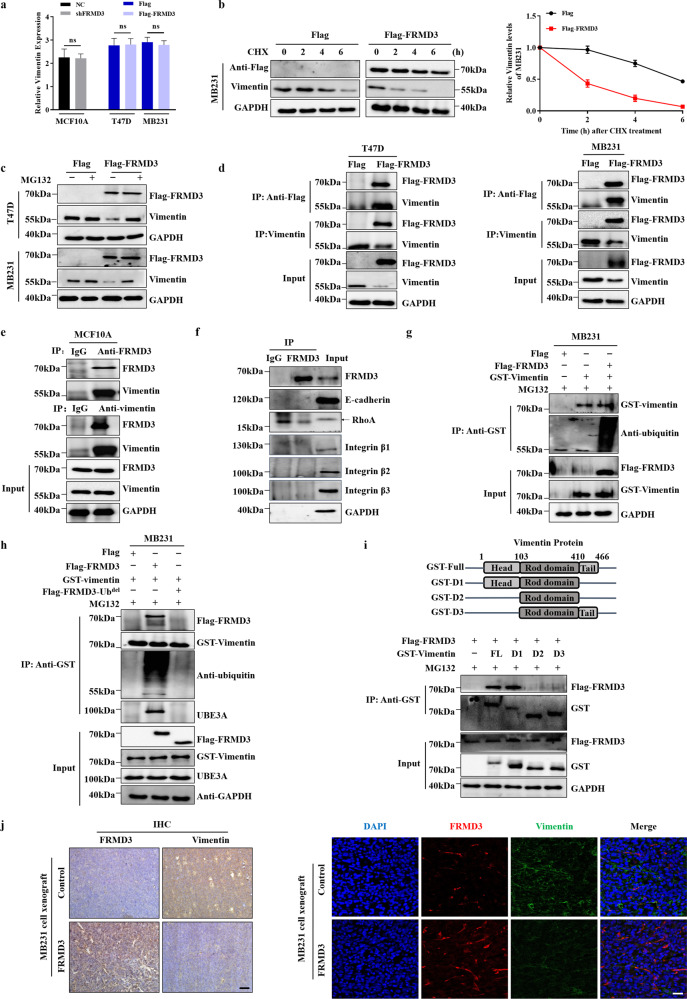
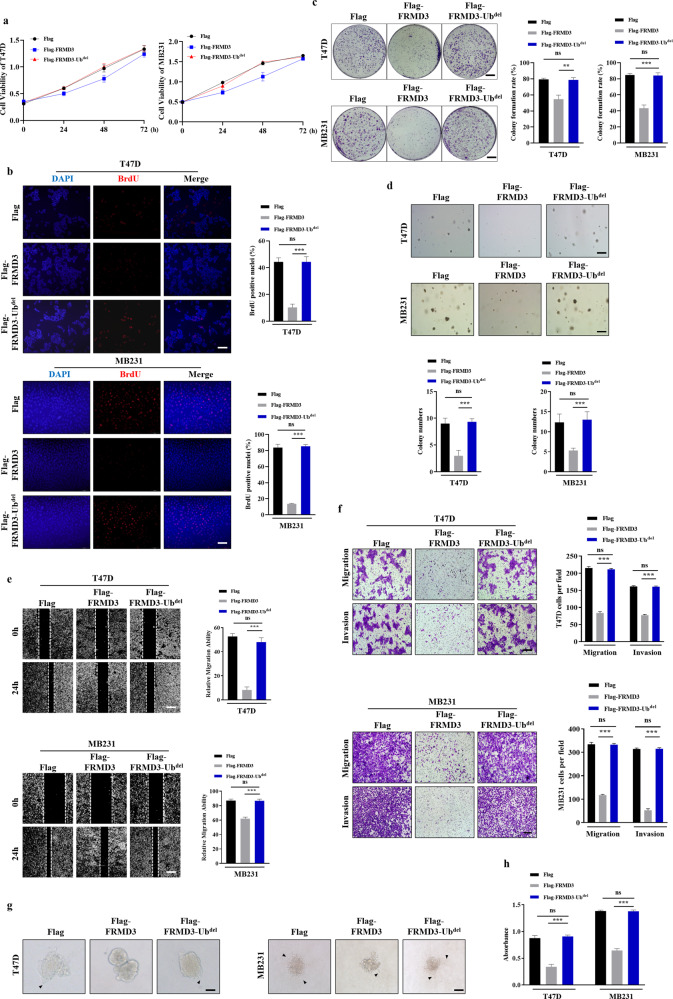
Recurrence and metastasis are the main causes of breast cancer (BRCA)-related death and remain a challenge for treatment. In-depth research on the molecular mechanisms underlying BRCA progression has been an important basis for developing precise biomarkers and therapy targets for early prediction and treatment of progressed BRCA. Herein, we identified FERM domain-containing protein 3 (FRMD3) as a novel potent BRCA tumor suppressor which is significantly downregulated in BRCA clinical tissue and cell lines, and low FRMD3 expression has been closely associated with progressive BRCA and shortened survival time in BRCA patients. Overexpression and knockdown experiments have revealed that FRMD3 significantly inhibits BRCA cell proliferation, migration, and invasion in vitro and suppresses BRCA xenograft growth and metastasis in vivo as well. Mechanistically, FRMD3 can interact with vimentin and ubiquitin protein ligase E3A(UBE3A) to induce the polyubiquitin-mediated proteasomal degradation of vimentin, which subsequently downregulates focal adhesion complex proteins and pro-cancerous signaling activation, thereby resulting in cytoskeletal rearrangement and defects in cell morphology and focal adhesion. Further evidence has confirmed that FRMD3-mediated vimentin degradation accounts for the anti-proliferation and anti-metastasis effects of FRMD3 on BRCA. Moreover, the N-terminal ubiquitin-like domain of FRMD3 has been identified as responsible for FRMD3-vimentin interaction through binding the head domain of vimentin and the truncated FRMD3 with the deletion of ubiquitin-like domain almost completely loses the anti-BRCA effects. Taken together, our study indicates significant potential for the use of FRMD3 as a novel prognosis biomarker and a therapeutic target of BRCA and provides an additional mechanism underlying the degradation of vimentin and BRCA progression.


Conflict of interest statement

The authors declare no competing interests.

Figures

Fig. 1
Fig. 1. Downregulation of FRMD3 was frequently observed in BRCA samples and indicated poor survival.
ad Analysis of the mRNA levels of FRMD3 in breast cancer based on sample types (a), gender (b), major subtype (c), and cancer stage (d). These data were downloaded from TCGA database and analyzed on UALCAN. e Kaplan–Meier survival analysis of 2032 patients with breast cancer based on FRMD3 gene expression via Kaplan–Meier Plotter. f GEPIA analysis of the correlation between FRMD3 mRNA expression levels and disease-free survival of 1063 breast cancer patients. gi RT-PCR (g), RT-qPCR (h), and Western blot (i) detected the expression levels of FRMD3 in MCF10A normal breast epithelial cell line and different BRCA cell lines. GAPDH and β-actin were used as internal controls. j Representative images of immunohistochemical (IHC) analysis of FRMD3 protein levels in the paracancerous tissues, carcinoma in situ, as well as metastatic BRCA in liver and lymph nodes on TMA slides. Scale bar, 50 μm. k Immunoreactivity score of FRMD3 protein levels in paracancerous tissues (n = 14), carcinoma in situ (n = 92), metastatic carcinoma (n = 9), lymph nodes negative for metastasis (n = 5), and lymph nodes positive for metastasis (positive, n = 8). l Western blot analysis of the exogenous FRMD3 protein expression in T47D and MDA-MB-231 cells with stable pcflag-FRMD3 transfection. m GFP fluorescent images (left) and Western blot analysis of FRMD3 levels (right) of MCF10A cells stably transfected with shFRMD3 by lentivirus. Scale bar, 100 μm. N = 3 biologically independent replicates. The student’s t-test was used to estimate the significance of difference between two groups and more than two groups were analyzed by one-way ANOVA. Data were presented as means ± s.d. ns not significant; **P < 0.01; ***P < 0.001.
Fig. 2
Fig. 2. FRMD3 inhibited the proliferation, migration, and invasion of BRCA cells in vitro.
a Cell viability of stable MCF10A with shFRMD3 or stable T47D and MDA-MB-231 cells with FRMD3 overexpression detected by MTT assay together with negative control (NC). b BrdU incorporation assay to evaluate cell proliferation of indicated cells by immunofluorescence staining (left) and the quantification of staining was shown on the right. Scale bar, 100 μm. c Representative images (left) and the quantification results (right) of colony formation assay of indicated cells. Scale bar, 200 μm. d Representative images of soft agar assay for colony formation of T47D and MDA-MB-231 cells with FRMD3 overexpression (left) and quantification of sphere numbers (right). Scale bar, 100 μm. e Scratch wound-healing assay in MCF10 cells with FRMD3 knockdown and T47D, MDA-MB-231 cells with FRMD3 overexpression. Scale bar, 200 μm. f, g Transwell assay to assess the migration (f) and invasion (g) of MCF10A cells with FRDM3 knockdown and T47D, MDA-MB-231 cells with FRMD3 overexpression (left) and quantification of the indicated cell numbers (right). Scale bar, 100 μm. After 24 h, Migrated (f) and invaded (g) cells were counted following staining with crystal violet. h Representative images (top) of 3D spheroid invasion assay in MCF10 cells with FRMD3 knockdown and T47D, MDA-MB-231 cells with FRMD3 overexpression and quantification of 3D spheroid invasion area (bottom). Scale bar, 50 μm. The arrowhead pointed to the filopodium. All experiments were performed independently three times. N = 3 biologically independent replicates. The student’s t-test was used to estimate the significance of the difference between the two groups. Data were presented as means ± s.d. *P < 0.05; **P < 0.01; ***P < 0.001.
Fig. 3
Fig. 3. FRMD3 decreased the mobility of BRCA cells and their growth and metastasis in vivo.
a GFP fluorescence microscopy (left) and Western blot (right) analysis of FRMD3 levels of T47D and MDA-MB-231 cell lines stably overexpressing GFP-FRMD3 established using lentivirus. Scale bar, 100 μm. b Cell tracking assay on three cells of MCF10 cells with FRMD3 knockdown or BRCA cells with GFP–FRMD3 overexpression, respectively. Images were captured every hour, and the trajectories of representative cells are plotted. The origins of migration are superimposed at (0, 0). cf T47D (c, d) and MDA-MB-231 (e, f) cell lines stably overexpressing FRMD3-GFP, along with control stable cells, were injected subcutaneously into the mammary fat pads of female nude mice (n = 6 per group). Gross pictures (c, e), volumes (left in d, f) and weight (right in d, f) of xenografts were shown. Scale bar, 1 cm. g RT-qPCR (left), IHC (middle) and IF (right) analysis of the mRNA or protein levels of FRMD3 in the xenografts. Scale bar, 100 μm. h Representative in vivo GFP fluorescence images of primary and metastatic tumors derived from MDA-MB231 cells with FRMD3-GFP overexpression. Scale bar, 100 μm. i Representative images (left) of the lungs from BALB/c nude mice 30 days after tail vein injection with stable MDA-MB-231 cells with or without FRMD3-GFP overexpression and the number of metastatic nodules on the surface of the lungs from each group (right). (n = 6 per group). j Representative images of H&E staining of mouse lung tissues in Fig. 3i. Scale bars: 200 μm (left panel) and 50 μm (right panel). N = 3 biologically independent replicates. The student’s t-test was used to estimate the significance of difference between two groups. Data were presented as means ± s.d. ***P < 0.001.
Fig. 4
Fig. 4. FRMD3 downregulated the expression of vimentin and focal adhesion related proteins.
a Western blot analysis of EMT-related proteins in the indicated cells. b GO enrichment analysis of biological processes of FRMD3 positively associated genes in breast cancer. c Western blot analysis of the focal adhesion complex proteins in the indicated cells. d Cell adhesion analysis of MCF10 cells with FRMD3 knockdown and MDA-MB-231 cells with FRMD3 overexpression. The number of cells seeded in fibronectin-coated wells was determined by MTT assay. e Representative images of immunofluorescence staining of exogenous Flag-FRMD3 (red) and endogenous vimentin (green) in MDA-MB-231 cells transiently transfected with pc-flag-FRMD3 and photographed with a laser scanning confocal microscope under ×1000 (upper panel) and ×400 (lower panel) magnification. The nucleus was stained with DAPI (blue). Scale bars: 10 μm (upper panel) and 25 μm (lower panel). f Representative images of immunofluorescence staining of vinculin(red) in MDA-MB-231 cells with stable FRMD3 overexpression or control cells. The nucleus was stained with DAPI (blue). Scale bar, 25 μm. g Western blot analysis of proliferation-related proteins and signaling in indicated cells with overexpression or silencing of FRMD3. h Western blot analysis of the indicated proteins in xenografts shown in Fig. 3c and e. N = 3 biologically independent replicates. The student’s t-test was used to estimate the significance of difference between two groups. Data were presented as means ± s.d. **P < 0.01.
Fig. 5
Fig. 5. The ubiquitin-like domain of FRMD3 was required for the ubiquitination and degradation of vimentin through interaction with its head domain.
a RT-qPCR analysis of the mRNA expression levels of vimentin in the cells with FRMD3 overexpression or knockdown. b Western blot analysis of the stability of the vimentin protein in control and FRMD3-overexpressing MDA-MB-231 cells in the presence of cycloheximide (CHX, 50 μg ml−1) for the indicated times (left). The data were quantified using ImageJ software (right), and GAPDH was used for normalization. c Western blot analysis of vimentin protein levels in control and FRMD3-overexpressed cells under the treatment with the proteasome inhibitor MG132 (10 μM for 8 h), or not. d Co-IP analysis of the interaction between FRMD3 and vimentin in T47D cells and MDA-MB-231 cells with FRMD3 overexpression. e Co-IP analysis of interaction between the endogenous FRMD3 and vimentin in MCF10A cells. Isotype-matched IgG was used as a negative control. f Co-IP analysis of the interaction of endogenous FRMD3 with the indicated proteins in MCF10A cells. g Immunoprecipitated ectopically expressed GST-vimentin from MG132-treated MDA-MB-231 cells with FRMD3 overexpression were subjected to Western blot with anti-ubiquitin antibodies. h Ectopically expressed GST-vimentin in MG132-treated MDA-MB-231 cells with FRMD3 or FRMD3-Ubdel overexpression were immunoprecipitated with anti-GST, and then the immunoprecipitated was subjected to Western blot with the indicated antibodies. i Co-IP analysis of the interaction of FRMD3 with different regions of vimentin in MG132-treated MDA-MB-231 cells co-transfected with pcFlag-FRMD3 and full-length vimentin (FL) or individual truncated vimentin mutants (schematic diagram shown on the top). j IHC (left) or immunofluorescence staining (right) analysis of the levels of FRMD3 and vimentin in MDA-MB-231 cell xenograft in nude mice shown in Fig. 3e. Scale bar, 100 μm. N = 3 biologically independent replicates. The student’s t-test was used to estimate the significance of difference between two groups. Data were presented as means ± s.d ns not significant.
Fig. 6
Fig. 6. FRMD3 inhibited BRCA cell proliferation and soft agar colony formation by downregulation of vimentin.
a Western blot analysis of the expression of FRMD3 and vimentin in stable FRMD3-overexpressed BRCA cells transfected with pcGST-vimentin plasmids or in stable FRMD3 knockdown MCF10A cells transfected with siRNA targeting vimentin (siVimentin). bd MTT assay (b), BrdU incorporation assay (c), and plate colony formation assay (d) were performed to assess cell proliferation of the indicated cells. e Soft agar colony formation assay in T47D cells and MDA-MB-231 cells with FRMD3 overexpression, with or without vimentin overexpression. N = 3 biologically independent replicates. The student’s t-test was used to estimate the significance of difference between two groups. Data were presented as means ± s.d. *P < 0.05; **P < 0.01; ***P < 0.001.
Fig. 7
Fig. 7. FRMD3 inhibited BRCA cell migration, invasion, and adhesion by downregulation of vimentin.
ac Scratch wound-healing assay (a), Transwell assay (b), and 3D spheroid invasion assay (c) were performed to detect cell migration and invasion in stable FRMD3-overexpressed MDA-MB-231BRCA cells transfected with pcGST-vimentin plasmids or in stable FRMD3 knockdown MCF10A cells transfected with siRNA targeting vimentin (siVimentin). d Cell adhesion analysis of indicated cells. MTT assay was used to quantify the cells adhered to fibronectin-coated wells. e Western blot analysis of the indicated proteins in corresponding cells with vimentin overexpression or knockdown. N = 3 biologically independent replicates. The student’s t-test was used to estimate the significance of difference between two groups. Data were presented as means ± s.d. **P < 0.01; ***P < 0.001.
Fig. 8
Fig. 8. The ubiquitin-like domain of FRMD3 was indispensable for its anti-tumor effects on BRCA.
ad MTT assay (a), BrdU assay (b), plate colony formation assay (c), and soft agar colony formation assay (d) were performed to detect cells proliferation of T47D cells and MDA-MB-231 cells with overexpression of FRMD3, FRMD3-Ubdel, or vector control. e, f The wound-healing assay (e), transwell migration and transwell Matrigel invasion assays (f) were conducted to assess migration and invasion of T47D cells and MDA-MB-231 cells overexpressing FRMD3, FRMD3-Ubdel, or vector control. g Representative images of the 3D spheroid invasion assay in T47D cells and MDA-MB-231 cells overexpressing FRMD3, FRMD3-Ubdel, or vector control. h Cells adhesion analysis of T47D and MDA-MB-231 cells overexpressing FRMD3, FRMD3-Ubdel, or vector control. MTT assay was used to quantify the cells adhered to fibronectin-coated wells. N = 3 biologically independent replicates. The student’s t-test was used to estimate the significance of difference between two groups. Data were presented as means ± s.d. ns not significant; **P < 0.01; ***P < 0.001.

Similar articles

Cited by

References

    1. Harbeck N, Penault-Llorca F, Cortes J, Gnant M, Houssami N, Poortmans P, et al. Breast cancer. Nat Rev Dis Prim. 2019;5:66. doi: 10.1038/s41572-019-0111-2. - DOI - PubMed
    1. Loibl S, Poortmans P, Morrow M, Denkert C, Curigliano G. Breast cancer. Lancet. 2021;397:1750–69. doi: 10.1016/S0140-6736(20)32381-3. - DOI - PubMed
    1. Waza AA, Tarfeen N, Majid S, Hassan Y, Mir R, Rather MY, et al. Metastatic breast cancer, organotropism and therapeutics: a review. Curr Cancer Drug Targets. 2021;21:813–28. doi: 10.2174/1568009621666210806094410. - DOI - PubMed
    1. Palmer ND, Freedman BI. Diabetic nephropathy: FRMD3 in diabetic nephropathy–guilt by association. Nat Rev Nephrol. 2013;9:313–4. doi: 10.1038/nrneph.2013.81. - DOI - PubMed
    1. Buffon MP, Sortica DA, Gerchman F, Crispim D, Canani LH. FRMD3 gene: its role in diabetic kidney disease. A narrative review. Diabetol Metab Syndr. 2015;7:118. doi: 10.1186/s13098-015-0114-4. - DOI - PMC - PubMed

Publication types