. 2023 Jan 11;14(1):27.
doi: 10.1038/s41467-022-35397-w.

The Stroop effect involves an excitatory-inhibitory fronto-cerebellar loop

Affiliations

The Stroop effect involves an excitatory-inhibitory fronto-cerebellar loop

Moe Okayasu et al. Nat Commun. .

Abstract

The Stroop effect is a classical, well-known behavioral phenomenon in humans that refers to robust interference between language and color information. It remains unclear, however, when the interference occurs and how it is resolved in the brain. Here we show that the Stroop effect occurs during perception of color-word stimuli and involves a cross-hemispheric, excitatory-inhibitory loop functionally connecting the lateral prefrontal cortex and cerebellum. Participants performed a Stroop task and a non-verbal control task (which we term the Swimmy task), and made a response vocally or manually. The Stroop effect involved the lateral prefrontal cortex in the left hemisphere and the cerebellum in the right hemisphere, independently of the response type; such lateralization was absent during the Swimmy task, however. Moreover, the prefrontal cortex amplified cerebellar activity, whereas the cerebellum suppressed prefrontal activity. This fronto-cerebellar loop may implement language and cognitive systems that enable goal-directed behavior during perceptual conflicts.


Conflict of interest statement

The authors declare no competing interests.

Figures

Fig. 1
Fig. 1. Experimental design to examine the role of language processing in the resolution of the Stroop effect.
a Stroop effect. It takes longer to name the color of a colored word when the word is colored in an inconsistent color (e.g., the word “RED” in blue-color font). b A schematic illustration of cross-hemispheric cerebro-cerebellar loops. c Stroop tasks. Participants made a judgment regarding the color (top) or word (bottom) of a colored word (Stroop task). The judgment was indicated by the orientation of the vertex of a pentagon (up: color; down: word). The word color and colored word were inconsistent (incongruent; left) or consistent (congruent; right). d Control (Swimmy) tasks. Another set of participants made a judgment regarding the orientation of the vertex of a large outline of a triangle (top) or of small individual (bottom) triangles (Swimmy task). The task dimension as indicated by the color of the triangles (orange: outline; green: individual). The orientation of the outline and individual triangles was inconsistent (incongruent; left) or consistent (congruent; right). e Behavioral procedures. In both the Stroop and Swimmy tasks, four trial conditions (two levels of tasks and two levels of congruency) were presented pseudorandomly. f Participants responded vocally (left) or manually (right). g The experimental conditions configured a 2 × 2 factorial design.
Fig. 2
Fig. 2. Behavioral results.
a Accuracy in the Stroop (left) and Swimmy (right) tasks with vocal (top) and manual (bottom) responses (vocal Stroop: N = 32; manual Stroop: N = 31; vocal Swimmy: N = 27; manual Swimmy: N = 28; independent participants). The vertical and horizontal axes indicate accuracy and conditions (task and congruency), respectively. Rectangular and error bars indicate means and standard errors of the mean across participants, respectively, with individual data overlaid on each rectangular bar. Statistical p values are shown on the top (paired t tests, two-tailed, uncorrected). Red: incongruent Stroop; blue: congruent Stroop; orange: incongruent Swimmy; green: congruent Swimmy. b Reaction times. The vertical and horizontal axes indicate reaction times and conditions, respectively. Statistical procedures and formats are similar to those in a. The sample size is identical to that in a.
Fig. 3
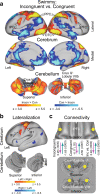
Fig. 3. The Stroop effect involves a lateralized fronto-cerebellar loop during stimulus perception.
a Statistical activation maps for signal increase and decrease in the contrast between incongruent and congruent trials in the Stroop task (P < 0.05, FWE-corrected across the whole-brain based on non-parametric permutation tests). The vocal and manual conditions were collapsed. Maps are overlaid onto a 3D surface of the brain. Hot and cool colors indicate signal increase and decrease in the incongruent trials, respectively. Arrowheads indicate anatomical locations of major activations. lPFC: lateral prefrontal cortex; PPC: posterior parietal cortex; OTC: occipitotemporal cortex; mPFC: medial prefrontal cortex; ACC: anterior cingulate cortex. b Statistical maps of brain regions showing differential Stroop effect activation (a) between the left and right hemispheres. Hot and cool colors indicate greater activity in the left and right hemispheres, respectively. c Task-related effective connectivity analysis between lPFC and cerebellar regions based on dynamic causal modeling. The values indicate estimates of the connectivity and their p-values calculated based on posterior probability density (one-tailed, uncorrected) are shown in parentheses next. The arrow directions indicate task-related effective connectivity. The magenta and green arrows indicate positive and negative effects, respectively.
Fig. 4
Fig. 4. Non-verbal Swimmy effect involves a bilateral fronto-cerebellar loop during stimulus perception.
a Statistical activation maps for signal increase and decrease in the contrast between incongruent and congruent trials in the Swimmy task. The vocal and manual conditions were collapsed. b Statistical maps of brain regions showing differential Swimmy effect activation (a) between the left and right hemispheres. IFJ inferior frontal junction. c Effective connectivity analysis between the lPFC and cerebellar regions based on dynamic causal modeling. The dashed arrows indicate insignificant connectivity. Statistical procedures and formats are similar to those in Fig. 3.
Fig. 5
Fig. 5. Response and stimulus modality effects.
a, b Response type affects the involvement of sensory-motor regions, but not the fronto-cerebellar loop associated with interference resolution. Statistical maps showing a differential interference effect (incongruent vs. congruent) between the vocal and manual conditions. Stroop task (a); Swimmy task (b). Hot and cool colors indicate greater interference effect in the vocal and manual conditions, respectively. c The Stroop effect predominantly involves the left lPFC and right cerebellum. Statistical maps showing a differential interference effect (incongruent vs. congruent) between the Stroop and Swimmy tasks. Hot and cool colors indicate a greater interference effect in the Stroop and Swimmy tasks, respectively. Formats are similar to those in Fig. 3a.
Fig. 6
Fig. 6. Direct comparison of the Stroop and Swimmy tasks and functional characterizations of the cerebellum.
a The Stroop effect predominantly involves the left lPFC and right cerebellum. Statistical maps showing a differential interference effect (incongruent vs. congruent) between the Stroop and Swimmy tasks. Hot and cool colors indicate a greater interference effect in the Stroop and Swimmy tasks, respectively. Formats are similar to those in Fig. 3a. b The current results for the contrast of the incongruent vs. congruent trials in the Stroop and Swimmy tasks (P < 0.05, FWE-corrected across the whole cerebellum based on non-parametric permutation tests) are for the cerebellar ROIs defined by functional parcellation in a previous study mapped onto 2D flat maps of the cerebellum. The functional labels and IDs of the ROIs above the maps were derived in the previous study. Red: Stroop only; blue: Swimmy only; yellow: both Stroop and Swimmy; gray: neither Stroop nor Swimmy.
Fig. 7
Fig. 7. Stroop and Swimmy effects are compared with data from a large-scale meta-analysis.
a Meta-analysis maps of the Stroop effect and the current activation maps of interference effects (incongruent vs. congruent) are overlaid on the transverse sections of structural images. Stroop task (top); Swimmy task (bottom). Cyan: meta-analysis maps only; green: current maps only; red: both maps overlapping. The levels of sections are indicated by Z levels at the bottom and yellow lines on the 3D surface of the brain at the right bottom. Arrowheads indicate anatomical locations. b ROI analysis (Stroop: N = 63; Swimmy: N = 55; independent participants). ROIs were defined as left lateral (LL), medial (M), and right lateral (RL) regions based on X axis levels in the meta-analysis maps of the Stroop effect. Stroop task (left); Swimmy task (right). Horizontal and vertical axes indicate ROIs and brain activity, respectively. Rectangular and error bars indicate means and standard errors of the mean across participants, respectively, with individual data overlaid on each rectangular bar. Statistical p values are shown on the top (t tests, two-tailed, uncorrected). c ROI analysis in which ROIs were defined based on the meta-analysis maps of cognitive control. Statistical procedures and formats are similar to those in b. The sample size is identical to that in b.
Fig. 8
Fig. 8. Putative model of the Stroop/Swimmy effects.
Schematic illustrations of cerebro-cerebellar involvement (a) and fronto-cerebellar connectivity (b) in the Stroop effect as suggested by the current results. c Schematic processing diagrams of the Stroop/Swimmy effects from stimulus presentation to response execution. Anatomical structure and functionalities of the front-cerebellar loop are speculated based on previous anatomical and neurophysiological evidence.

References

    1. Stroop JR. Studies of interference in serial verbal reactions. J. Exp. Psychol. 1935;18:643–662. doi: 10.1037/h0054651. - DOI
    1. Comalli PE, Wapner S, Werner H. Interference effects of Stroop color-word test in childhood, adulthood, and aging. J. Genet. Psychol. 1962;100:47–53. doi: 10.1080/00221325.1962.10533572. - DOI - PubMed
    1. Klein GS. Semantic power measured through the interference of words with color-naming. Am. J. Psychol. 1964;77:576–588. doi: 10.2307/1420768. - DOI - PubMed
    1. Jensen AR, Rohwer WD. The Stroop color-word test: a review. Acta Psychol. (Amst.) 1966;25:36–93. doi: 10.1016/0001-6918(66)90004-7. - DOI - PubMed
    1. Cohen L, et al. The visual word form area: spatial and temporal characterization of an initial stage of reading in normal subjects and posterior split-brain patients. Brain. 2000;123:291–307. doi: 10.1093/brain/123.2.291. - DOI - PubMed

Publication types