

A 30-year dataset of CO2 in flowing freshwaters in the United States
- PMID: 36631474
- PMCID: PMC9834220
- DOI: 10.1038/s41597-022-01915-0
A 30-year dataset of CO2 in flowing freshwaters in the United States
Abstract
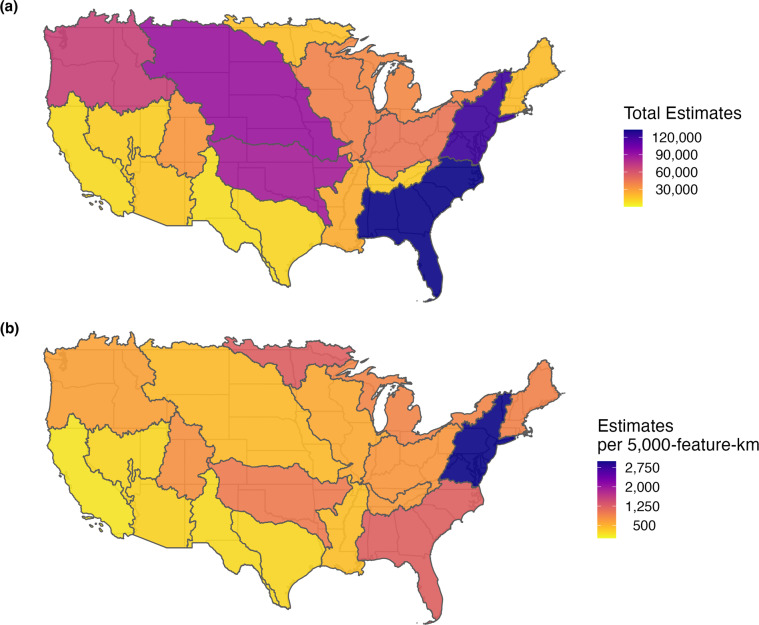
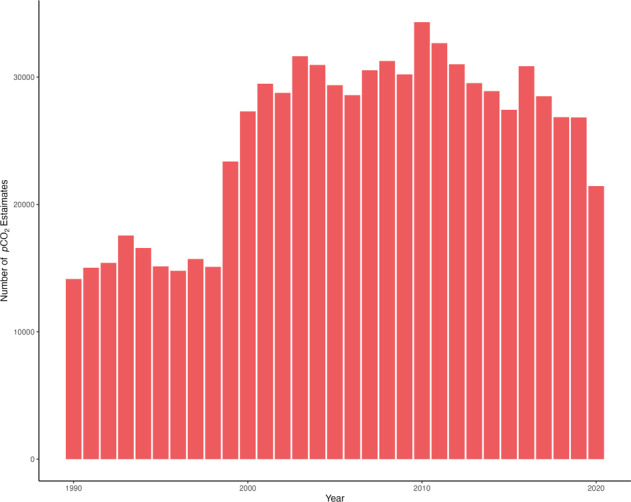
Increasing atmospheric carbon dioxide (CO2) concentrations have been linked to effects in a wide range of ecosystems and organisms, with negative effects of elevated CO2 documented for marine organisms. Less is known about the dynamics of CO2 in freshwaters, but the potential exists for freshwater organisms to be challenged by elevated CO2. In flowing freshwaters CO2 exhibits more variability than in lakes or the ocean, yet spatiotemporally extensive direct measures of CO2 in freshwater are rare. However, CO2 can be estimated from pH, temperature, and alkalinity-commonly collected water quality metrics. We used data from the National Water Quality Monitoring Council along with the program PHREEQC to estimate CO2 in flowing freshwaters across 35,000 sites spanning the lower 48 US states from 1990 through 2020. Site data for water chemistry measurements were spatially joined with the National Hydrology Dataset. Our resulting dataset, CDFLOW, presents an opportunity for researchers to add CO2 to their datasets for further investigation.
© 2023. The Author(s).
Conflict of interest statement
The authors declare no competing interests.
Figures

References
-
- Hartmann, D. L. et al. in Climate change 2013 the physical science basis: Working group I contribution to the fifth assessment report of the intergovernmental panel on climate change 159–254 (Cambridge University Press, 2013).
-
- Doney SC, Schimel DS. Carbon and Climate System Coupling on Timescales from the Precambrian to the Anthropocene. Annual Review of Environment and Resources. 2007;32:31–66. doi: 10.1146/annurev.energy.32.041706.124700. - DOI
-
- Solomon, S., Manning, M., Marquis, M. & Qin, D. Climate change 2007-the physical science basis: Working group I contribution to the fourth assessment report of the IPCC. Vol. 4 (Cambridge University Press, 2007).
-
- Munday PL, Jarrold MD, Nagelkerken I. Ecological effects of elevated CO2 on marine and freshwater fishes: from individual to community effects. Fish Physiology. 2019;37:323–368. doi: 10.1016/bs.fp.2019.07.005. - DOI
Publication types
Grants and funding
LinkOut - more resources
Full Text Sources
