. 2023 Jan 11;13(1):527.
doi: 10.1038/s41598-023-27700-6.

Single-nuclei transcriptomics enable detection of somatic variants in patient brain tissue

Affiliations

Single-nuclei transcriptomics enable detection of somatic variants in patient brain tissue

Sydney E Townsend et al. Sci Rep. .

Abstract

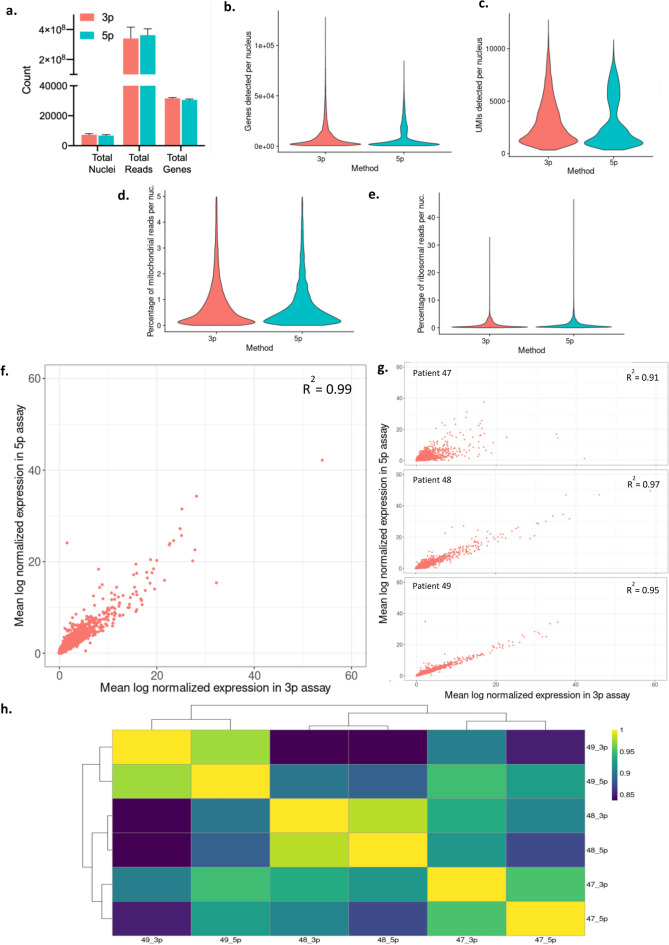
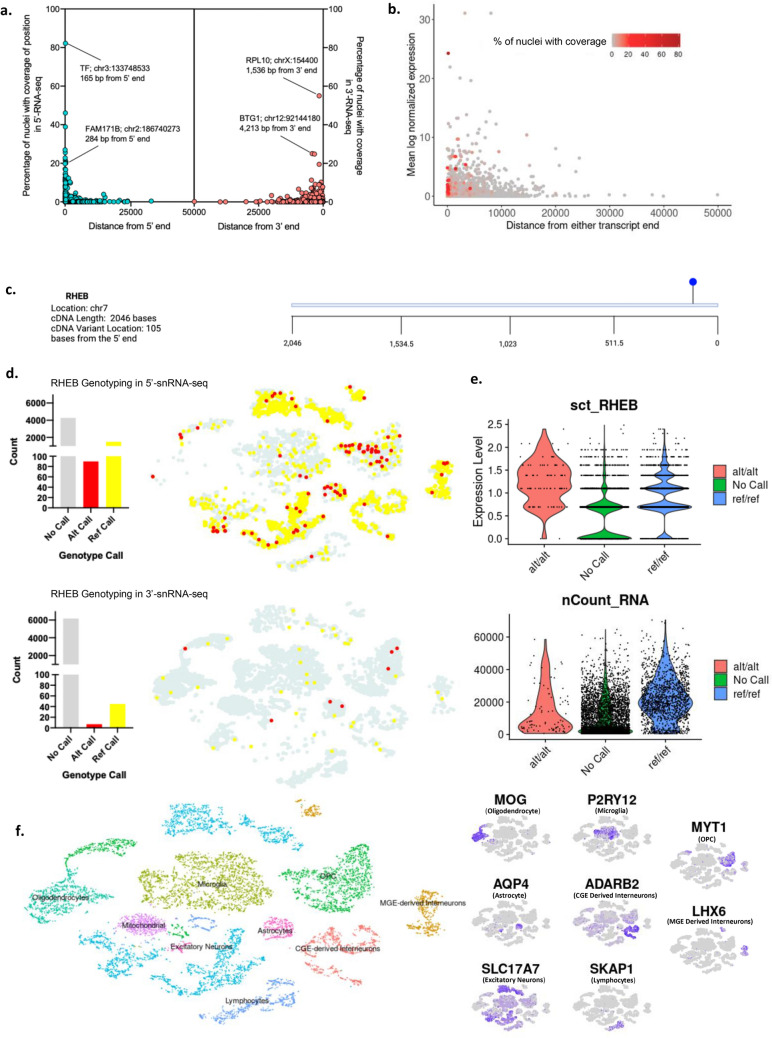
Somatic variants are a major cause of human disease, including neurological disorders like focal epilepsies, but can be challenging to study due to their mosaicism in bulk tissue biopsies. Coupling single-cell genotype and transcriptomic data has potential to provide insight into the role somatic variants play in disease etiology, such as by determining what cell types are affected or how the mutations affect gene expression. Here, we asked whether commonly used single-nucleus 3'- or 5'-RNA-sequencing assays can be used to derive single-nucleus genotype data for a priori known variants that are located near to either end of a transcript. To that end, we compared performance of commercially available single-nuclei 3'- and 5'- gene expression kits using resected brain samples from three pediatric patients with focal epilepsy. We quantified the ability to detect genetic variants in single-nucleus datasets depending on distance from the transcript end. Finally, we demonstrated the ability to identify affected cell types in a patient with a RHEB somatic variant causing an epilepsy-associated cortical malformation. Our results demonstrate that single-nuclei 3' or 5'-RNA-sequencing data can be used to identify known somatic variants in single-nuclei when they are expressed within proximity to a transcript end.


Conflict of interest statement

The authors declare no competing interests.

Figures

Figure 1
Figure 1
Study overview. (a) Patient samples were divided for variant calling from bulk exome sequencing and for single-nuclei 5’- and 3’-RNA-seq. (b) snRNA-seq datasets were evaluated for comparative performance metrics and detection of variants previously identified in exome sequencing. (c) Biomaterial was obtained from the temporal or frontal lobe of three patients in an IRB approved protocol.
Figure 2
Figure 2
Consistent sensitivity and gene expression across kits. (a) 5’ and 3’-RNA-seq libraries were sequenced to similar depth with similar number of nuclei captured. (b,c) Number of UMIs and genes detected per nucleus were similar for each kit. (d,e) Quality metrics (percent mitochondrial and ribosomal reads per nucleus) were similarly low for each kit. (f,g) Mean log-normalized gene expression values were highly correlated by kit both on average and on a per-patient basis. (h) Correlation matrix showing high concordance of gene expression in 3’ versus 5’ datasets.
Figure 3
Figure 3
Similar cell type distribution and proportion. (a) Nuclei integrated together from all six libraries clustered into nine cell type clusters. (b) Distribution of nuclei across clusters was similar for those sequenced with the 5’ or the 3’ kits. (c) Canonical cell type markers used to identify the nine cell type clusters. (d) Correlation matrix of gene expression by kit for each cell type. (e) Percentage of nuclei in each cell type cluster by kit. (f) Marker gene efficacy is similar for each capture method.
Figure 4
Figure 4
Detection of genetic variants in single-cell transcriptomes. (a) Germline variants were called for each patient from exome data and the proportion of cells with coverage of germline variant positions in single-nuclei transcriptomic data was plotted versus each variant’s proximity to the transcript end. Noted are variant positions with high coverage but greater than expected distance from the 5’ or 3’ transcript end. All calculations were done on a patient-specific basis. (b) Percentage of nuclei with coverage of each germline variant position by distance from transcript end and expression level of the gene. (c) RHEB variant position. (d) The proportion of RHEB genotype calls in nuclei from patient 47 captured via the 3’ or 5’ kit. (e) SCT normalized gene expression for RHEB shown at a single-nucleus level for each genotype call (top). Number of unique RNA molecules detected per nucleus for each genotype call (bottom). (f) The distribution of RHEB genotype calls within cell type clusters from the 3’or 5’ datasets and examples of cell type marker genes expressed within clusters of the patient 47 dataset.

References

    1. Moore L, et al. The mutational landscape of human somatic and germline cells. Nature. 2021;597(7876):381–386. doi: 10.1038/s41586-021-03822-7. - DOI - PubMed
    1. Milholland B, et al. Differences between germline and somatic mutation rates in humans and mice. Nat. Commun. 2017;8:15183. doi: 10.1038/ncomms15183. - DOI - PMC - PubMed
    1. Poduri A, et al. Somatic mutation, genomic variation, and neurological disease. Science. 2013;341(6141):1237758. doi: 10.1126/science.1237758. - DOI - PMC - PubMed
    1. Veltman JA, Brunner HG. De novo mutations in human genetic disease. Nat. Rev. Genet. 2012;13(8):565–575. doi: 10.1038/nrg3241. - DOI - PubMed
    1. Biesecker LG, Spinner NB. A genomic view of mosaicism and human disease. Nat. Rev. Genet. 2013;14(5):307–320. doi: 10.1038/nrg3424. - DOI - PubMed