. 2023 Jan 11;14(1):166.
doi: 10.1038/s41467-023-35853-1.

The SPOC domain is a phosphoserine binding module that bridges transcription machinery with co- and post-transcriptional regulators

Affiliations

The SPOC domain is a phosphoserine binding module that bridges transcription machinery with co- and post-transcriptional regulators

Lisa-Marie Appel et al. Nat Commun. .

Abstract

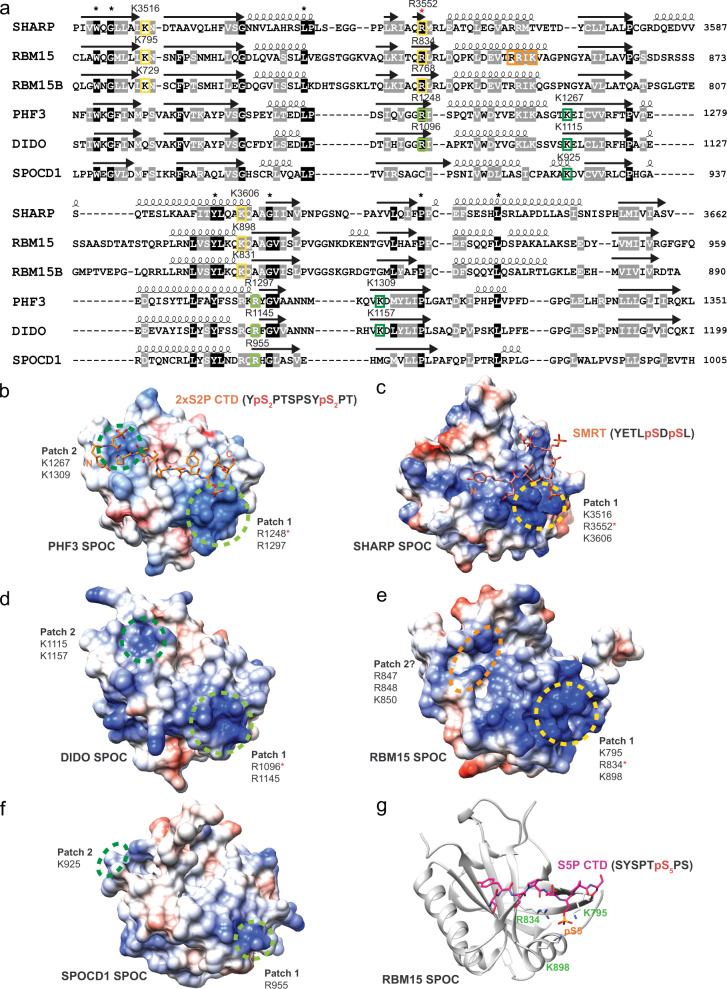
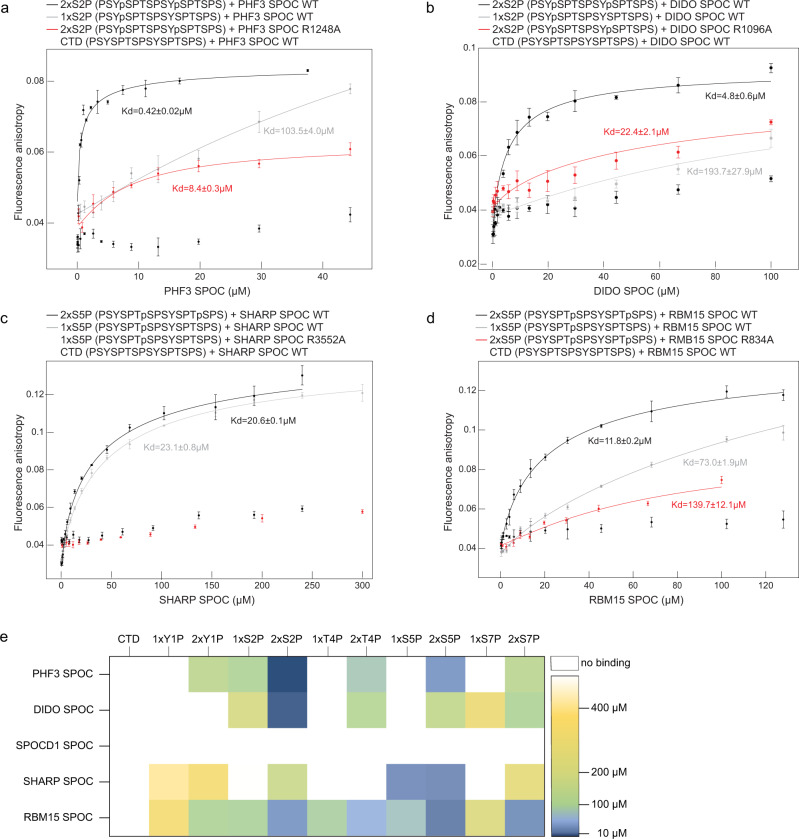
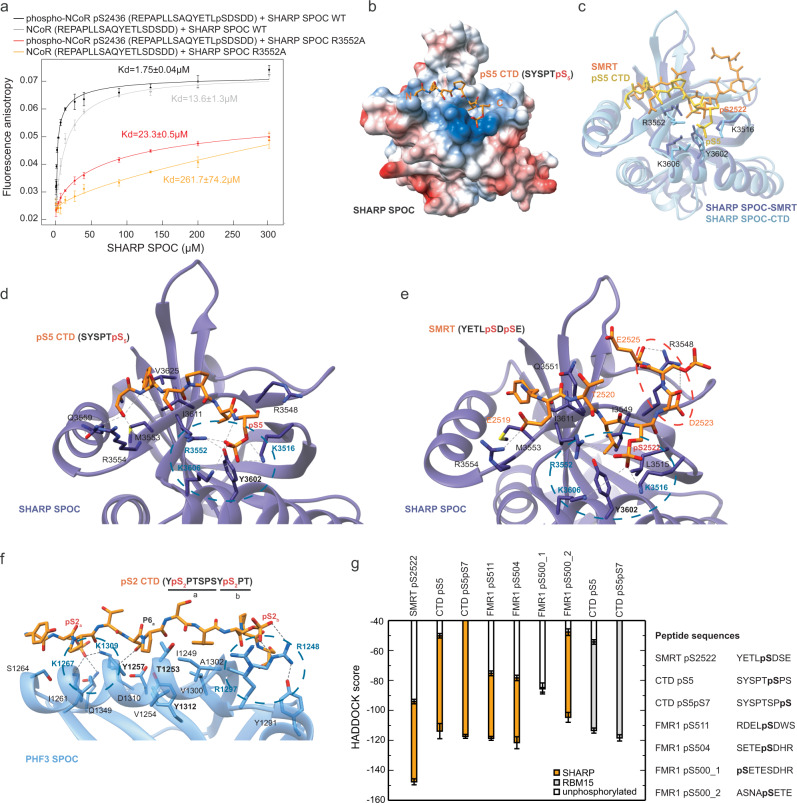
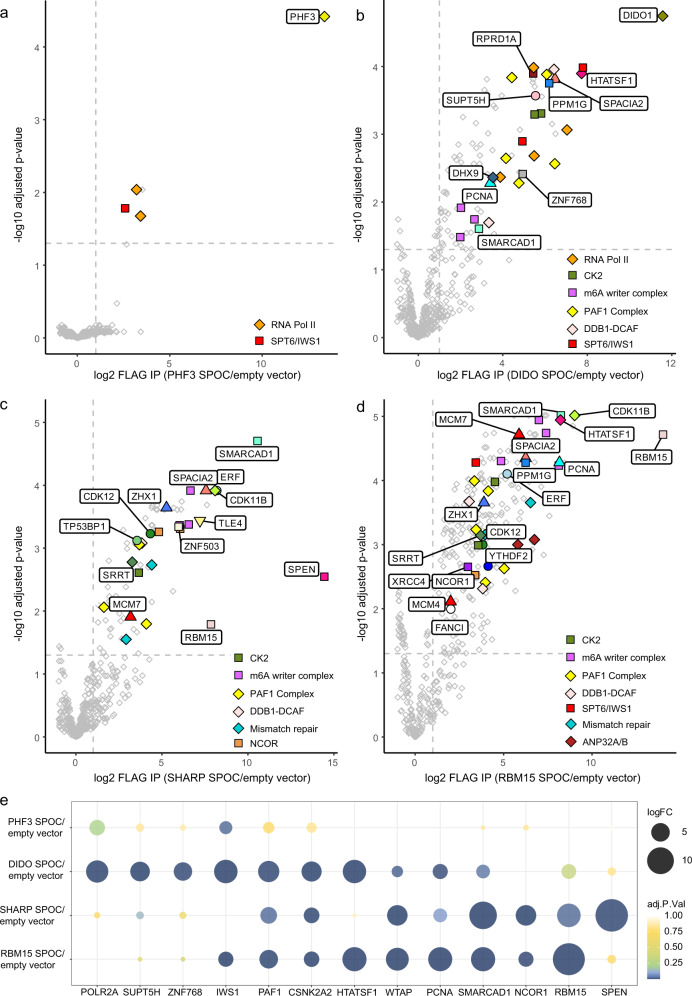
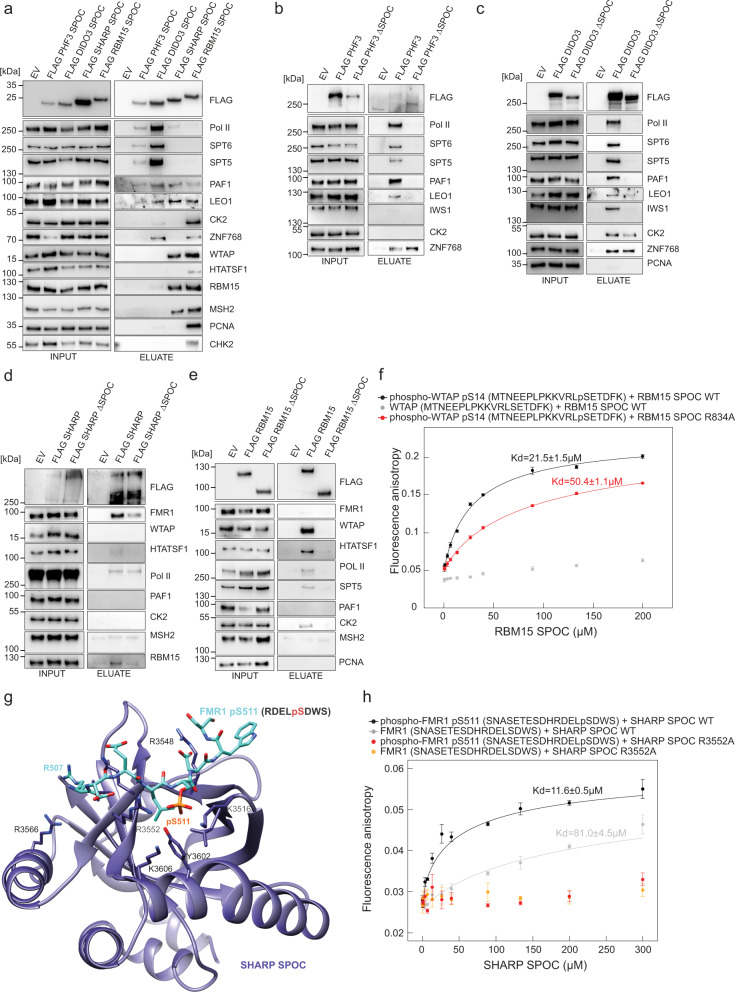
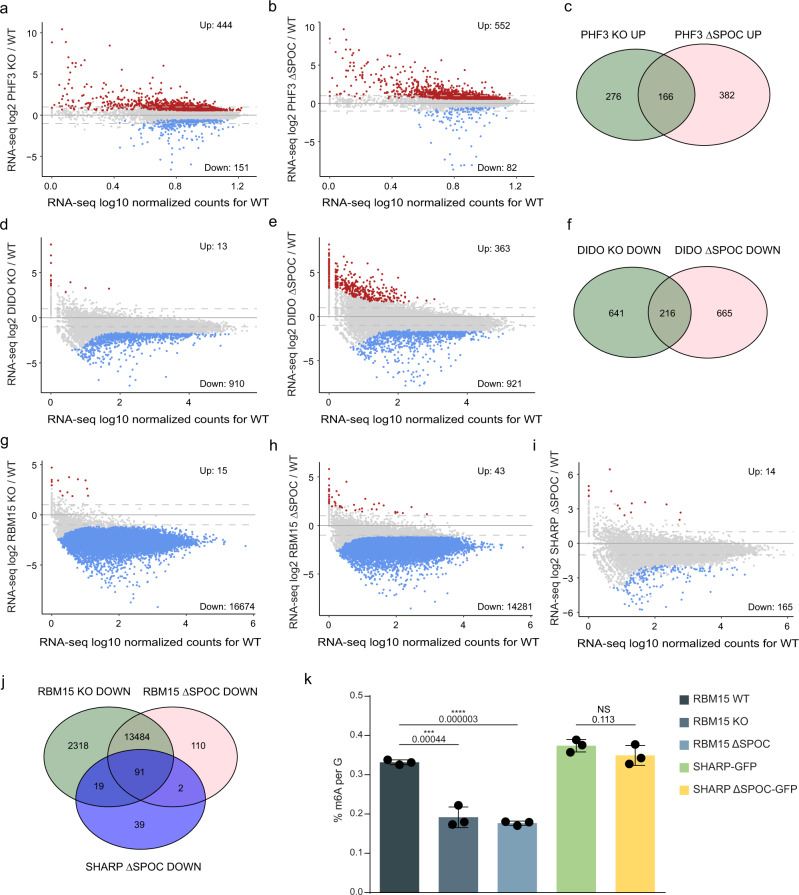
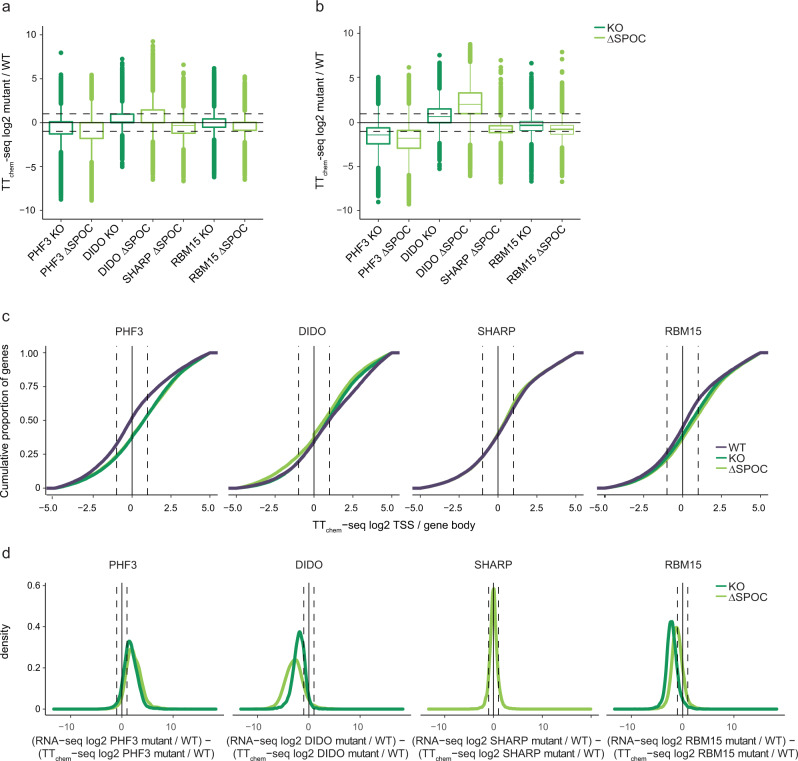
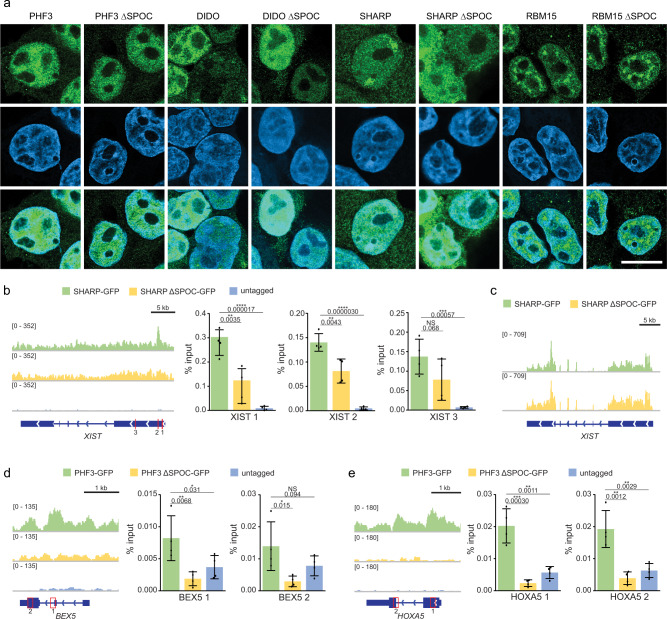
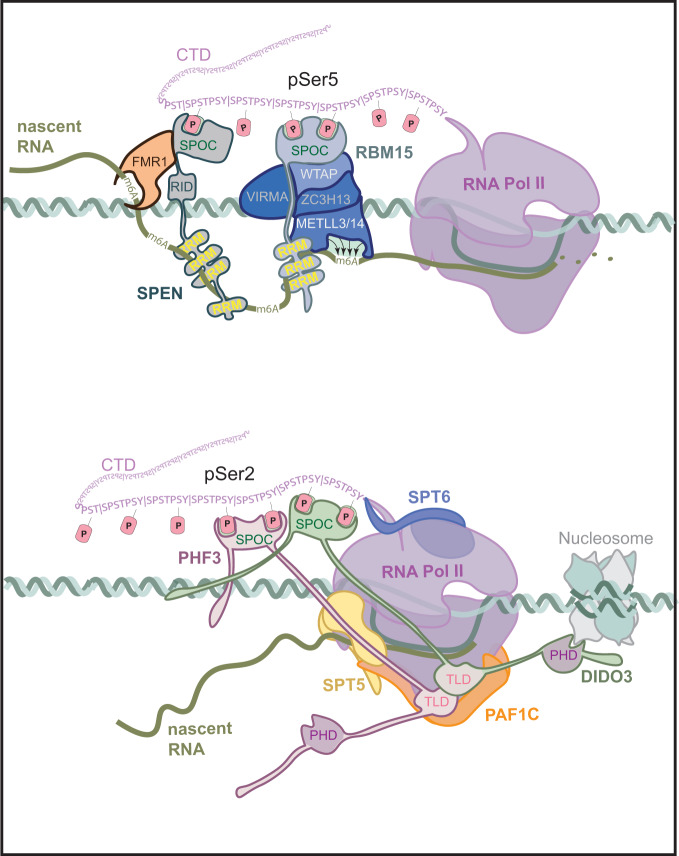
The heptad repeats of the C-terminal domain (CTD) of RNA polymerase II (Pol II) are extensively modified throughout the transcription cycle. The CTD coordinates RNA synthesis and processing by recruiting transcription regulators as well as RNA capping, splicing and 3'end processing factors. The SPOC domain of PHF3 was recently identified as a CTD reader domain specifically binding to phosphorylated serine-2 residues in adjacent CTD repeats. Here, we establish the SPOC domains of the human proteins DIDO, SHARP (also known as SPEN) and RBM15 as phosphoserine binding modules that can act as CTD readers but also recognize other phosphorylated binding partners. We report the crystal structure of SHARP SPOC in complex with CTD and identify the molecular determinants for its specific binding to phosphorylated serine-5. PHF3 and DIDO SPOC domains preferentially interact with the Pol II elongation complex, while RBM15 and SHARP SPOC domains engage with writers and readers of m6A, the most abundant RNA modification. RBM15 positively regulates m6A levels and mRNA stability in a SPOC-dependent manner, while SHARP SPOC is essential for its localization to inactive X-chromosomes. Our findings suggest that the SPOC domain is a major interface between the transcription machinery and regulators of transcription and co-transcriptional processes.


Conflict of interest statement

The authors declare no competing interests.

Figures

Fig. 1
Fig. 1. Conserved surfaces on SPOC mediate phosphoserine binding.
a Multiple sequence alignment of human SPOC domains based on PROMALSD3 using SPOC structures from human SHARP (2RT5), human PHF3 (6Q2V) and sequences from human RBM15, RBM15B, DIDO and SPOCD1. Colored squares indicate conserved residues that constitute basic patches on the surface of SPOC. The patches are marked in the same colors in (bf). A red asterisk indicates an arginine residue that is conserved in all human SPOC domains except SPOCD1. Secondary structure elements are indicated above the primary sequence. b Crystal structure of PHF3 SPOC in complex with 2×S2P CTD peptide (6IC8). Conserved basic patches that mediate binding to phosphorylated CTD residues are indicated with green circles. The distance between the patches is 24 Å. c NMR solution structure of SHARP SPOC in complex with phosphorylated SMRT peptide (2RT5). The yellow circle indicates the conserved basic patch that coordinates binding to SMRT pS2522. d AlphaFold2 structural model DIDO SPOC (Q9BTC0). Green circles indicate conserved surface patches. The distance between the patches is 21 Å. e Crystal structure of RBM15 SPOC (7Z27). Colored circles indicate the conserved basic surface patch (patch 1, yellow) and a potential second patch (patch 2, orange). The distance between the patches is 21 Å. f AlphaFold2 structural model of SPOCD1 SPOC (Q6ZMY3). The surface patches indicated by green circles are only partially conserved and display a less pronounced positive charge. The distance between the patches is 36 Å. g Structural model of the interaction between RBM15 SPOC and serine-5-phosphorylated CTD generated in PyMOL and refined using the HADDOCK2.2 webserver,. All SPOC domains are shown in the same orientation and at the same scale. Electrostatic surface potential in (bf) was calculated using the Coulombic Surface Coloring tool in UCSF Chimera and is depicted ranging from −10 (red) to +10 (blue) kcal/(mol*e). The distances in (b) and (df) are given as the mean distance between the terminal atoms of the amino acids making up the basic patches and were measured using the structure measurements—distances tool in UCSF Chimera.
Fig. 2
Fig. 2. SPOC is a CTD binding domain.
ad Fluorescence anisotropy measurements of SPOC domains and CTD peptides. Fluorescence anisotropy is plotted as a function of protein concentration. Data points and error bars represent the mean ± standard deviation from three independent experiments. e Heatmap of binding affinities of SPOC domains to CTD peptides. Source data are provided as a Source Data file.
Fig. 3
Fig. 3. Acidic residues determine SHARP SPOC binding affinity.
a Fluorescence anisotropy binding curves of SHARP SPOC with NCoR peptides. Fluorescence anisotropy is plotted as a function of protein concentration. Data points and error bars represent the mean ± standard deviation from three independent experiments. Source data are provided as a Source Data file. b Crystal structure of SHARP SPOC in complex with 1×S5P CTD peptide (7Z1K). Electrostatic surface potential was calculated using the Coulombic Surface Coloring tool in UCSF Chimera and is depicted ranging from −10 (red) to +10 (blue) kcal/(mol*e). c Structural comparison of SHARP SPOC binding to 1×S5P CTD and SMRT (2RT5). d Interactions between SHARP SPOC and 1×S5P CTD. Hydrogen bonds are indicated with dashed lines. The blue circle indicates a conserved basic surface patch. e Interactions between SHARP SPOC and phosphorylated SMRT (2RT5). Hydrogen bonds are indicated with dashed lines. The blue circle indicates the conserved basic surface patch, red circle indicates additional electrostatic coordination of R3548 of SPOC by D2523 and E2525 of SMRT, which is not possible with CTD. f Interactions between PHF3 SPOC and 2×S2P CTD (6Q2V). Hydrogen bonds are indicated with dashed lines. Blue circles indicate conserved basic surface patches. g HADDOCK scores of modeled interactions between SHARP SPOC or RBM15 SPOC and SMRT, CTD, or FMR1 peptides. Peptides used for modeling were either unphosphorylated (white bars) or phosphorylated at the indicated residues (SHARP SPOC: orange bars, RBM15 SPOC: gray bars). Bars correspond to the HADDOCK score ± SD calculated by HADDOCK. Source data are provided as a Source Data file.
Fig. 4
Fig. 4. Mass spectrometry analysis of SPOC domain interactome.
ad Volcano plots of a PHF3, b DIDO, c SHARP, d RBM15 SPOC interactors identified by mass spectrometry. e Overview of common SPOC domain interactors identified by mass spectrometry. The experiments were performed in three individual replicates. Statistical tests were performed using the LIMMA package.
Fig. 5
Fig. 5. Interactome of SPOC proteins.
a Western Blot analysis after FLAG-co-IP of FLAG-tagged SPOC domains. be Western Blot analysis after FLAG-co-IP of FLAG-tagged full-length and ΔSPOC proteins. The experiments in ae were performed once. f Fluorescence anisotropy binding curves of RBM15 SPOC with WTAP peptides. Fluorescence anisotropy is plotted as a function of protein concentration. Data points and error bars show mean anisotropy ± standard deviation from three independent experiments. g Structural model of the interaction between SHARP SPOC and an 8-mer FMR peptide phosphorylated at S511 generated in PyMOL and refined using the HADDOCK2.2 webserver,. Repulsion between SHARP R3566 and FMR R507 may lead to reduced binding affinity compared to SMRT. h Fluorescence anisotropy binding curves of SHARP SPOC with FMR1 peptides. Fluorescence anisotropy is plotted as a function of protein concentration. Data points and error bars show mean anisotropy ± standard deviation from three independent experiments. Source data are provided as a Source Data file.
Fig. 6
Fig. 6. SPOC domain proteins regulate gene expression and m6A levels.
a, b, d, e, gi MA plots showing RNA-seq log2 fold change (KO/WT or ΔSPOC/WT) versus log10 mean expression in WT for a PKF3 KO, b PHF3 ΔSPOC, d DIDO KO, e DIDO ΔSPOC, g RBM15 KO, h RBM15 ΔSPOC, and i SHARP ΔSPOC. Red and blue dots indicate upregulated and downregulated genes, respectively with fold-change > 2, p < 0.05. Statistical analysis was performed using the Wald test as implemented in DESeq2. Drosophila S2 cells were used for spike-in normalization. c, f, j Venn diagram showing overlaps between c upregulated genes in PHF3 KO and PHF3 ΔSPOC, f downregulated genes in DIDO KO and DIDO ΔSPOC, j downregulated genes in SHARP ΔSPOC, RBM15, and RBM15 ΔSPOC. k m6A levels are decreased upon impairment of RBM15. Mass spectrometry analysis of single nucleosides derived from mRNA isolated from the indicated cell lines. Data are presented as mean ± standard deviation of three replicates, and individual data points are indicated as black dots. One-tailed, two-sample equal variance t-test was used to determine p-values. Source data are provided as a Source Data file.
Fig. 7
Fig. 7. SPOC domain proteins regulate transcription and mRNA stability.
a, b Genome-wide distribution of log2 fold changes of TTchem-seq signal in KO and ΔSPOC relative to WT on a TSS and b gene body regions. Box plots show the median (central line), the 25–75% interquartile range (IQR) (box limits), and the ±1.5× IQR (whiskers). Median, minimum, maximum, and 25 and 75% percentile values are provided in the Source Data file. Cells were treated with 1 mM 4sU for 15 min. In vitro transcribed synthetic 4sU-labeled RNA and 4sU-labeled yeast RNA were used for spike-in normalization. Experiments were performed in three independent replicates. c Stalling index analysis calculated as TTchem-seq TSS/gene body signal. d Density distribution of the differences in log2 fold changes KO/WT or ΔSPOC/WT between RNA-seq and TTchem-seq data. Source data are provided as a Source Data file.
Fig. 8
Fig. 8. SPOC domains determine genomic localization.
a Cellular localization of SPOC proteins analyzed by immunofluorescence microscopy. Exemplary Airyscan images showing the localization of wild-type and SPOC-deleted proteins for PHF3, DIDO, SHARP, and RBM15 (green). DAPI and merged images are shown below. Localization of each protein of interest was acquired in biological duplicates. Scale bar = 10 μm. b Integrative Genomics Viewer (IGV) snapshots showing GFP-ChIP-seq reads and GFP-ChIP-qPCR analysis for XIST in SHARP-GFP, SHARP ΔSPOC-GFP, and untagged HEK293T cells. c IGV snapshots showing RNA-seq reads for XIST in SHARP-GFP and SHARP ΔSPOC-GFP cells. d IGV snapshots showing GFP-ChIP-seq reads and GFP-ChIP-qPCR analysis for BEX5 in PHF3-GFP, PHF3 ΔSPOC-GFP, and untagged HEK293T cells. e IGV snapshots showing GFP-ChIP-seq reads and GFP-ChIP-qPCR analysis for HOXA5 in PHF3-GFP, PHF3 ΔSPOC-GFP, and untagged HEK293T cells. The qPCR data in b, d, e are presented as mean ± standard deviation of four individual experiments, individual data points are indicated as black dots. One-tailed, two-sample equal variance t-test was used to determine p-values. qPCR amplicons are indicated as red boxes. Source data are provided as a Source Data file.
Fig. 9
Fig. 9. SPOC bridges transcription with co-and post-transcriptional processes.
SHARP and RBM15 interact with RNA and writers and readers of m6A RNA modification, while PHF3 and DIDO interact with regulators of transcription and co-transcriptional processing. SPOC protein interactions, in turn, regulate downstream processes like translation and mRNA decay.

References

    1. Sánchez-Pulido L, Rojas AM, van Wely KH, Martinez-A C, Valencia A. SPOC: a widely distributed domain associated with cancer, apoptosis and transcription. BMC Bioinforma. 2004;5:6–11. doi: 10.1186/1471-2105-5-91. - DOI - PMC - PubMed
    1. Ariyoshi M, Schwabe JWR. A conserved structural motif reveals the essential transcriptional repression function of spen proteins and their role in developmental signaling. Genes Dev. 2003;17:1909–1920. doi: 10.1101/gad.266203. - DOI - PMC - PubMed
    1. Mikami S, et al. Structural insights into the recruitment of SMRT by the corepressor SHARP under phosphorylative regulation. Structure. 2014;22:35–46. doi: 10.1016/j.str.2013.10.007. - DOI - PubMed
    1. Zhang, Y., Rataj, K., Simpson, G. G. & Tong, L. Crystal structure of the SPOC domain of the arabidopsis flowering regulator FPA. PLoS ONE10.1371/journal.pone.0160694 (2016). - PMC - PubMed
    1. Appel L-M, et al. PHF3 regulates neuronal gene expression through the Pol II CTD reader domain SPOC. Nat. Commun. 2021;12:6078. doi: 10.1038/s41467-021-26360-2. - DOI - PMC - PubMed

Publication types

MeSH terms