. 2023 Jun;30(6):487-502.
doi: 10.1038/s41434-022-00381-y. Epub 2023 Jan 11.

Preclinical evaluation of FLT190, a liver-directed AAV gene therapy for Fabry disease

Affiliations

Preclinical evaluation of FLT190, a liver-directed AAV gene therapy for Fabry disease

Jey M Jeyakumar et al. Gene Ther. 2023 Jun.

Abstract

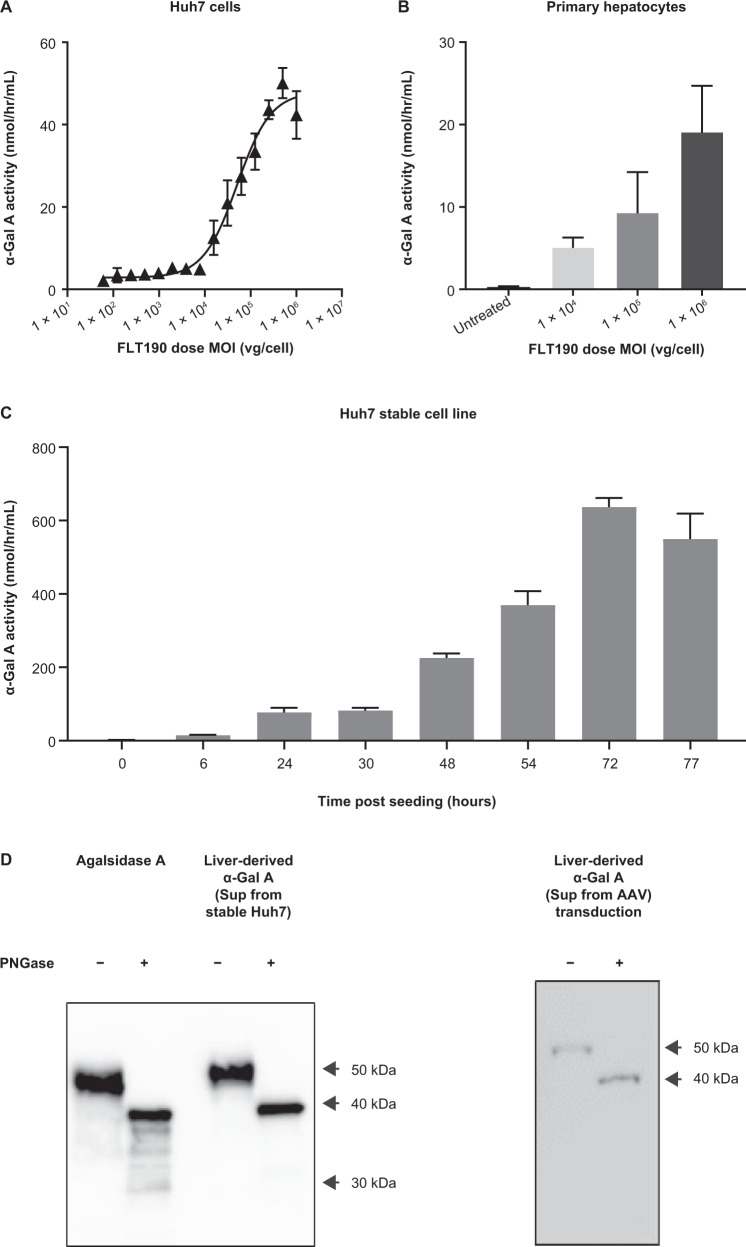
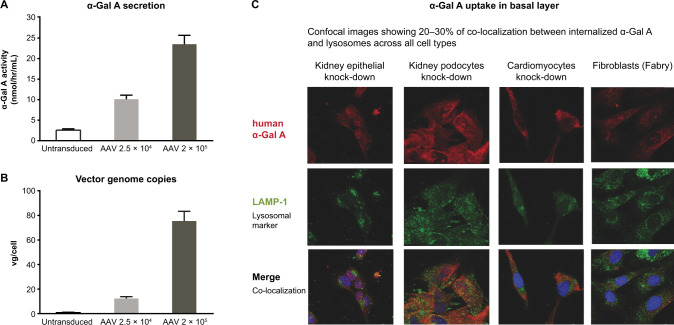
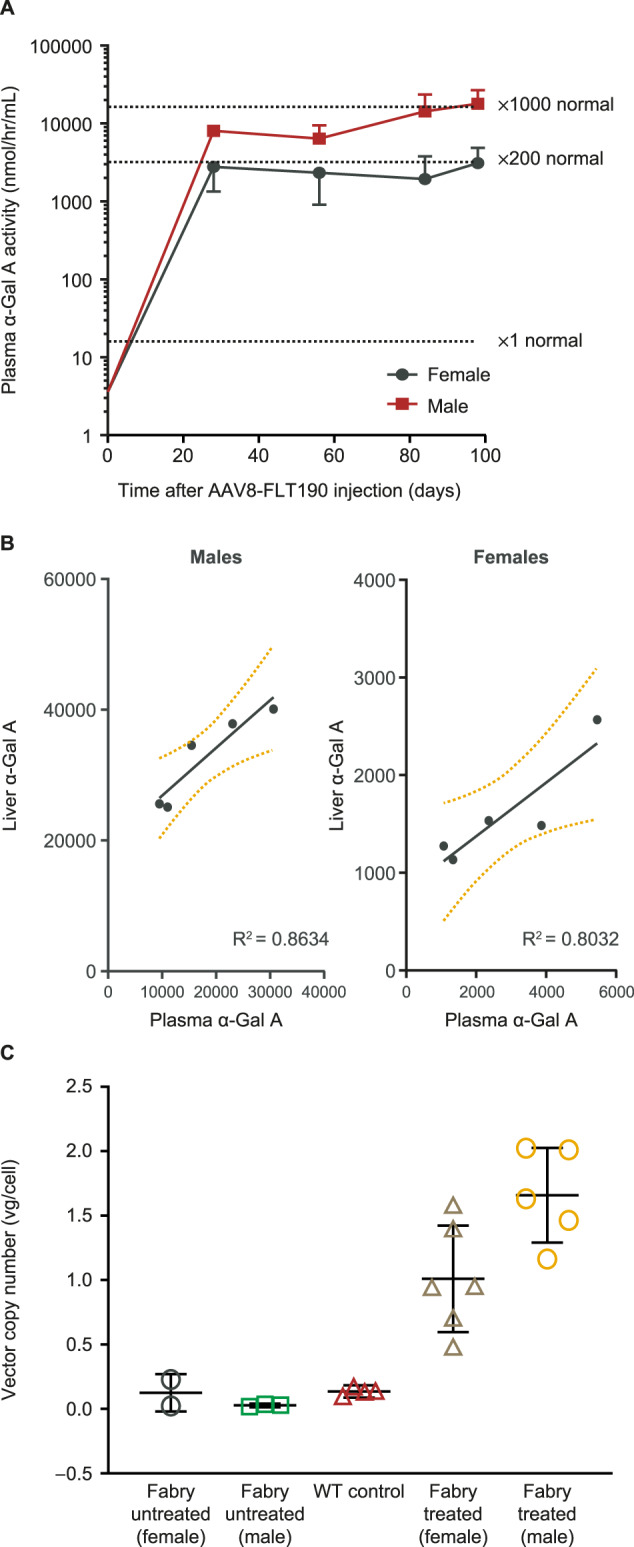
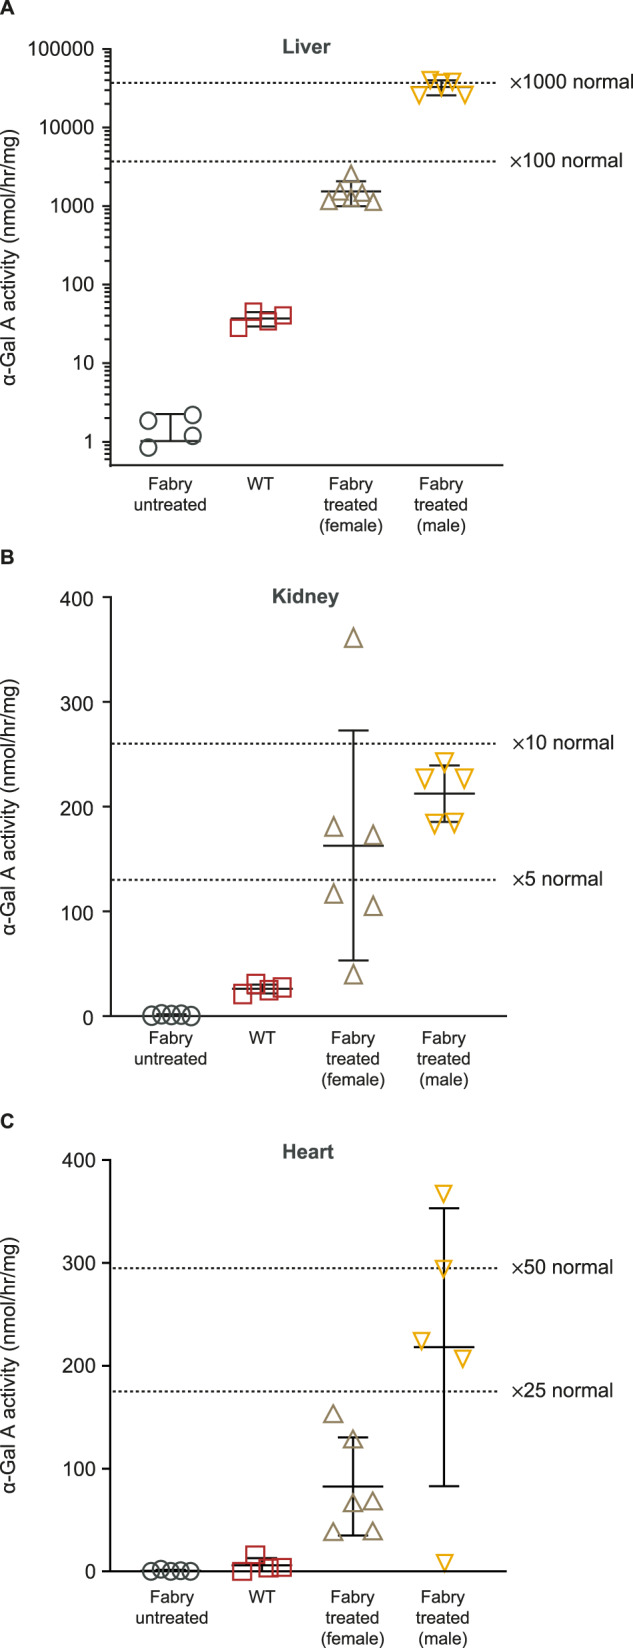
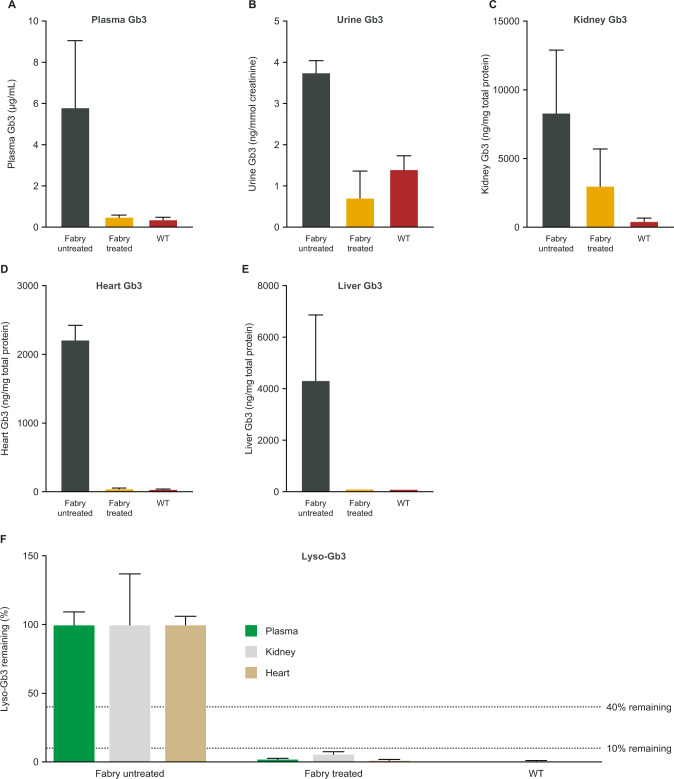
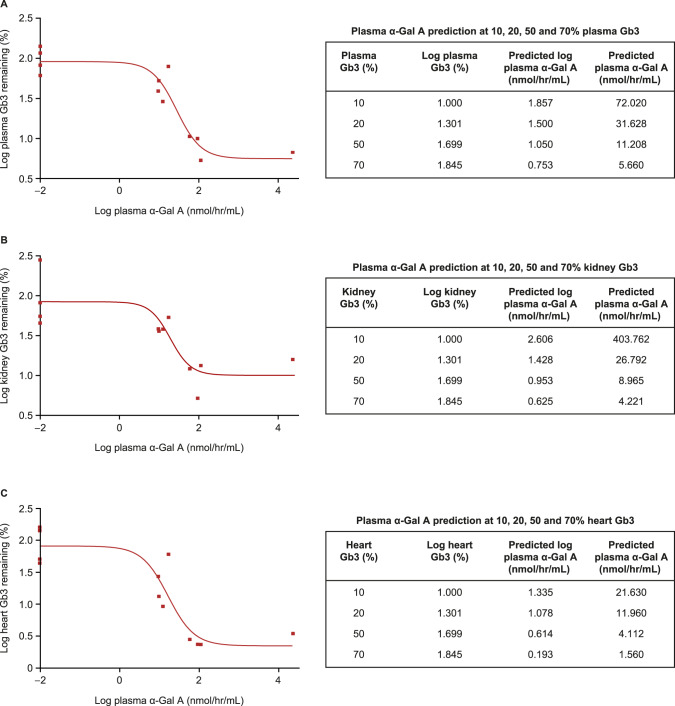
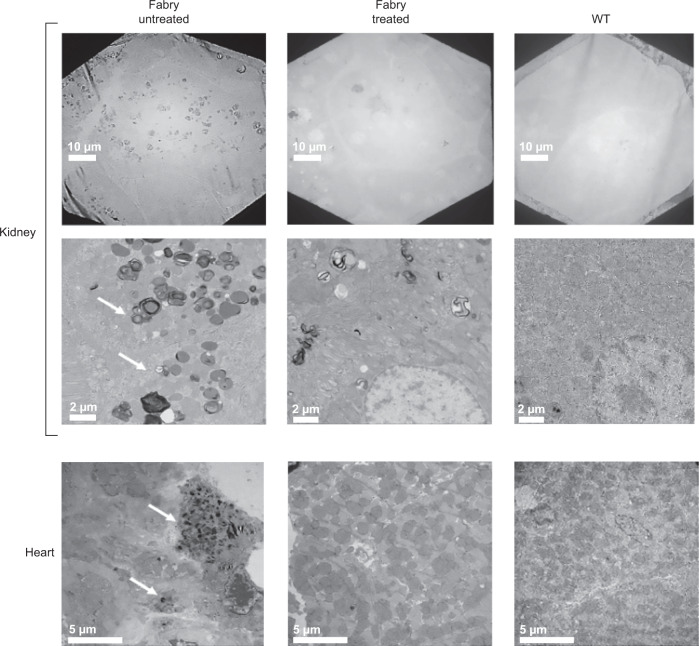
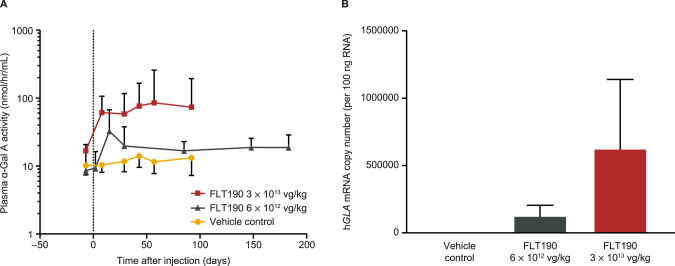
Fabry disease is an X-linked lysosomal storage disorder caused by loss of alpha-galactosidase A (α-Gal A) activity and is characterized by progressive accumulation of glycosphingolipids in multiple cells and tissues. FLT190, an investigational gene therapy, is currently being evaluated in a Phase 1/2 clinical trial in patients with Fabry disease (NCT04040049). FLT190 consists of a potent, synthetic capsid (AAVS3) containing an expression cassette with a codon-optimized human GLA cDNA under the control of a liver-specific promoter FRE1 (AAV2/S3-FRE1-GLAco). For mouse studies FLT190 genome was pseudotyped with AAV8 for efficient transduction. Preclinical studies in a murine model of Fabry disease (Gla-deficient mice), and non-human primates (NHPs) showed dose-dependent increases in plasma α-Gal A with steady-state observed 2 weeks following a single intravenous dose. In Fabry mice, AAV8-FLT190 treatment resulted in clearance of globotriaosylceramide (Gb3) and globotriaosylsphingosine (lyso-Gb3) in plasma, urine, kidney, and heart; electron microscopy analyses confirmed reductions in storage inclusion bodies in kidney and heart. In NHPs, α-Gal A expression was consistent with the levels of hGLA mRNA in liver, and no FLT190-related toxicities or adverse events were observed. Taken together, these studies demonstrate preclinical proof-of-concept of liver-directed gene therapy with FLT190 for the treatment of Fabry disease.


Conflict of interest statement

JJ, AK, LT, EC, NC, DV, PH, PK, CC, CM, MC, JK, RS, RC are employees and/or shareholders of Freeline Therapeutics. AN is a Director, shareholder, and holds patents with Freeline Therapeutics. DH: Advisory Boards: Freeline Therapeutics, Sanofi, Takeda, Amicus, Idorsia; Consulting Fees: Freeline Therapeutics, Sanofi, Takeda, Amicus, Idorsia, Protalix, Sangamo; Honoraria: Freeline Therapeutics, Sanofi, Takeda, Amicus, Idorsia. The other authors declare no competing interests.

Figures

Fig. 1
Fig. 1. GLA transgene expression and characterization in cultured hepatocytes.
Kinetics of α-Gal A secretion following FLT190 vector transduction in A Huh7 hepatocyte cell line and B human primary hepatocytes. C α-Gal A secretion from Huh7 cells engineered to overexpress α-Gal A. D Glycosylation analysis of α-Gal A produced from Huh7 cells following PNGase F digestion – representative Western blot analyses are shown. Agalsidase alfa was used as a comparator. Data are mean ± SD (n = 3). α-Gal A = alpha galactosidase A; AAV = adeno-associated virus; Huh7 = human hepatocyte cell line; MOI = multiplicity of infection; PNGase F = Peptide:N-Glycosidase F; SD = standard deviation; vg = vector genomes.
Fig. 2
Fig. 2. Uptake of α-Gal A by Fabry relevant target cells following transwell co-culture with FLT190 transduced Huh7 cells.
A α-Gal A activity was measured in the culture media of basal transwells following co-culturing of AAV transduced Huh7 cells. B vg copy numbers. C Colocalization of internalized α-Gal A and lysosomes. Representative confocal images of co-cultured knock-down cell lines co-stained with HA-tag and LAMP-1 antibodies. α-Gal A = alpha galactosidase A; AAV, adeno-associated virus; HA-tag = hemagglutinin tag; Huh7 = human hepatocyte cell line; LAMP-1 = lysosomal-associated membrane protein 1; vg = vector genomes.
Fig. 3
Fig. 3. α-Gal A activity in plasma following administration of AAV8-FLT190 or ERT in wild-type (WT) mice.
A Time course of α-Gal A enzyme activity levels in the plasma of WT mice that received AAV8-FLT190 6 x 1011, 2 × 1012 or 6 x 1012 vg/kg. Data are mean ± SD, n = 4–8 animals per time point. Plasma was collected by tail vein bleeding at the indicated times and the enzyme activity was measured using the fluorogenic substrate 4-methylumbelliferyl-α-D-galactopyranoside. B Plasma clearance curves after intravenous injection of agalsidase alfa at 0.2 mg/kg, in male WT mice. ERT pharmacokinetics using one-phase decay model data are mean ± SD, n = 5 animals per time point. Dotted line indicates plasma α-Gal A at steady state levels following AAV8-FLT190 in wild-type mice. α-Gal A = alpha galactosidase A; AAV8 = adeno-associated virus serotype 8; ERT = enzyme replacement therapy; SD = standard deviation; vg = vector genomes; WT = wild type.
Fig. 4
Fig. 4. AAV8-FLT190 in Gla-deficient (Fabry) mice.
A α-Gal A enzyme activity levels in plasma of Gla-deficient (Fabry) mice that received AAV8-FLT190 2 × 1012 vg/kg. Plasma was collected by tail vein bleeding at the times indicated and enzymatic activity was measured using the fluorogenic substrate 4-methylumbelliferyl-α-D-galactopyranoside. Data are expressed as mean ± SD, n = 5 to 6 animals per time point, males (n = 5) and females (n = 6). Wild-type α-Gal A level is shown as x1 normal, based on the measured activity from 4 animals. Data were analyzed using one-way ANOVA with Bonferroni correction for multiple comparisons. α-Gal A activity was significantly higher in AAV8-FLT190-treated mice when treatment group means were compared with untreated control means (p < 0.0001). B α-Gal A expression and secretion relationship for individual animals showing a positive correlation for liver homogenate to plasma α-Gal A enzyme activity levels. C Levels of vector genome present in murine liver lysate following administration of AAV8-FLT190 in Fabry mice. Amount of vector genome present in liver lysate was determined by QPCR using sets of primers targeting the FRE1 promoter. GAPDH was quantified using primers targeting mouse GAPDH. α-Gal A = alpha galactosidase A; AAV8 = adeno-associated virus serotype 8; FRE1 = Freeline-derived promoter; GAPDH = glyceraldehyde-3-phosphate dehydrogenase; QPCR = quantitative polymerase chain reaction; SD = standard deviation; vg = vector genomes; WT = wild type.
Fig. 5
Fig. 5. α-Gal A enzyme activity levels in the liver, kidney and heart of Fabry mice administered AAV8-FLT190 2 × 1012 vg/kg.
α-Gal A enzyme activity was measured using the fluorogenic substrate 4-methylumbelliferyl-α-D-galactopyranoside. Data are mean ± SD, n = 4 to 6 animals per time point. One-way ANOVA with Bonferroni correction was used to compare mean of all treatment groups (AAV8-FLT190 treated vs. untreated (vehicle) controls, p < 0.0001). Fold increase was calculated based on WT untreated controls (n = 4). α-Gal A = alpha galactosidase A; AAV8 = adeno-associated virus serotype 8; SD = standard deviation; vg = vector genomes; WT = wild type.
Fig. 6
Fig. 6. Levels of Gb3 and Lyso-Gb3 in plasma, urine and organs of Fabry mice administered AAV8-FLT190 2 × 1012 vg/kg.
Data are mean ± SD, n = 4 animals per time point, analyzed 14 weeks after treatment at 7.5 months of age. n = 4 for untreated age-matched control group, n = 2 for WT mice. The relative reduction of Lyso-Gb3 is shown as % remaining storage. Unpaired t-test was used to compare means of all treatment groups. AAV8-FLT190 treated vs. untreated controls: plasma Gb3 (p = 0.0084); plasma Lyso-Gb3 (p < 0.0001); urine Gb3 (p = 0.02); kidney Gb3 (p = 0.045); kidney Lyso-Gb3 (p = 0.022); heart Gb3 (p < 0.0001); heart Lyso-Gb3 (p ≤ 0.0001); liver Gb3 (p = 0.0075). AAV8 = adeno-associated virus serotype 8; lyso-Gb3 = globotriaosylsphingosine; Gb3 = globotriaosylceramide; SD = standard deviation; vg = vector genomes; WT = wild type.
Fig. 7
Fig. 7. Correlating Plasma α-Gal A to Gb3.
Correlating plasma α-Gal A to Gb3 using a nonlinear fit regression model Marquardt method in SAS System. Percentage (%) of remaining storage relative to untreated controls, Sigmoid (4PL) Fit: X = Log α-Gal A, Y = Logged Gb3 analysis is shown. The R2 values are the following: plasma = 0.89 (A), for kidney = 0.72 (B), and for heart = 0.82 (C). The main purpose of the curve fitting was to predict plasma α-Gal A values for various levels of Gb3 reduction (e.g. 50%), exploring log(plasma Gb3), log(kidney Gb3) and log(heart Gb3) values as the y responses. α-Gal A prediction at 10%, 20%, 50% and 70% remaining storage are shown in tables. Statistical packages SAS and GraphPad Prism were used for the analysis. α-Gal A = alpha galactosidase A; Gb3 = globotriaosylceramide.
Fig. 8
Fig. 8. Representative electron microscopy images of kidney and heart tissues from Fabry mice untreated (left) and following administration of AAV8-FLT190 (right).
Tissues from kidney, renal cortex and apex of the heart were processed for electron microscopy. The arrows indicate pathological changes resulting from Fabry disease-like features (storage inclusion bodies). Clearance of substrate was observed in AAV8-FLT190-treated mice compared with vehicle control Fabry mice. Representative pictures shown. The scale bar represents 10 µm and 2 µm for kidney, and 5 µm for heart. AAV8 = adeno-associated virus serotype 8; WT = wild type.
Fig. 9
Fig. 9. FLT190 evaluation in NHPs.
A α-Gal A enzyme activity levels in the plasma of NHPs administered FLT190 3 × 1013 vg/kg or 6 × 1012 vg/kg dose. B hGLA mRNA levels in liver biopsies. Plasma was collected at the times indicated and the enzyme activity was measured using the fluorogenic substrate 4-methylumbelliferyl-α-D-galactopyranoside (nmol/hr/mL). Data are geometric mean ± SD, n = 6 animals per time point (vehicle control and 3 × 1013 vg/kg) or n = 3 animals per time point (6 × 1012 vg/kg). Two-way ANOVA with repeated measures was used to compare treatment groups. FLT190-treated vs. untreated (vehicle) control, p = 0.0003. α-Gal A = alpha galactosidase A; hGLA = human α-galactosidase A gene; mRNA = messenger ribonucleic acid; NHP = nonhuman primate; RNA = ribonucleic acid; SD = standard deviation; vg = vector genomes.

References

    1. Ortiz A, Germain DP, Desnick RJ, Politei J, Mauer M, Burlina A, et al. Fabry disease revisited: Management and treatment recommendations for adult patients. Mol Gen Metabol. 2018;123:416–27. doi: 10.1016/j.ymgme.2018.02.014. - DOI - PubMed
    1. van der Veen S, Hollak CEM, van Kuilenburg ABP, Langeveld M. Developments in the treatment of Fabry disease. J Inherit Metab Dis. 2020;43:908–21. doi: 10.1002/jimd.12228. - DOI - PMC - PubMed
    1. Arends M, Biegstraaten M, Wanner C, Sirrs S, Mehta A, Elliott PM, et al. Agalsidase alfa versus agalsidase beta for the treatment of Fabry disease: an international cohort study. J Med Genet. 2018;5:351–8. doi: 10.1136/jmedgenet-2017-104863. - DOI - PMC - PubMed
    1. El Dib R, Gomaa H, Carvalho RP, Camargo SE, Bazan R, Barretti P, et al. Enzyme replacement therapy for Anderson-Fabry disease. Cochrane Database Syst Rev. 2016;7:CD006663. - PMC - PubMed
    1. McCafferty EH, Scott LJ. Migalastat: A review in Fabry disease. Drugs. 2019;79:543–54.. doi: 10.1007/s40265-019-01090-4. - DOI - PMC - PubMed

Publication types

Substances

Associated data