. 2023 Jan;613(7945):743-750.
doi: 10.1038/s41586-022-05593-1. Epub 2023 Jan 11.

γδ T cells are effectors of immunotherapy in cancers with HLA class I defects

Affiliations

γδ T cells are effectors of immunotherapy in cancers with HLA class I defects

Natasja L de Vries et al. Nature. 2023 Jan.

Abstract

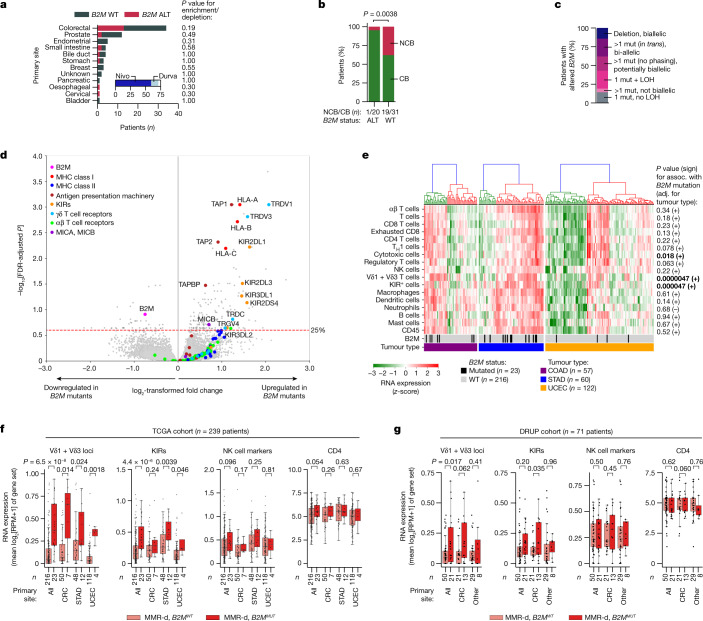
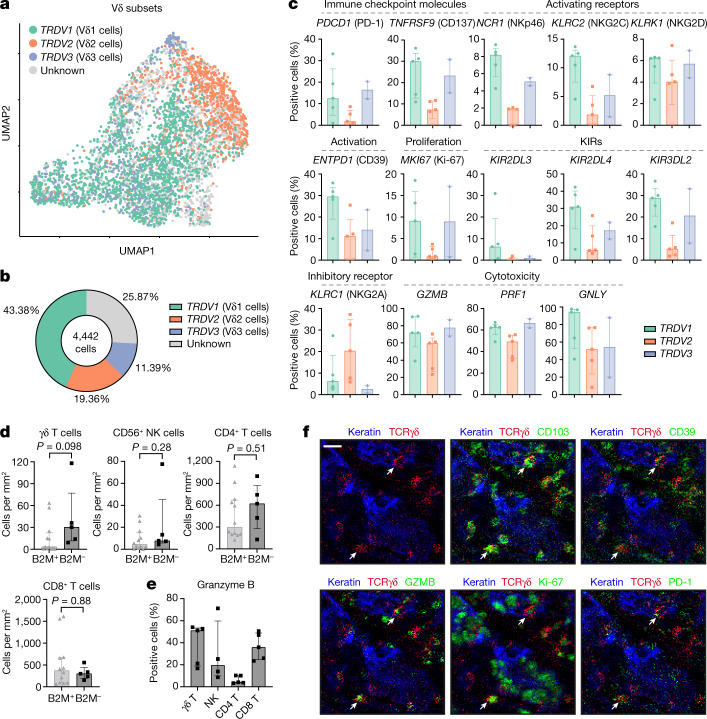
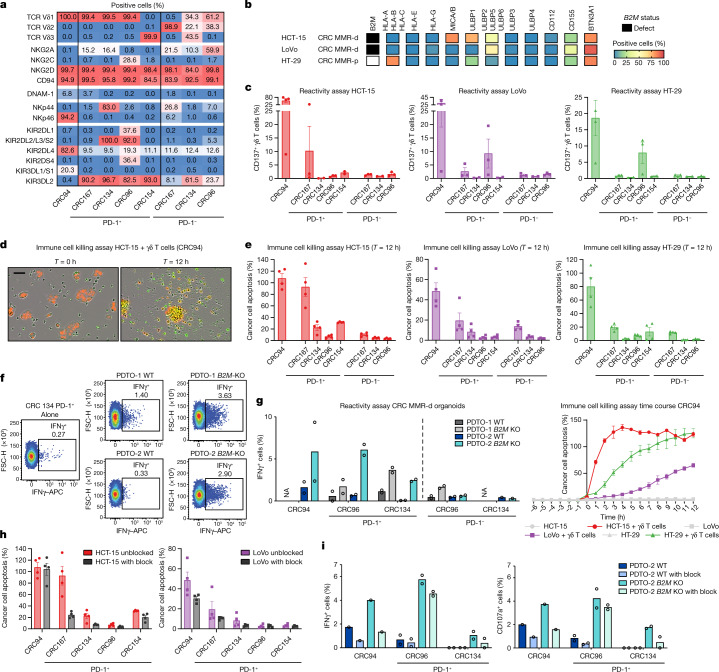
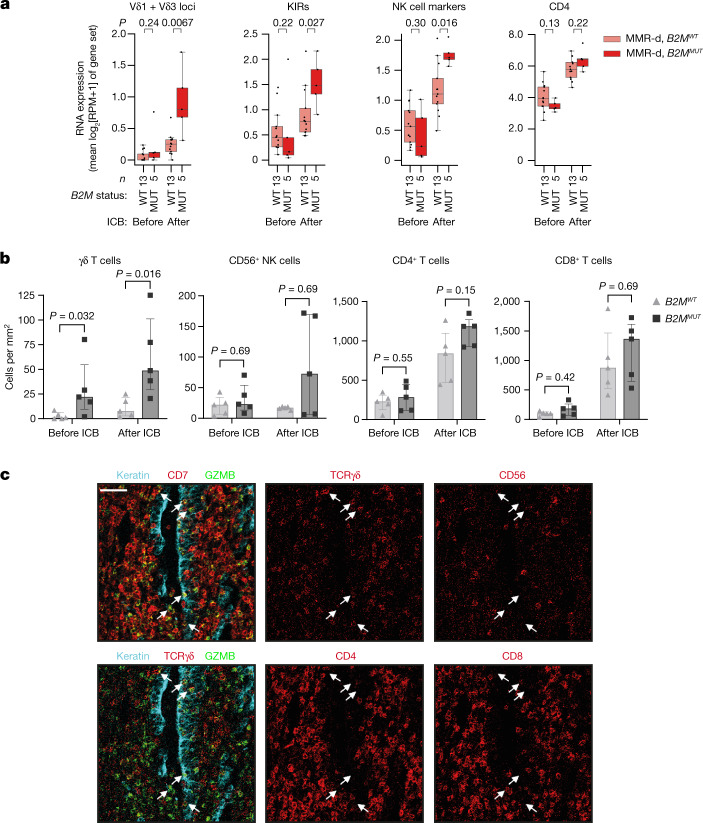
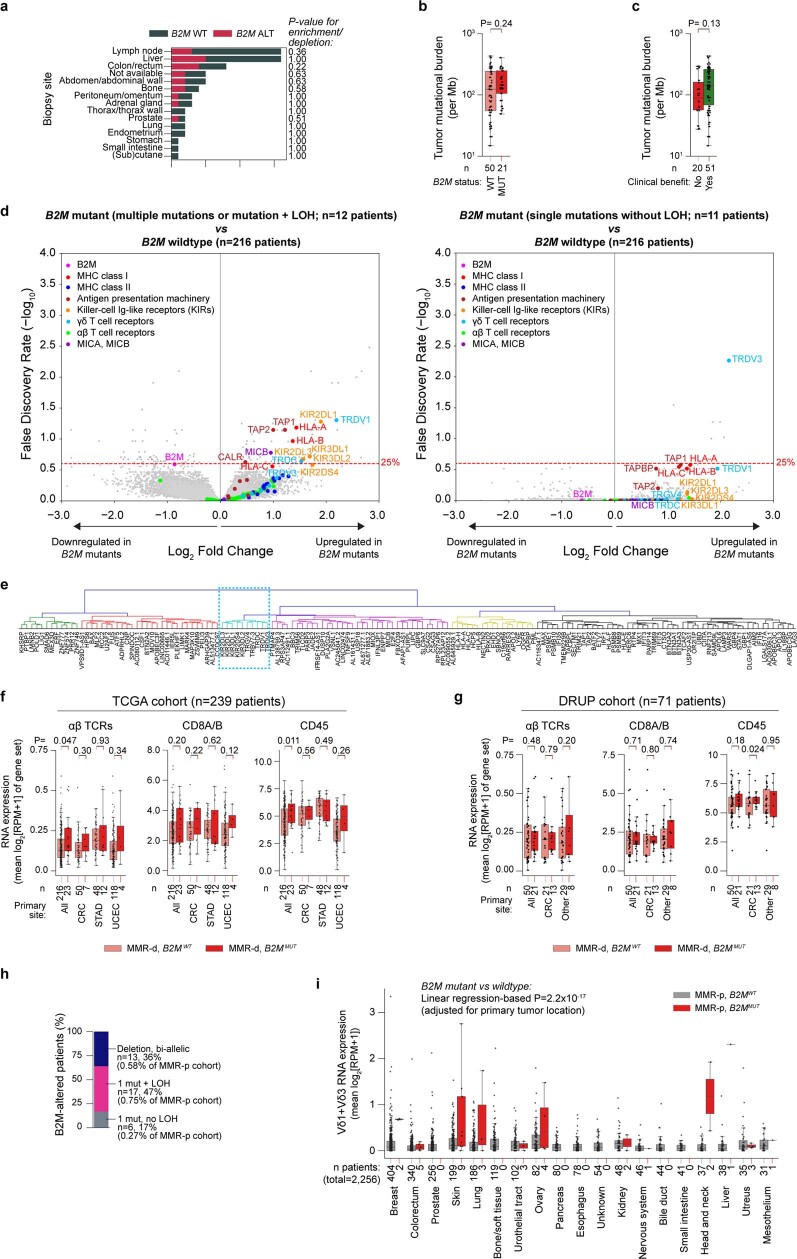
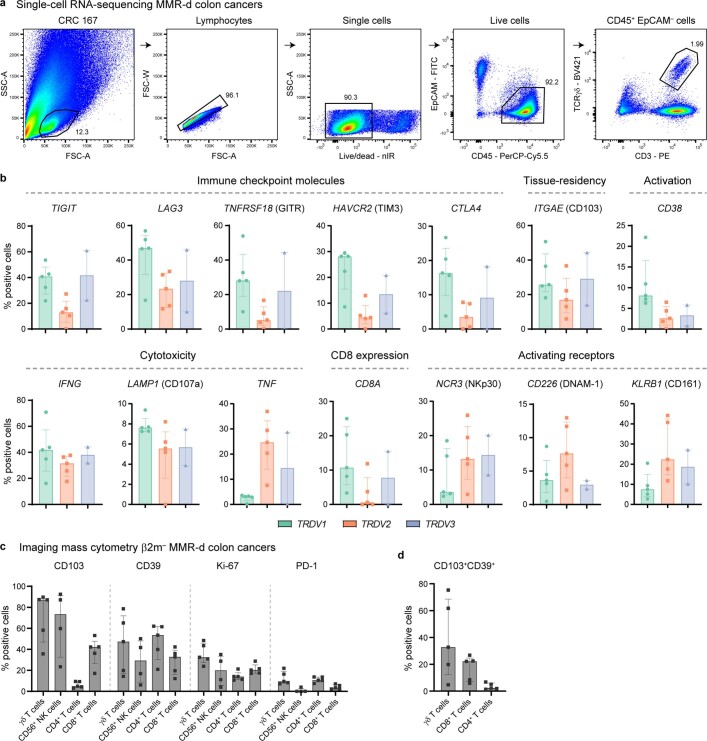
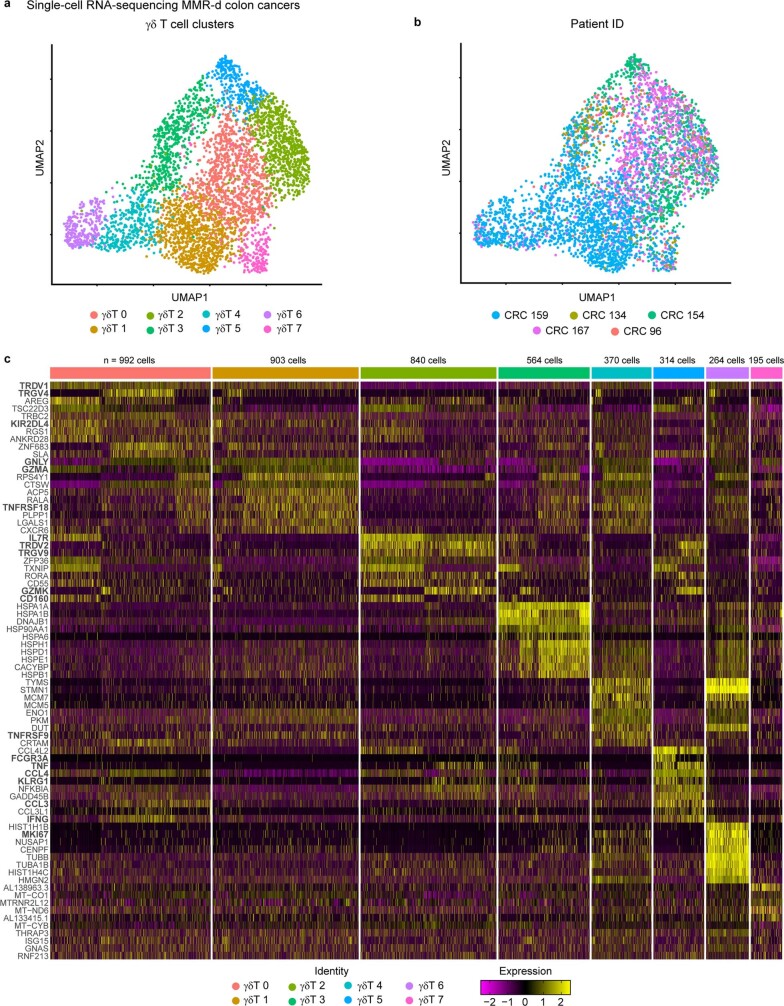
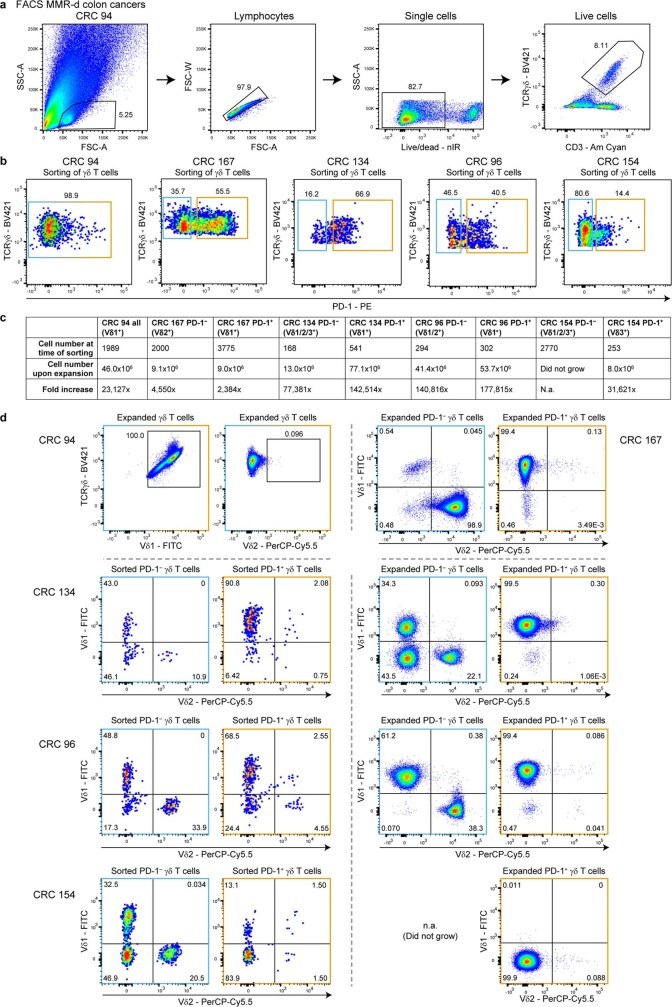
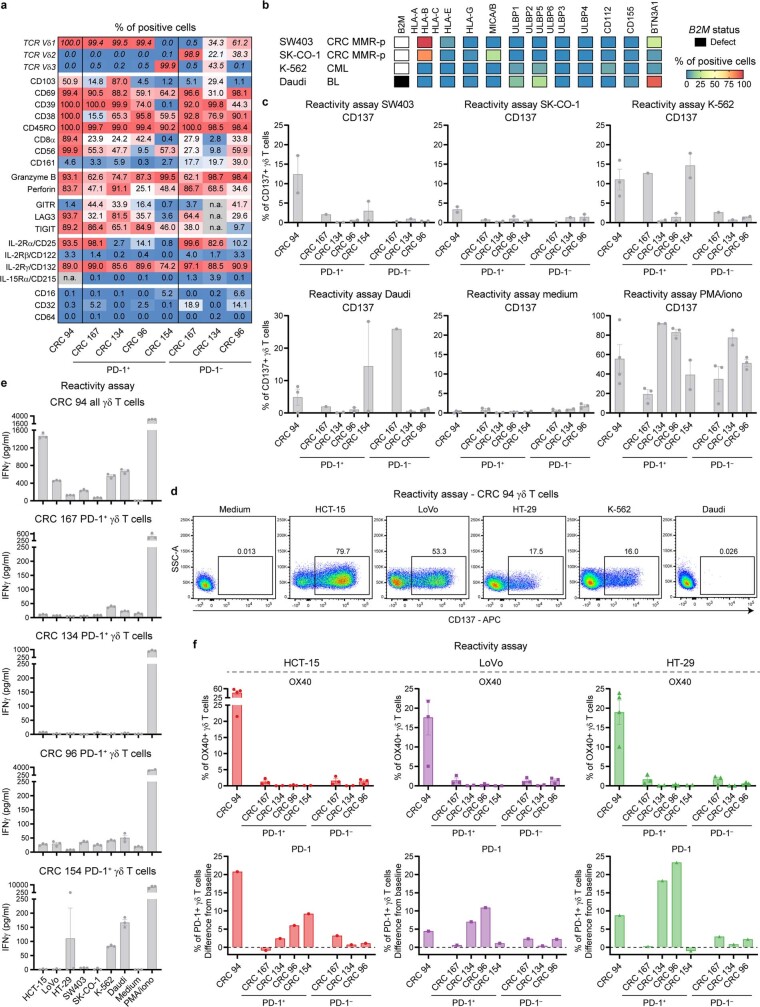
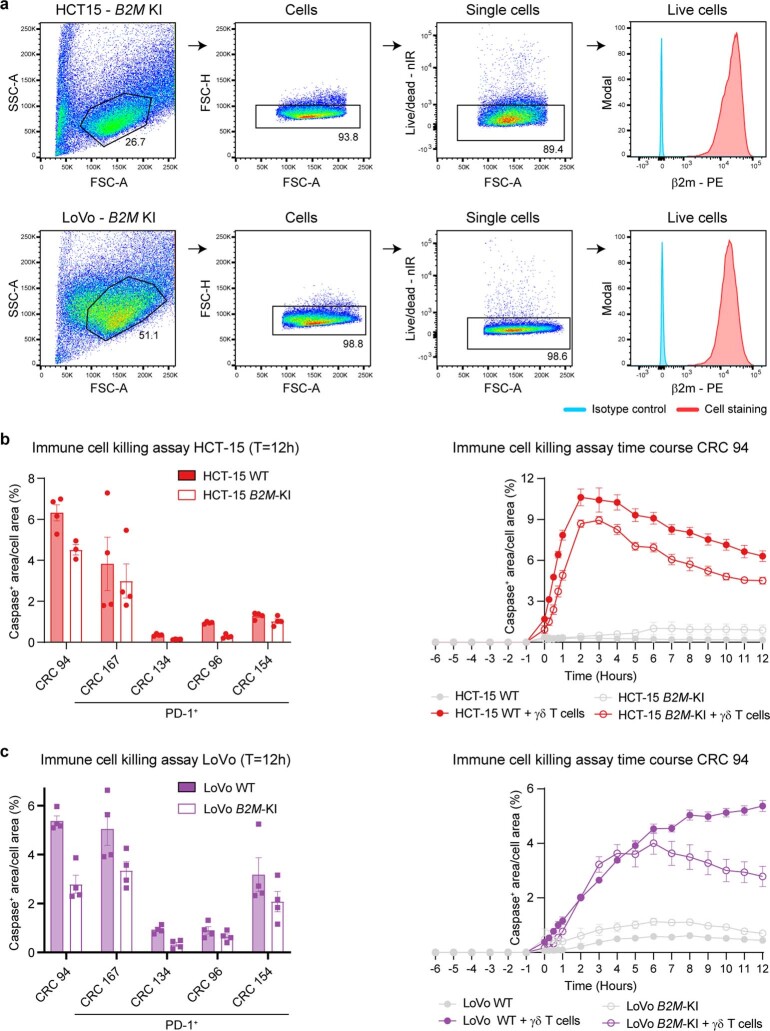
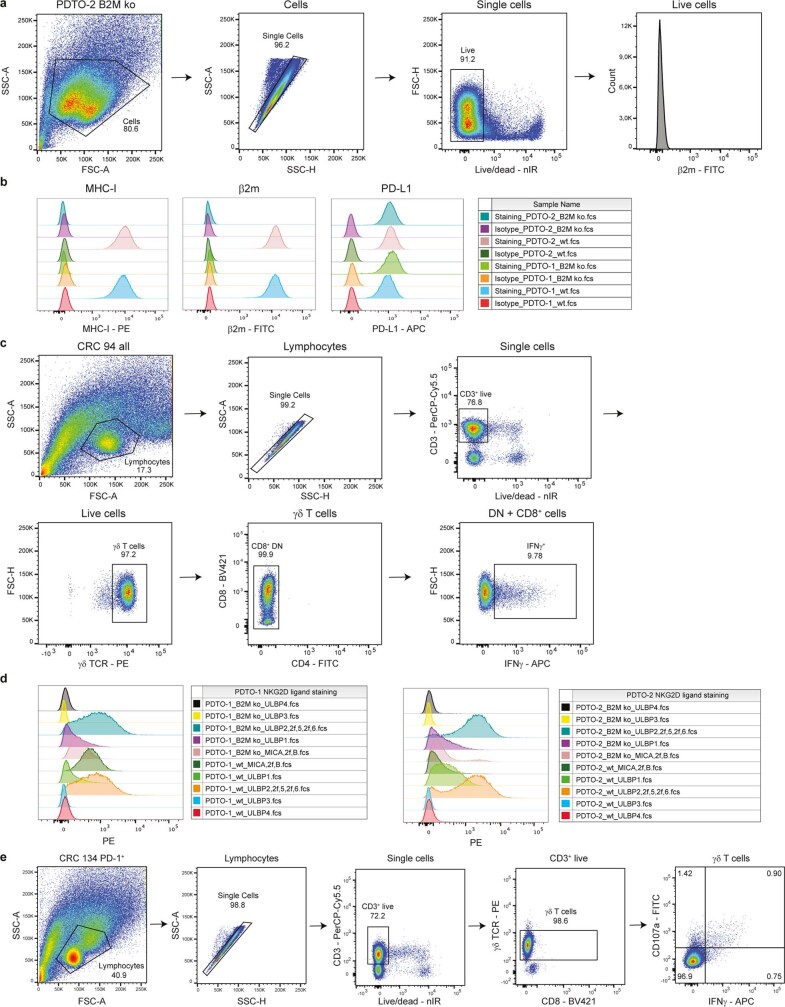
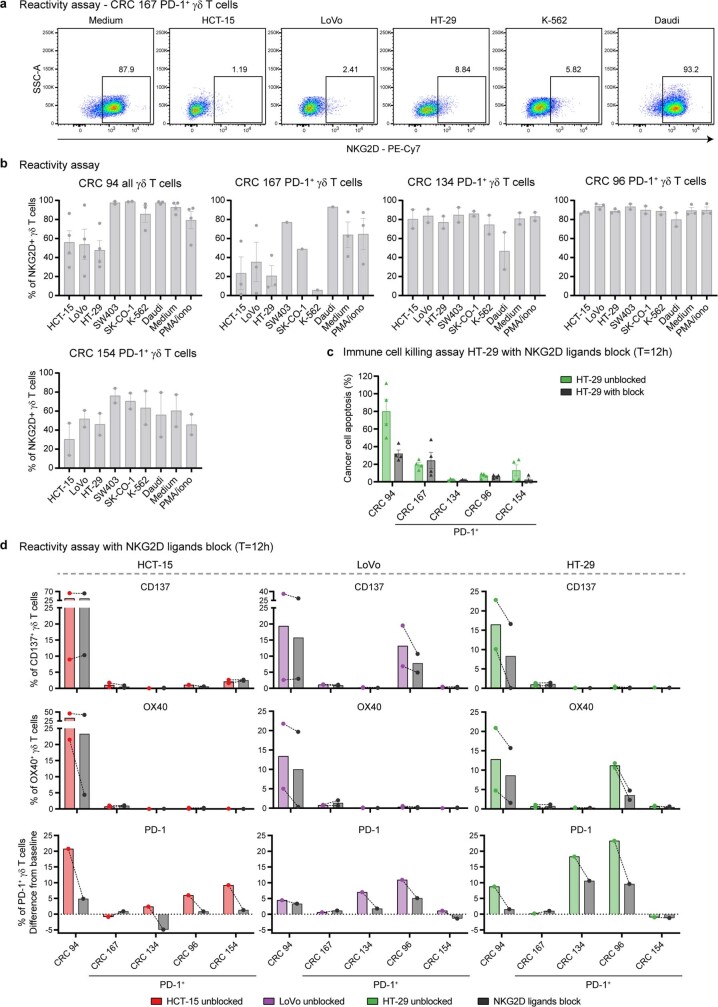
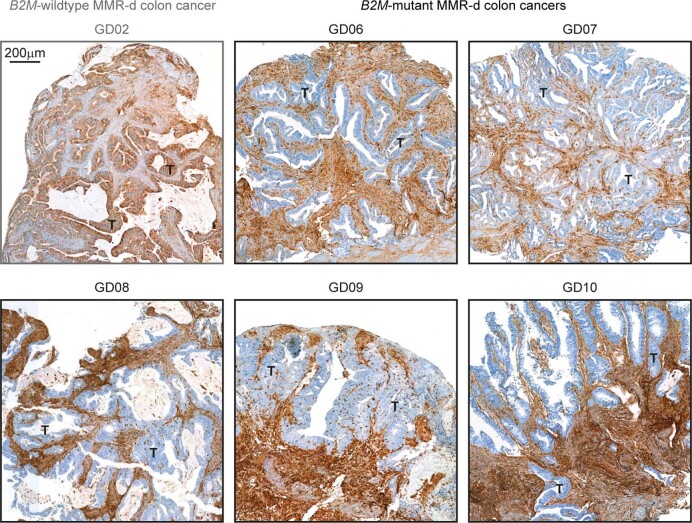
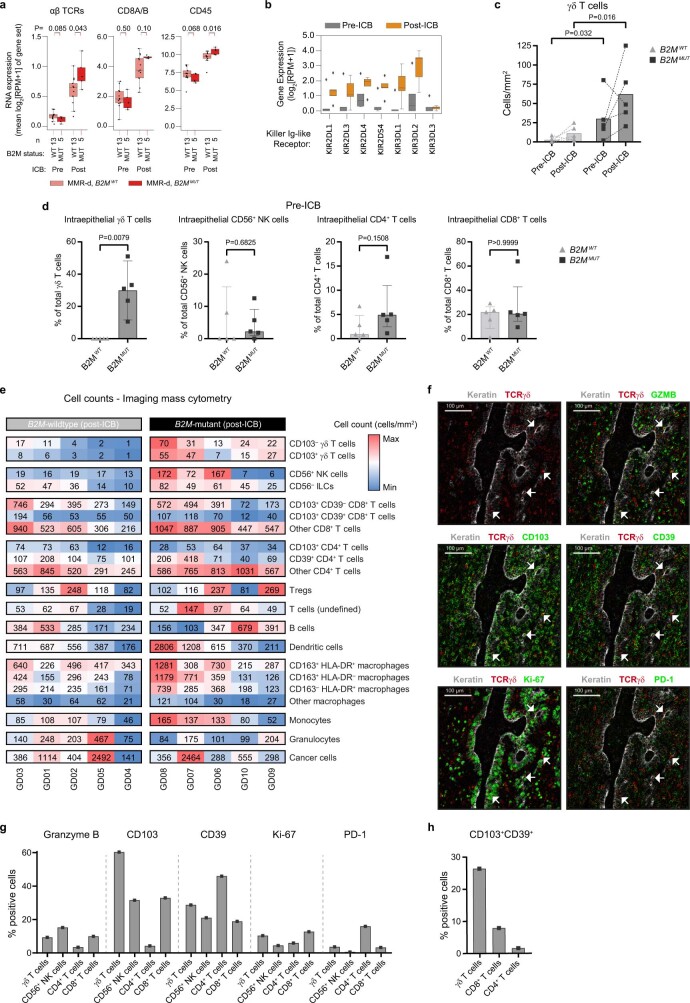
DNA mismatch repair-deficient (MMR-d) cancers present an abundance of neoantigens that is thought to explain their exceptional responsiveness to immune checkpoint blockade (ICB)1,2. Here, in contrast to other cancer types3-5, we observed that 20 out of 21 (95%) MMR-d cancers with genomic inactivation of β2-microglobulin (encoded by B2M) retained responsiveness to ICB, suggesting the involvement of immune effector cells other than CD8+ T cells in this context. We next identified a strong association between B2M inactivation and increased infiltration by γδ T cells in MMR-d cancers. These γδ T cells mainly comprised the Vδ1 and Vδ3 subsets, and expressed high levels of PD-1, other activation markers, including cytotoxic molecules, and a broad repertoire of killer-cell immunoglobulin-like receptors. In vitro, PD-1+ γδ T cells that were isolated from MMR-d colon cancers exhibited enhanced reactivity to human leukocyte antigen (HLA)-class-I-negative MMR-d colon cancer cell lines and B2M-knockout patient-derived tumour organoids compared with antigen-presentation-proficient cells. By comparing paired tumour samples from patients with MMR-d colon cancer that were obtained before and after dual PD-1 and CTLA-4 blockade, we found that immune checkpoint blockade substantially increased the frequency of γδ T cells in B2M-deficient cancers. Taken together, these data indicate that γδ T cells contribute to the response to immune checkpoint blockade in patients with HLA-class-I-negative MMR-d colon cancers, and underline the potential of γδ T cells in cancer immunotherapy.


Conflict of interest statement

M.C. has performed an advisory role or offered expert testimony for BMS, MSD and NUMAB; has received honoraria from BMS and Roche; and has received financing of scientific research from Roche, BMS and MSD. J.B.H. has received research funding from BMS; and has performed an advisory role for BMS.

Figures

Fig. 1
Fig. 1. In MMR-d cancers, B2M defects are positively associated with ICB responsiveness and infiltration by Vδ1 and Vδ3 T cells and KIR-expressing cells.
a, Tumour type distribution in the DRUP cohort (n = 71 patients). The colours denote patients’ B2M status; grey, WT; red, altered (ALT). P values for the enrichment/depletion of B2M-altered tumours per primary site were calculated using two-sided Fisher’s exact tests. The inset denotes the ICB treatment; dark blue, nivolumab (Nivo); light blue, durvalumab (Durva). b, B2M status (x axis) versus clinical benefit (green, CB; red, no clinical benefit (NCB)) of ICB treatment in the DRUP cohort. The P value was calculated using a two-sided Fisher’s exact test. c, The allelic status of B2M alterations in the DRUP cohort. Mut, mutation. d, Differential gene expression between B2MMUT and B2MWT MMR-d cancers in the TCGA COAD (colon adenocarcinoma; n = 57 patients), STAD (stomach adenocarcinoma; n = 60 patients) and UCEC (uterus corpus endometrial carcinoma; n = 122 patients) cohorts. The results were adjusted (adj.) for tumour type and multiple-hypothesis testing (Methods). e, Immune marker gene set expression in MMR-d cancers of the COAD, STAD and UCEC cohorts of the TCGA. The bottom two bars indicate B2M status and cancer type. The association (assoc.) between gene set expression and B2M status was tested using ordinary least squares linear regression (adjusted for tumour type; Methods), of which two-sided P values and the association sign are shown on the right. Cancers were ranked on the basis of hierarchical clustering (top dendrograms). P values less than 0.05 are in bold. f, Immune marker gene set expression in B2MWT (pink) and B2MMUT (red) MMR-d cancers in the TCGA COAD, STAD and UCEC cohorts separately or combined (all). Boxes, whiskers and dots indicate the quartiles, 1.5× the interquartile range (IQR) and individual data points, respectively. P values were calculated using two-sided Wilcoxon rank-sum tests. g, Immune marker gene set expression in B2MWT (pink) and B2MMUT (red) as described in f, but for MMR-d cancers in the DRUP cohort. Results are shown for all cancers combined, only CRC or all non-CRC cancers (other). Two-sided P values were calculated using linear regression, adjusting for biopsy site and tumour type (Methods).
Fig. 2
Fig. 2. Tumour-infiltrating Vδ1 and Vδ3 T cell subsets display hallmarks of cytotoxic activity in MMR-d colon cancers.
a, UMAP embedding showing the clustering of γδ T cells (n = 4,442) isolated from MMR-d colon cancers (n = 5) analysed using scRNA-seq. The colours represent the TCR Vδ chain usage. The functionally distinct γδ T cell clusters are shown in Extended Data Fig. 3. Dots represent single cells. b, The frequencies of TCR Vδ chain use of the γδ T cells (n = 4,442) analysed using scRNA-seq as a percentage of total γδ T cells. c, The frequencies of positive cells for selected genes across Vδ1 (n = 1,927), Vδ2 (n = 860) and Vδ3 (n = 506) cells as the percentage of total γδ T cells from each MMR-d colon tumour (n = 5) analysed using scRNA-seq. Vδ3 cells were present in two out of five colon cancers. Data are median ± IQR, with individual samples (dots). d, The frequencies of γδ T cells, CD56+ NK cells, CD4+ T cells and CD8+ T cells in treatment-naive B2M+ (n = 12) and B2M (n = 5) MMR-d colon cancers. Data are median ± IQR, with individual samples (dots). P values were calculated using two-sided Wilcoxon rank-sum tests. e, The frequencies of granzyme-B-positive γδ T cells, CD56+ NK cells, CD4+ T cells and CD8+ T cells in treatment-naive B2M (n = 5) MMR-d colon cancers. CD56+ NK cells were present in four out of five B2M cancer samples. Data are median ± IQR, with individual samples (dots). f, Representative images of the detection of tissue-resident (CD103+), activated (CD39+), cytotoxic (granzyme B+), proliferating (Ki-67+) and PD-1+ γδ T cells (white arrows) by IMC analysis of a treatment-naive MMR-d colon cancer with B2M defects. Scale bar, 20 μm.
Fig. 3
Fig. 3. γδ T cells from MMR-d colon cancers show preferential reactivity to HLA-class-I-negative cancer cell lines and organoids.
a, The percentage of positive cells for the indicated markers on expanded γδ T cells from MMR-d colon cancers (n = 5). b, Diagram showing the B2M status and surface expression of HLA class I, NKG2D ligands, DNAM-1 ligands and butyrophilin on CRC cell lines. MMR-p, MMR proficient. c, CD137 expression on γδ T cells after co-culture with CRC cell lines. Data are mean ± s.e.m. from at least two independent experiments. d, Representative images showing the killing of NucLightRed-transduced HCT-15 cells by γδ T cells in the presence of a green fluorescent caspase-3/7 reagent. Cancer cell apoptosis is visualized in yellow. Scale bar, 50 μm. e, Quantification of the killing of CRC cell lines after co-culture with γδ T cells as described in d. Data are mean ± s.e.m. of two wells with two images per well. A representative time course of cancer cell apoptosis is shown at the bottom right. f, Representative flow cytometry plots showing IFNγ expression in γδ T cells unstimulated (alone) and after stimulation with two B2MWT and B2MKO CRC MMR-d organoids. g, IFNγ expression in γδ T cells after stimulation with two B2MWT and B2MKO CRC MMR-d organoids, shown as the difference compared with the unstimulated γδ T cell sample. Data are from two biological replicates, except for a single biological replicate of CRC134 PD-1. NA, not available. h, The killing of CRC cell lines after 12 h co-culture with γδ T cells with or without NKG2D ligand blocking. Data are mean ± s.e.m. of two wells with two images per well. i, IFNγ (left) and CD107a (right) expression in γδ T cells after stimulation with B2MWT PDTO-2 or B2MKO PDTO-2, with or without NKG2D ligand blocking and subtracted background signal. Data are from two biological replicates, except for a single biological replicate of CRC94.
Fig. 4
Fig. 4. ICB induces substantial infiltration of γδ T cells into MMR-d colon cancers with defects in antigen presentation.
a, The RNA expression of different immune marker gene sets in MMR-d B2MWT (pink) and MMR-d B2MMUT (red) cancers before (left) and after (right) neoadjuvant ICB in the NICHE study. The boxes, whiskers and dots indicate quartiles, 1.5 × IQR and individual data points, respectively. P values were calculated using two-sided Wilcoxon rank-sum tests comparing MMR-d B2MWT versus MMR-d B2MMUT cancers. b, The frequencies of γδ T cells, CD56+ NK cells, CD4+ T cells and CD8+ T cells in B2MWT (n = 5) and B2MMUT (n = 5) MMR-d colon cancers before and after ICB treatment. Data are median ± IQR, with individual samples (dots). P values were calculated using two-sided Wilcoxon rank-sum tests. c, Representative images of granzyme-B-positive γδ T cells infiltrating the tumour epithelium (white arrows) by IMC analysis of a B2MMUT MMR-d colon cancer after ICB treatment. Scale bar, 50 μm.
Extended Data Fig. 1
Extended Data Fig. 1. Association of B2M status to clinical, genomic, and transcriptomic characteristics of MMR-d and MMR-p tumours.
a. Biopsy site distribution in the DRUP cohort (n = 71 patients). Colours denote patients’ B2M status (WT: wildtype,; ALT: altered). Fisher’s exact test-based two-sided P-values for enrichment/depletion of B2M altered tumours per biopsy site are shown. b. Tumour mutational burden vs B2M status. Wilcoxon rank sum test-based two-sided P-value is shown. Boxes, whiskers, and dots indicate quartiles, 1.5 interquartile ranges, and individual data points, respectively. c. As b, but for clinical benefit to ICB (x-axis). d. Volcano plots indicating differential gene expression between B2M-based subgroups (see title) of MMR-d cancers in TCGA COAD (colon adenocarcinoma; n = 57 patients), STAD (stomach adenocarcinoma; n = 60 patients) and UCEC (uterus corpus endometrial carcinoma; n = 122 patients) cohorts. Results were adjusted for tumour type and multiple hypothesis testing (Methods). e. Hierarchical clusters of expression of genes significantly (FDR <25%; see Fig. 1D) upregulated in MMR-d B2MMUT vs MMR-d B2MWT cancers in the TCGA COAD/STAD/UCEC cohorts. The blue dashed rectangle denotes the Vδ1/3 T cell cluster. f. Immune marker gene set expression in B2MWT (pink), and B2MMUT (red) MMR-d cancers in the TCGA COAD/STAD/UCEC cohorts separately or combined (All). Boxes, whiskers, and dots indicate quartiles, 1.5 interquartile ranges, and individual data points, respectively. Wilcoxon rank sum test-based two-sided P-values are shown. g. As f, but for MMR-d cancers in the DRUP cohort, for all cancers combined (All), only colorectal cancer (CRC), or all non-CRC cancers (Other). Two-sided P-values were calculated with linear regression adjusting for biopsy site and tumour type (Methods). h. Allelic alteration status of B2M in the Hartwig cohort of MMR-p cancers. i. RNA expression of Vδ1+Vδ3 loci in MMR-p B2MWT (grey), and MMR-p B2MMUT (red) cancers in the Hartwig cohort, stratified per primary tumour location. Boxes, whiskers, and dots indicate quartiles, 1.5 interquartile ranges, and individual data points, respectively. The linear regression-based, two-sided, primary tumour location-adjusted P-value for association of B2M status with Vδ1+Vδ3 loci expression is shown.
Extended Data Fig. 2
Extended Data Fig. 2. Characterization of γδ T cells and other immune cell populations infiltrating MMR-d colon cancers.
a. FACS gating strategy for single, live CD45+ EpCAM CD3+ TCRγδ+ cells from a representative MMR-d colon cancer sample showing sequential gates with percentages. b. Frequencies of positive cells for selected genes across Vδ1 (n = 1927), Vδ2 (n = 860), and Vδ3 (n = 506) cells as percentage of total γδ T cells from each MMR-d colon tumour (n = 5) analysed by single-cell RNA-sequencing. Vδ3 cells were present in two out of five colon cancers. Bars and dots indicate median ± IQR and individual samples, respectively. c. Frequencies of marker-positive γδ T cells, CD56+ NK cells, CD4+ T cells, and CD8+ T cells in treatment-naive β2m (n = 5) MMR-d colon cancers. CD56+ NK cells were present in four out of five β2m cancer samples. Bars and dots indicate median ± IQR and individual samples, respectively. d. Frequencies of CD103+CD39+ γδ T cells, CD8+ T cells, and CD4+ T cells in treatment-naive β2m (n = 5) MMR-d colon cancers. Bars indicate median ± IQR and individual samples, respectively.
Extended Data Fig. 3
Extended Data Fig. 3. Distinct clusters of γδ T cells in MMR-d colon cancers by single-cell RNA-sequencing.
a. UMAP embedding showing γδ T cells (n = 4442) isolated from MMR-d colon cancers (n = 5) analysed by single-cell RNA-sequencing. Colours represent the functionally different γδ T cell clusters identified by graph-based clustering and non-linear dimensional reduction. Dots represent single cells. b. UMAP embedding of (a) coloured by patient ID. Dots represent single cells. c. Heatmap showing the normalized single-cell gene expression value (z-score, purple-to-yellow scale) for the top 10 differentially expressed genes in each identified γδ T cell cluster.
Extended Data Fig. 4
Extended Data Fig. 4. Sorting and expansion of γδ T cells from MMR-d colon cancers.
a. FACS gating strategy for single, live CD3+ TCRγδ+ cells from a representative MMR-d colon cancer sample showing sequential gates with percentages. b. Sorting of all γδ T cells from CRC94 (due to the low number of PD-1+ cells), and of PD-1 (blue squares) and PD-1+ (orange squares) γδ T cells from CRC167, CRC134, CRC96, and CRC154. Dots represent single cells. c. Table showing the number of γδ T cells isolated from MMR-d colon cancers (n = 5) at the time of sorting vs 3-4 weeks after expansion, and the fold increase thereof. d. TCR Vδ chain usage after expansion of γδ T cells from CRC94 and CRC167 (first row), and at the time of sorting (left panel) as well as after expansion (right panel) of γδ T cells from CRC134, CRC96, and CRC154. PD-1 γδ T cells from CRC154 did not expand in culture. Dots represent single cells.
Extended Data Fig. 5
Extended Data Fig. 5. Phenotype and reactivity of γδ T cells towards cancer cell lines.
a. The percentage of positive cells for the indicated markers on expanded γδ T cells from MMR-d colon cancers (n = 5). b. Diagram showing the B2M status and surface expression of HLA class I, NKG2D ligands, DNAM-1 ligands, and butyrophilin on cancer cell lines. c. Bar plots showing CD137 expression on γδ T cells upon co-culture with cancer cell lines. Medium was used as negative control and PMA/ionomycin as positive control. Bars indicate mean ± SEM. Data from at least two independent experiments except for CRC167, depending on availability of γδ T cells. d. Representative flow cytometry plots showing CD137 expression on γδ T cells from a MMR-d colon cancer upon co-culture with cancer cell lines as compared to medium only. Gates indicate percentage of positive γδ T cells. e. Bar plots showing the presence of IFNγ in the supernatant upon co-culture of γδ T cells from MMR-d colon cancers (n = 5) with cancer cell lines. Medium as negative control and PMA/ionomycin as positive control are included. Bars indicate mean ± SEM of triplicates. f. Bar plots showing the expression of OX40 (first row) and PD-1 (second row) on γδ T cells upon co-culture of γδ T cells with CRC cell lines. PD-1 expression is shown as difference from baseline (medium) condition. Bars indicate mean ± SEM. Data from at least two independent experiments.
Extended Data Fig. 6
Extended Data Fig. 6. Reactivity of γδ T cells towards B2M-knockin vs -wildtype cancer cell lines.
a. Flow cytometry gating strategy to validate β2m expression on HCT-15 and LoVo B2M-knockin (B2M-KI) cell lines. Isotype controls were included as negative control. b. Bar plots showing the quantification of killing of HCT-15 B2M-KI vs wildtype (WT) cells upon co-culture with γδ T cells from MMR-d colon cancers (n = 5) in the presence of a red fluorescent caspase-3/7 reagent. Bars indicate mean ± SEM of two wells with two images/well. Right panel shows representative time course of apoptosis. c. As b, but for LoVo B2M-KI vs WT cells.
Extended Data Fig. 7
Extended Data Fig. 7. Tumour organoid characterization and reactivity assay readout.
a. Flow cytometry gating strategy on PDTO cells for analysis of surface staining. Selected cells were gated on single, live cells before quantification of staining signal. b. Histogram representation and count for surface staining of MHC-I, PD-L1, and β2m expression on two PDTO lines B2MWT and B2MKO after IFNγ pre-stimulation. Staining with isotype antibodies for each fluorochrome (PE, APC and FITC) were included as negative control. c. Flow cytometry gating strategy on γδ T cell samples for analysis of intracellular staining to test antitumour reactivity upon PDTO stimulation. Lymphocyte population was further gated on single cells, live and CD3+ cells, γδTCR+ cells and CD8+ as well as CD8CD4 cells. Reactivity of the sample was based on IFNγ+ cells of the selected population. d. Histogram representation and count for surface staining of NKG2D ligands MICA/B, ULBP1, ULBP2/5/6, ULBP3, and ULBP4 on two PDTO lines B2MWT and B2MKO after IFNγ pre-stimulation. e. Flow cytometry gating strategy on γδ T cell samples for analysis of intracellular staining after stimulation with PDTOs in the presence of NKG2D ligand blocking. Lymphocyte population was further gated on single cells, live and CD3+ cells, followed by γδTCR+ and CD8+ as well as CD8 cells. Reactivity of final population was based on IFNγ+ or CD107a+ cells.
Extended Data Fig. 8
Extended Data Fig. 8. Reactivity of γδ T cells towards cancer cell lines in the presence of NKG2D ligand blocking.
a. Representative flow cytometry plots showing NKG2D expression on γδ T cells from a MMR-d colon cancer upon co-culture with cancer cell lines as compared to medium only. Gates indicate percentage of positive γδ T cells. b. Bar plots showing NKG2D expression on γδ T cells from MMR-d colon cancers (n = 5) upon co-culture with cancer cell lines. Medium as negative control and PMA/ionomycin as positive control are included. Bars indicate mean ± SEM. Data from at least two independent experiments except for CRC167 (SW403, SK-CO-1, K-562), depending on availability of γδ T cells. c. Bar plots showing the killing of HT-29 cells upon co-culture with γδ T cells with or without NKG2D ligand blocking. Bars indicate mean ± SEM of two wells with two images/well. d. Bar plots showing the expression of CD137 (first row), OX40 (second row), and PD-1 (third row) on γδ T cells upon co-culture of γδ T cells with CRC cell lines with or without NKG2D ligand blocking. PD-1 expression is shown as difference from baseline (medium) condition. Bars and lines indicate mean and similar experiments, respectively. Data from two independent experiments for CD137 and OX40.
Extended Data Fig. 9
Extended Data Fig. 9. Loss of β2m protein expression on tumour cells in B2M-mutant MMR-d colon cancers.
Immunohistochemical analysis of β2m protein expression in FFPE tissue from all five B2MMUT MMR-d colon cancers of the NICHE cohort. A B2MWT case (GD02) staining positive for β2m is included as control. Details on the staining procedure can be found in Methods.
Extended Data Fig. 10
Extended Data Fig. 10. Distribution of immune cell populations in B2M-mutant and B2M-wildtype MMR-d colon cancers pre- and post-ICB treatment in the NICHE trial.
a. Immune marker gene set RNA expression in MMR-d B2MWT (pink), and MMR-d B2MMUT (red) cancers, before (left) and after (right) neoadjuvant ICB. Boxes, whiskers, and dots indicate quartiles, 1.5 interquartile ranges, and individual data points, respectively. Wilcoxon rank sum test-based two-sided P-values are shown. b. Pre- (grey) and post-ICB (orange) RNA expression of KIRs in B2MMUT MMR-d cancers in the NICHE study (n = 5). Boxes, whiskers, and dots indicate quartiles, 1.5 interquartile ranges, and outliers, respectively. Two-sided P-values were calculated by Wilcoxon rank sum test. c. Pre- and post-ICB frequencies of γδ T cells by imaging mass cytometry in B2MWT (n = 5) and B2MMUT (n = 5) MMR-d colon cancers (corresponding to Fig. 4b). Lines indicate paired samples, dots represent individual samples. Wilcoxon rank sum test-based two-sided P-values are shown. d. Imaging mass cytometry-based frequencies of intraepithelial γδ T cells, CD56+ NK cells, CD4+ T cells, and CD8+ T cells in ICB-naive B2MWT (n = 5) and B2MMUT (n = 5) MMR-d colon cancers. Bars and dots indicate median ± IQR and individual samples, respectively. Wilcoxon rank sum test-based two-sided P-values are shown. e. Cell counts (cells/mm2) of immune populations from the imaging mass cytometry of B2MWT (n = 5) and B2MMUT (n = 5) MMR-d colon cancers upon ICB treatment. Colour bar is scaled per immune population. f. Representative images of the detection of cytotoxic (granzyme B+), tissue-resident (CD103+), activated (CD39+), proliferating (Ki-67+), and PD-1+ γδ T cells by imaging mass cytometry in a B2MMUT MMR-d colon cancer upon ICB treatment. g. Frequencies of marker-positive γδ T cells, CD56+ NK cells, CD4+ T cells, and CD8+ T cells in the sole B2MMUT MMR-d colon cancer that contained cancer cells upon ICB treatment. h. Frequencies of CD103+CD39+ γδ T cells, CD8+ T cells, and CD4+ T cells in the sole B2MMUT MMR-d colon cancer that contained cancer cells upon ICB treatment.

Comment in

Similar articles

Cited by

References

    1. Ionov Y, Peinado MA, Malkhosyan S, Shibata D, Perucho M. Ubiquitous somatic mutations in simple repeated sequences reveal a new mechanism for colonic carcinogenesis. Nature. 1993;363:558–561. - PubMed
    1. Germano G, et al. Inactivation of DNA repair triggers neoantigen generation and impairs tumour growth. Nature. 2017;552:116–120. - PubMed
    1. Zaretsky JM, et al. Mutations associated with acquired resistance to PD-1 blockade in melanoma. N. Engl. J. Med. 2016;375:819–829. - PMC - PubMed
    1. Gettinger S, et al. Impaired HLA class i antigen processing and presentation as a mechanism of acquired resistance to immune checkpoint inhibitors in lung cancer. Cancer Discov. 2017;7:1420–1435. - PMC - PubMed
    1. Sade-Feldman M, et al. Resistance to checkpoint blockade therapy through inactivation of antigen presentation. Nat. Commun. 2017;8:1136. - PMC - PubMed

Publication types

MeSH terms

Substances

Supplementary concepts