. 2023 Jan;613(7945):759-766.
doi: 10.1038/s41586-022-05575-3. Epub 2023 Jan 11.

An atlas of substrate specificities for the human serine/threonine kinome

Affiliations

An atlas of substrate specificities for the human serine/threonine kinome

Jared L Johnson et al. Nature. 2023 Jan.

Abstract

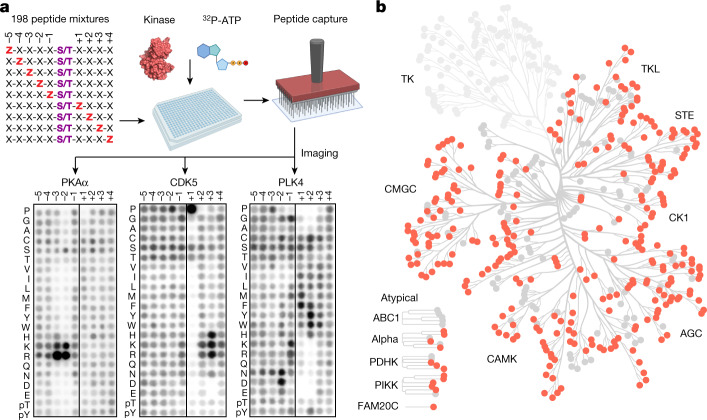
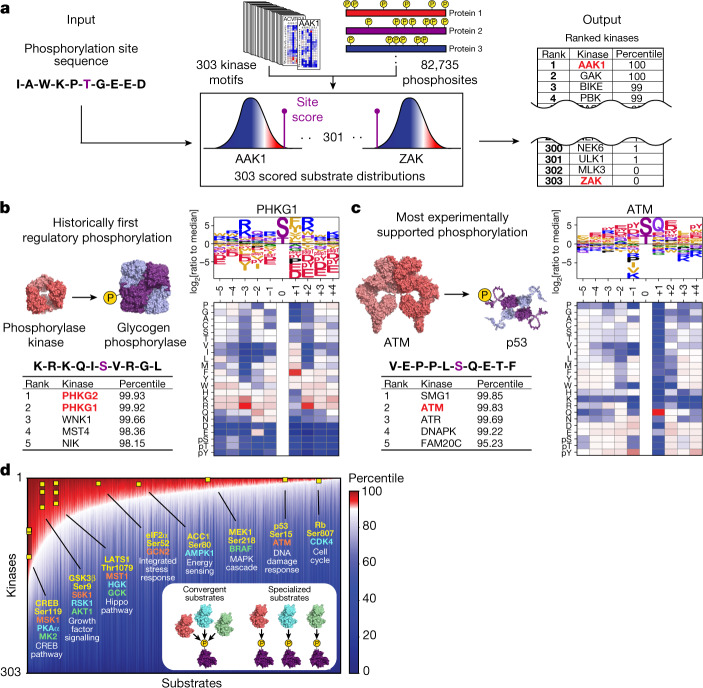
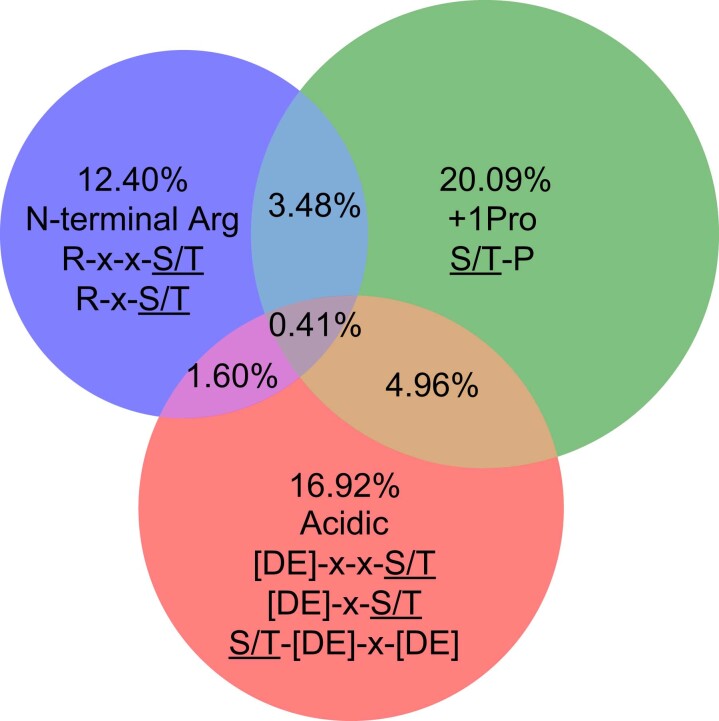
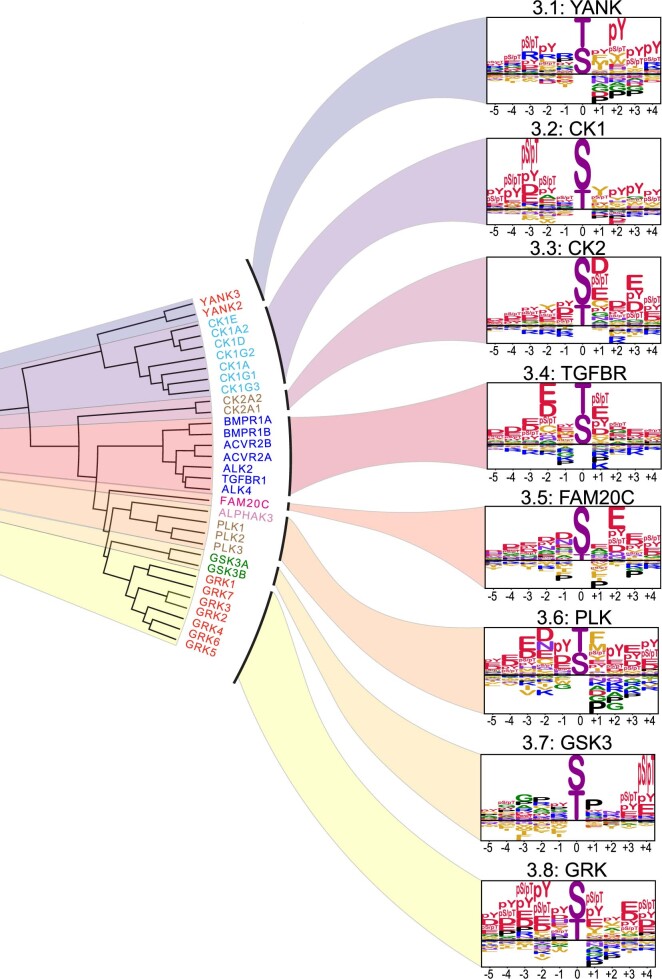
Protein phosphorylation is one of the most widespread post-translational modifications in biology1,2. With advances in mass-spectrometry-based phosphoproteomics, 90,000 sites of serine and threonine phosphorylation have so far been identified, and several thousand have been associated with human diseases and biological processes3,4. For the vast majority of phosphorylation events, it is not yet known which of the more than 300 protein serine/threonine (Ser/Thr) kinases encoded in the human genome are responsible3. Here we used synthetic peptide libraries to profile the substrate sequence specificity of 303 Ser/Thr kinases, comprising more than 84% of those predicted to be active in humans. Viewed in its entirety, the substrate specificity of the kinome was substantially more diverse than expected and was driven extensively by negative selectivity. We used our kinome-wide dataset to computationally annotate and identify the kinases capable of phosphorylating every reported phosphorylation site in the human Ser/Thr phosphoproteome. For the small minority of phosphosites for which the putative protein kinases involved have been previously reported, our predictions were in excellent agreement. When this approach was applied to examine the signalling response of tissues and cell lines to hormones, growth factors, targeted inhibitors and environmental or genetic perturbations, it revealed unexpected insights into pathway complexity and compensation. Overall, these studies reveal the intrinsic substrate specificity of the human Ser/Thr kinome, illuminate cellular signalling responses and provide a resource to link phosphorylation events to biological pathways.


Conflict of interest statement

L.C.C. is a founder and member of the board of directors of Agios Pharmaceuticals and is a founder and receives research support from Petra Pharmaceuticals; is listed as an inventor on a patent (WO2019232403A1, Weill Cornell Medicine) for combination therapy for PI3K-associated disease or disorder, and the identification of therapeutic interventions to improve response to PI3K inhibitors for cancer treatment; is a co-founder and shareholder in Faeth Therapeutics; has equity in and consults for Cell Signaling Technologies, Volastra, Larkspur and 1 Base Pharmaceuticals; and consults for Loxo-Lilly. M.B.Y receives research support from Cardiff Oncology. T.M.Y. is a co-founder and stockholder and is on the board of directors of DESTROKE, an early-stage start-up developing mobile technology for automated clinical stroke detection. J.L.J has received consulting fees from Scorpion Therapeutics and Volastra Therapeutics. O.E. is a founder and equity holder of Volastra Therapeutics and OneThree Biotech; is a member of the scientific advisory board of Owkin, Freenome, Genetic Intelligence, Acuamark and Champions Oncology; and receives research support from Eli Lilly, Janssen and Sanofi. D.J.T. is a member of the scientific advisory board at Dewpoint Therapeutics. A.D. is an equity holder of Denali Therapeutics; and receives research support from Interline Therapeutics. N.V. reports consulting activities for Novartis and is on the scientific advisory board of Heligenics. M.D.G. is a co-founder and shareholder of Faeth Therapeutics, which is developing dietary and pharmacological therapies for cancer; and has received speaking and/or consulting fees from Pfizer, Novartis, Scorpion Therapeutics and Faeth Therapeutics.

Figures

Fig. 1
Fig. 1. Profiling the substrate specificity of the human serine/threonine kinome.
a, Experimental workflow for the PSPA analysis and representative results. The schematic was created using BioRender. Z denotes fixed positions containing one of the 20 natural amino acids, or either phosphorylated Thr (pThr) or phosphorylated Tyr (pTyr). X denotes unfixed positions containing randomized mixtures of all natural amino acids except Ser, Thr and Cys. Darker spots indicate preferred residues. b, Dendrogram of the human protein kinome, highlighting the Ser/Thr kinases analysed in this study.
Fig. 2
Fig. 2. Phosphorylation-site motif tree of the human Ser/Thr kinome.
Hierarchical clustering of 303 Ser/Thr kinases on the basis of their amino acid motif selectivity  (PSSMs). Kinase names are colour labelled according to their phylogenetic relationships (top right).
Fig. 3
Fig. 3. Phosphorylation motifs for the human Ser/Thr kinome enable comprehensive scoring and annotation of the human phosphoproteome.
a, Schematic of the substrate-scoring process. b, Results for Ser15 on glycogen phosphorylase alongside PSSM and the substrate motif logo of its established kinase glycogen phosphorylase kinase. c, The results for Ser15 of p53 alongside its established kinase ATM. d, Annotation of the human Ser and Thr phosphoproteome by percentile scores from 303 Ser/Thr kinases performed as shown in a. A total of 89,752 phosphorylation sites that were identified using high-throughput approaches and/or low-throughput approaches were sorted along the x-axis by their numbers of kinases with percentile scores higher than 90. On the y-axis, kinase percentile scores were sorted by rank separately for each site and represented in the heat map. Examples of well-studied kinase–substrate relationships are highlighted (yellow squares). Inset: phosphorylation sites on the left end of the plot scored favourably for many kinases, whereas sites on the right end scored favourably for fewer kinases.
Fig. 4
Fig. 4. Global motif analysis reveals how kinase perturbations and pathway rewiring reshape the phosphoproteome.
a, Workflow of the motif enrichment analysis of phosphoproteomics data. The schematic was created using BioRender. bg, Results from published datasets. b, Conditioned medium of HepG2 cells after genetic deletion of FAM20C. c, Cultured myotubes after 30 min treatment with 2 μM isoproterenol. d, HeLa cells after mitotic arrest by treatment for 45 min with 0.1 μM PLK1 inhibitor BI 2536 (ref. ). e, A549 cells 2 h after exposure to 6 Gy of ionizing radiation. f, 3T3-L1 adipocytes after serum starvation and then 1 min and 60 min treatment with 100 nM insulin. g, C57BL/6J mouse bone-marrow-derived dendritic cells after 30 min and 4 h treatment with 100 ng ml−1 lipopolysaccharide (LPS). The enrichments in bg were determined using one-sided exact Fisher’s tests and corrected for multiple hypotheses using the Benjamini–Hochberg method. Fully annotated versions of these plots are presented in Supplementary Fig. 2.
Extended Data Fig. 1
Extended Data Fig. 1. Representation of phosphorylation site motifs in the human serine and threonine phosphoproteome.
Venn diagram representation of the percentages of three prominent Ser/Thr kinase motif features, pertaining to Clusters 1, 2, and 3 in Fig. 2, across 82,735 human serine and threonine phosphorylation sites confidently identified in mass spectrometry experiments. The phosphorylated residues in the logos are represented as S/T.
Extended Data Fig. 2
Extended Data Fig. 2. Subcategorization of the basophilic kinases of Cluster 1.
Subcategorization of Cluster 1 from Fig. 2 into 11 motif classes.
Extended Data Fig. 3
Extended Data Fig. 3. Subcategorization of the proline-directed kinases of Cluster 2.
Subcategorization of Cluster 2 from Fig. 2 into 5 motif classes.
Extended Data Fig. 4
Extended Data Fig. 4. Subcategorization of the acidophilic kinases of Cluster 3.
Subcategorization of Cluster 3 from Fig. 2 into 8 motif classes.
Extended Data Fig. 5
Extended Data Fig. 5. Structural models of kinase–substrate complexes.
a, Synthetic peptide from its complex with PAK4 (PDB: 2Q0N) modelled onto WNK3 (PDB: 5O26). Dotted circle highlights a shallow hydrophobic pocket accommodating a +3 Phe residue. b, GSK3 peptide from its complex with AKT2 (PDB: 1O6L) modelled onto CAMKK2 (PDB: 2ZV2). Circle indicates a hydrophobic pocket that could accommodate a −2 aliphatic residue. c, Monophosphorylated peptide from p63 bound to CK1δ (PDB: 6RU6) modelled onto GRK2 (PDB: 1YM7). Circle shows positive surface potential in the vicinity of the −2 and −3 pSer residues. d, p63 peptide bound to CK1δ (PDB: 6RU8) was modelled onto YANK1 (PDB: 4FR4) showing potential binding sites for −3 and +2 phosphorylated residues. Surface electrostatics are represented with Coulombic potential values were computed in ChimeraX and represented by scale bars (kcal/mol·e).
Extended Data Fig. 6
Extended Data Fig. 6. Profiling phospho-acceptor specificity.
a, in vitro phosphorylation assays with recombinant kinases and substrate peptides containing either serine or threonine phospho-acceptors. Results shown for 208 recombinant Ser/Thr kinases. b, Correlation plot of the experimental results in (a) with the position sum approach applied in this study to score Ser/Thr phospho-acceptor preference.
Extended Data Fig. 7
Extended Data Fig. 7. Global analysis of the relationship between the DFG+1 amino acid and preference for the serine versus threonine phospho-acceptor.
a, Bottom, relative preferences for Ser or Thr phospho-acceptor residues for each kinase, arranged in order of decreasing Ser/Thr selectivity. Top, frequency of amino acids at the DGF+1 positions of corresponding kinases (bin size: 15 kinases). b, Structural illustration of the proximity between the DFG+1 residue and substrate phospho-acceptor residue, shown with the AKT1 kinase domain bound to substrate (GSK3β) peptide (pdb 1O6K).
Extended Data Fig. 8
Extended Data Fig. 8. Global performance analysis of substrate percentile scores for their literature-annotated kinases.
a, Percentile-score distributions of substrates for their literature-annotated kinases (AUCDF= area under the cumulative distribution function). b, Percentile-score of literature-annotated kinase–substrate pairs as a function of number of reports. Higher number of reports correlates with more favourable percentile-scores between the reported kinase and its substrate. n = 9,073, n = 3,945, n = 544, n = 224, and n = 201 for kinase–substrate relationships with 1, 2, 3, 4, and 5 or more reports, respectively. Statistical analyses were performed using Double-sided Mann-Whitney U-test. Box minima=25th percentile, centre=50th percentile, maxima=75th percentile. Whiskers extend from the box maxima or minima to the largest or smallest value no further than 1.5 x interquartile range. (ns p > 0.05, * p ≤ 0.05, ** p ≤ 10−3, *** p  ≤ 10−4, **** p ≤ 10−5).
Extended Data Fig. 9
Extended Data Fig. 9. Global performance analysis of kinase ranks for their literature-annotated substrates.
a, Rank distributions of kinases for their literature-annotated substrates (AUCDF= area under the cumulative distribution function). b, Rank of the literature-annotated kinase–substrate pairs, as a function of number of reports. Higher number of reports correlates with more favourable ranking of reported kinase for its substrate. n = 9,073, n = 3,945, n = 544, n = 224, and n = 201 for kinase–substrate relationships with 1, 2, 3, 4, and 5 or more reports, respectively. Statistical analyses were performed using Double-sided Mann-Whitney U-test. Box minima=25th percentile, centre=50th percentile, maxima=75th percentile. Whiskers extend from the box maxima or minima to the largest or smallest value no further than 1.5 x interquartile range. (ns p > 0.05, * p ≤ 0.05, ** p ≤ 10−3, *** p ≤ 10−4, **** p ≤ 10−5).
Extended Data Fig. 10
Extended Data Fig. 10. Motif-based scoring results for phosphorylation events facilitated by subcellular localization or docking.
a, Illustration of the mitochondrial-localized regulation of the pyruvate dehydrogenase complex through phosphorylation by the PDHKs. Scoring results for PDHA1 Ser293, highlighting the PDHK family kinases. b, Illustration of docking-driven phosphorylation of ERK1/2 by MEK1/2. Scoring results for ERK1 Thr202 / ERK2 Thr203 (identical sequences), highlighting MEK1 and MEK2.
Extended Data Fig. 11
Extended Data Fig. 11. Scoring comparison of CDK subfamilies.
Illustration of the phosphoregulation of RNA Polymerase II (POLR2A) CTD and Retinoblastoma protein (Rb) by their respective canonical CDKs, the transcriptional CDKs (purple) and the cell cycle progression CDKs (green) (left). Links between kinases and substrates correspond to favourable scores between motifs and phosphorylation sites (right).

Comment in

Similar articles

Cited by

References

    1. Cohen P. The origins of protein phosphorylation. Nat. Cell Biol. 2002;4:E127–E130. - PubMed
    1. Manning G, Whyte DB, Martinez R, Hunter T, Sudarsanam S. The protein kinase complement of the human genome. Science. 2002;298:1912–1934. - PubMed
    1. Hornbeck PV, et al. 15 years of PhosphoSitePlus®: integrating post-translationally modified sites, disease variants and isoforms. Nucleic Acids Res. 2019;47:D433–D441. - PMC - PubMed
    1. Ochoa D, et al. The functional landscape of the human phosphoproteome. Nat. Biotechnol. 2020;38:365–373. - PMC - PubMed
    1. Fuhs SR, Hunter T. pHisphorylation: the emergence of histidine phosphorylation as a reversible regulatory modification. Curr. Opin. Cell Biol. 2017;45:8–16. - PMC - PubMed

Publication types