

Predicting efficacy of drug-carrier nanoparticle designs for cancer treatment: a machine learning-based solution
- PMID: 36631637
- PMCID: PMC9834306
- DOI: 10.1038/s41598-023-27729-7
Predicting efficacy of drug-carrier nanoparticle designs for cancer treatment: a machine learning-based solution
Abstract
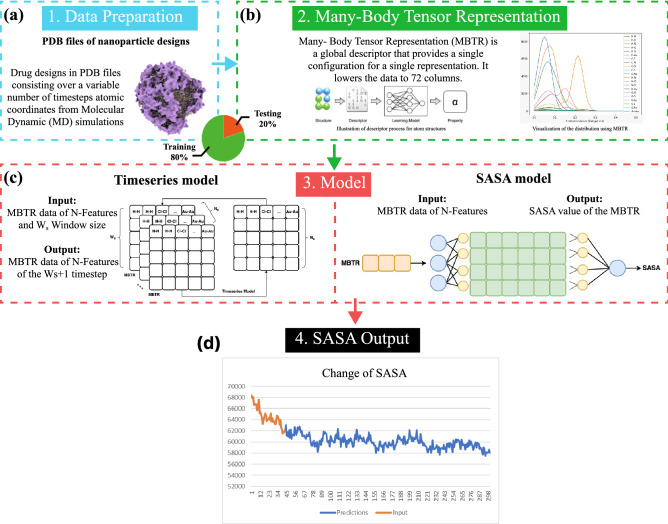
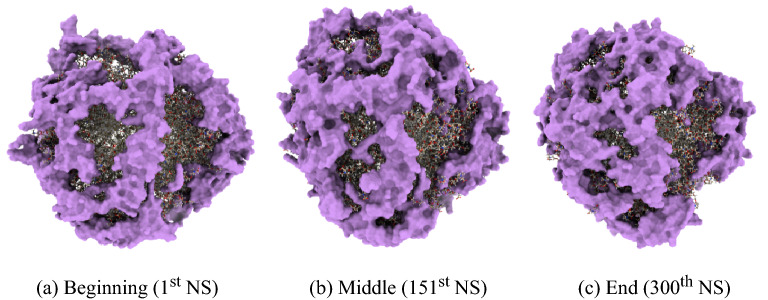
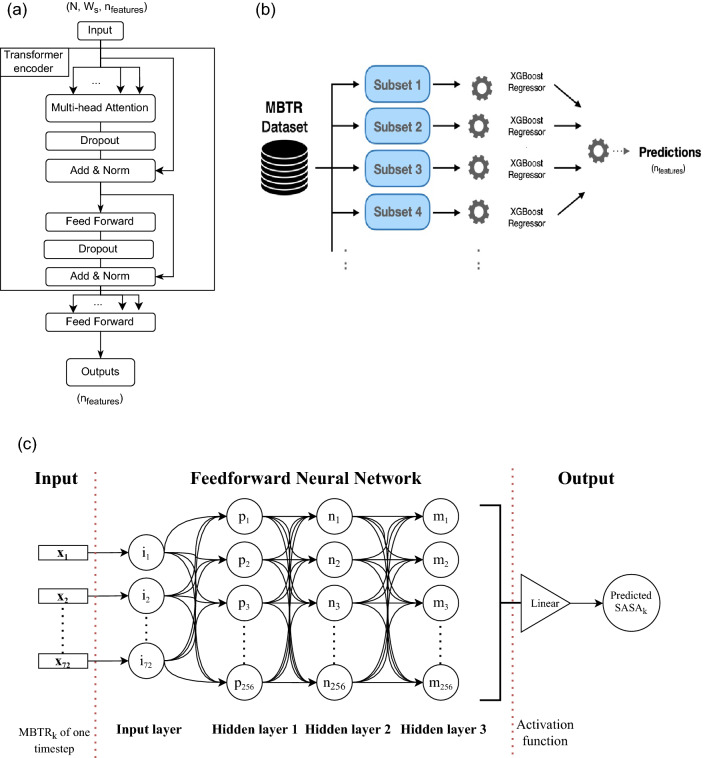
Molecular Dynamic (MD) simulations are very effective in the discovery of nanomedicines for treating cancer, but these are computationally expensive and time-consuming. Existing studies integrating machine learning (ML) into MD simulation to enhance the process and enable efficient analysis cannot provide direct insights without the complete simulation. In this study, we present an ML-based approach for predicting the solvent accessible surface area (SASA) of a nanoparticle (NP), denoting its efficacy, from a fraction of the MD simulations data. The proposed framework uses a time series model for simulating the MD, resulting in an intermediate state, and a second model to calculate the SASA in that state. Empirically, the solution can predict the SASA value 260 timesteps ahead 7.5 times faster with a very low average error of 1956.93. We also introduce the use of an explainability technique to validate the predictions. This work can reduce the computational expense of both processing and data size greatly while providing reliable solutions for the nanomedicine design process.
© 2023. The Author(s).
Conflict of interest statement
The authors declare no competing interests.
Figures
Similar articles
-
Utilizing machine learning and molecular dynamics for enhanced drug delivery in nanoparticle systems.Sci Rep. 2024 Nov 4;14(1):26677. doi: 10.1038/s41598-024-73268-0. Sci Rep. 2024. PMID: 39496651 Free PMC article.
-
Combining Molecular Dynamics and Machine Learning to Predict Self-Solvation Free Energies and Limiting Activity Coefficients.J Chem Inf Model. 2020 Nov 23;60(11):5319-5330. doi: 10.1021/acs.jcim.0c00479. Epub 2020 Sep 1. J Chem Inf Model. 2020. PMID: 32786697
-
Predicting the impacts of mutations on protein-ligand binding affinity based on molecular dynamics simulations and machine learning methods.Comput Struct Biotechnol J. 2020 Feb 20;18:439-454. doi: 10.1016/j.csbj.2020.02.007. eCollection 2020. Comput Struct Biotechnol J. 2020. PMID: 32153730 Free PMC article.
-
Simulations meet machine learning in structural biology.Curr Opin Struct Biol. 2018 Apr;49:139-144. doi: 10.1016/j.sbi.2018.02.004. Epub 2018 Feb 21. Curr Opin Struct Biol. 2018. PMID: 29477048 Review.
-
Solvents to Fragments to Drugs: MD Applications in Drug Design.Molecules. 2018 Dec 11;23(12):3269. doi: 10.3390/molecules23123269. Molecules. 2018. PMID: 30544890 Free PMC article. Review.
Cited by
-
Advancing engineering design strategies for targeted cancer nanomedicine.Nat Rev Cancer. 2025 Aug 1. doi: 10.1038/s41568-025-00847-2. Online ahead of print. Nat Rev Cancer. 2025. PMID: 40751005 Review.
-
The Nanocarrier Landscape─Evaluating Key Drug Delivery Vehicles and Their Capabilities: A Translational Perspective.ACS Appl Mater Interfaces. 2025 Jul 2;17(26):37383-37403. doi: 10.1021/acsami.5c07366. Epub 2025 Jun 17. ACS Appl Mater Interfaces. 2025. PMID: 40526827 Free PMC article. Review.
-
Nanotechnology-Driven Drug Delivery Systems for Lung Cancer: Computational Advances and Clinical Perspectives.Thorac Cancer. 2025 Jul;16(14):e70134. doi: 10.1111/1759-7714.70134. Thorac Cancer. 2025. PMID: 40682256 Free PMC article. Review.
-
Point biserial correlation symbiotic organism search nanoengineering based drug delivery for tumor diagnosis.Sci Rep. 2024 Mar 19;14(1):6530. doi: 10.1038/s41598-024-55159-6. Sci Rep. 2024. PMID: 38503765 Free PMC article.
-
The anticancer activity of fucoidan coated selenium nanoparticles and curcumin nanoparticles against colorectal cancer lines.Sci Rep. 2025 Jan 2;15(1):287. doi: 10.1038/s41598-024-82687-y. Sci Rep. 2025. PMID: 39747357 Free PMC article.
References
-
- Stillman NR, et al. Evolutionary computational platform for the automatic discovery of nanocarriers for cancer treatment. npj Comput. Mater. 2021;7:150. doi: 10.1038/s41524-021-00614-5. - DOI
-
- Khan I, Saeed K, Khan I. Nanoparticles: Properties, applications and toxicities. Arab. J. Chem. 2019;12:908–931. doi: 10.1016/j.arabjc.2017.05.011. - DOI
Publication types
MeSH terms
Substances
LinkOut - more resources
Full Text Sources
Medical
Miscellaneous
