

Complexity vs linearity: relations between functional traits in a heterotrophic protist
- PMID: 36631737
- PMCID: PMC9832698
- DOI: 10.1186/s12862-022-02102-w
Complexity vs linearity: relations between functional traits in a heterotrophic protist
Abstract
Background: Functional traits are phenotypic traits that affect an organism's performance and shape ecosystem-level processes. The main challenge when using functional traits to quantify biodiversity is to choose which ones to measure since effort and money are limited. As one way of dealing with this, Hodgson et al. (Oikos 85:282, 1999) introduced the idea of two types of traits, with soft traits that are easy and quick to quantify, and hard traits that are directly linked to ecosystem functioning but difficult to measure. If a link exists between the two types of traits, then one could use soft traits as a proxy for hard traits for a quick but meaningful assessment of biodiversity. However, this framework is based on two assumptions: (1) hard and soft traits must be tightly connected to allow reliable prediction of one using the other; (2) the relationship between traits must be monotonic and linear to be detected by the most common statistical techniques (e.g. linear model, PCA).
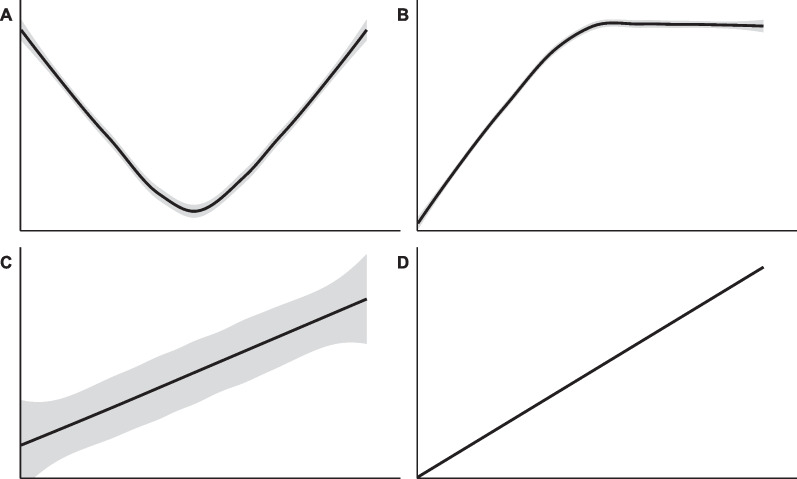
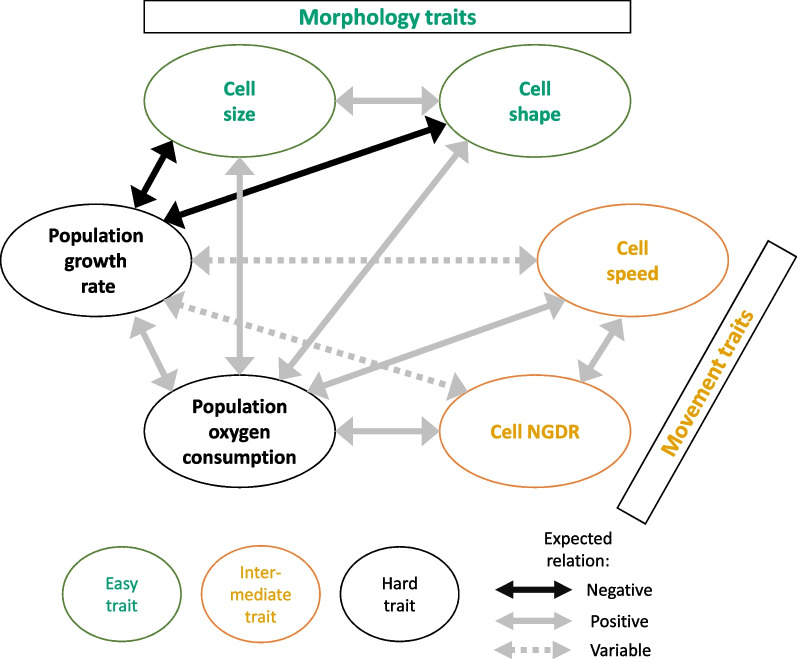
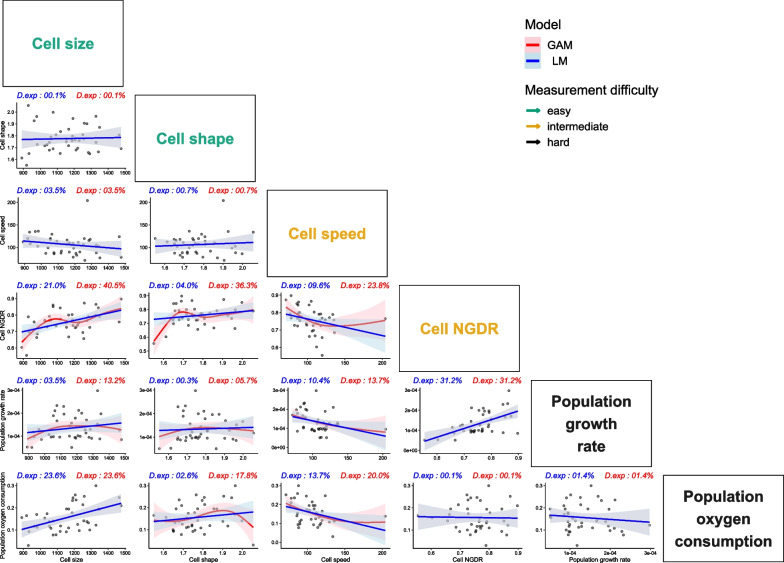
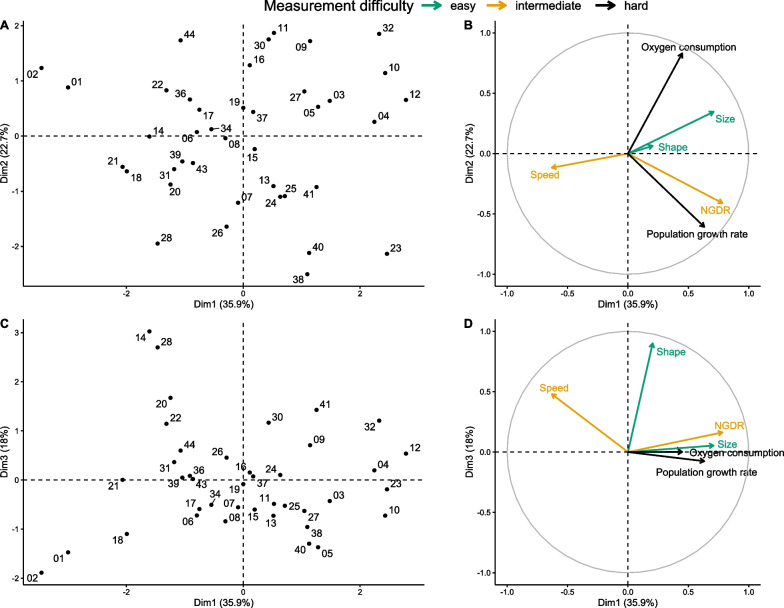
Results: Here we addressed those two assumptions by focusing on six functional traits of the protist species Tetrahymena thermophila, which vary both in their measurement difficulty and functional meaningfulness. They were classified as: easy traits (morphological traits), intermediate traits (movement traits) and hard traits (oxygen consumption and population growth rate). We detected a high number (> 60%) of non-linear relations between the traits, which can explain the low number of significant relations found using linear models and PCA analysis. Overall, these analyses did not detect any relationship strong enough to predict one trait using another, but that does not imply there are none.
Conclusions: Our results highlighted the need to critically assess the relations among the functional traits used as proxies and those functional traits which they aim to reflect. A thorough assessment of whether such relations exist across species and communities is a necessary next step to evaluate whether it is possible to take a shortcut in quantifying functional diversity by collecting the data on easily measurable traits.
Keywords: Functional traits; Linearity assumption; Soft/hard traits framework; Tetrahymena thermophila; Trait relations.
© 2023. The Author(s).
Conflict of interest statement
The authors declare that they have no competing interests.
Figures
Similar articles
-
Response-effect trait overlap and correlation in riparian plant communities suggests sensitivity of ecosystem functioning and services to environmental change.Sci Total Environ. 2023 Feb 20;860:160549. doi: 10.1016/j.scitotenv.2022.160549. Epub 2022 Nov 29. Sci Total Environ. 2023. PMID: 36455733
-
Non-genetic phenotypic variability affects populations and communities in protist microcosms.J Anim Ecol. 2024 Feb;93(2):221-230. doi: 10.1111/1365-2656.14036. Epub 2024 Jan 8. J Anim Ecol. 2024. PMID: 38192091
-
Can metabolic traits explain animal community assembly and functioning?Biol Rev Camb Philos Soc. 2023 Feb;98(1):1-18. doi: 10.1111/brv.12892. Epub 2022 Aug 25. Biol Rev Camb Philos Soc. 2023. PMID: 36054431 Review.
-
Predicting ecosystem vulnerability to biodiversity loss from community composition.Ecology. 2018 May;99(5):1099-1107. doi: 10.1002/ecy.2219. Epub 2018 Apr 18. Ecology. 2018. PMID: 29569236
-
A research framework for projecting ecosystem change in highly diverse tropical mountain ecosystems.Oecologia. 2021 Mar;195(3):589-600. doi: 10.1007/s00442-021-04852-8. Epub 2021 Jan 30. Oecologia. 2021. PMID: 33515062 Free PMC article. Review.
References
-
- Hooper DU, Chapin FS, Ewel JJ, Hector A, Inchausti P, Lavorel S, et al. Effects of biodiversity on ecosystem functioning: a consensus of current knowledge. Ecol Monogr [Internet]. 2005;75(1):3–35. doi: 10.1890/04-0922. - DOI
-
- Balvanera P, Siddique I, Dee L, Paquette A, Isbell F, Gonzalez A, et al. Linking biodiversity and ecosystem services: current uncertainties and the necessary next steps. Bioscience [Internet]. 2014;64(1):49–57. doi: 10.1093/biosci/bit003. - DOI
Publication types
MeSH terms
Grants and funding
LinkOut - more resources
Full Text Sources
Research Materials