. 2023 Jan 11;24(1):2.
doi: 10.1186/s12868-022-00766-0.

Effects of low-doses of methamphetamine on d-fenfluramine-induced head-twitch response (HTR) in mice during ageing and c-fos expression in the prefrontal cortex

Affiliations

Effects of low-doses of methamphetamine on d-fenfluramine-induced head-twitch response (HTR) in mice during ageing and c-fos expression in the prefrontal cortex

Yina Sun et al. BMC Neurosci. .

Abstract

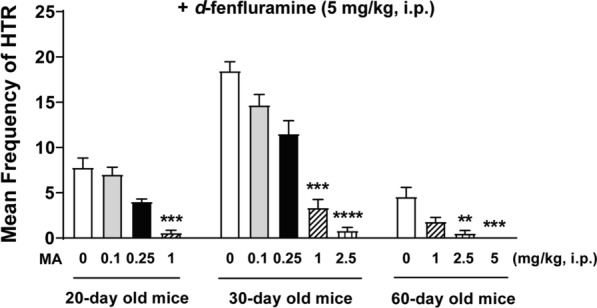
Background: The head-twitch response (HTR) in mice is considered a behavioral model for hallucinogens and serotonin 5-HT2A receptor function, as well as Tourette syndrome in humans. It is mediated by 5-HT2A receptor agonists such as ( ±)- 2,5-dimethoxy-4-iodoamphetamine (DOI) in the prefrontal cortex (PFC). The 5-HT2A antagonist EMD 281014, can prevent both DOI-induced HTR during ageing and c-fos expression in different regions of PFC. Moreover, the nonselective monoamine releaser methamphetamine (MA) suppressed DOI-induced HTR through ageing via concomitant activation of inhibitory 5-HT1A receptors, but enhanced DOI-evoked c-fos expression. d-Fenfluramine is a selective 5-HT releaser and induces HTR in mice, whereas MA does not. Currently, we investigated whether EMD 281014 or MA would alter: (1) d-fenfluramine-induced HTR frequency in 20-, 30- and 60-day old mice, (2) d-fenfluramine-evoked c-fos expression in PFC, and (3) whether blockade of inhibitory serotonergic 5-HT1A- or adrenergic ɑ2-receptors would prevent suppressive effect of MA on d-fenfluramine-induced HTR.

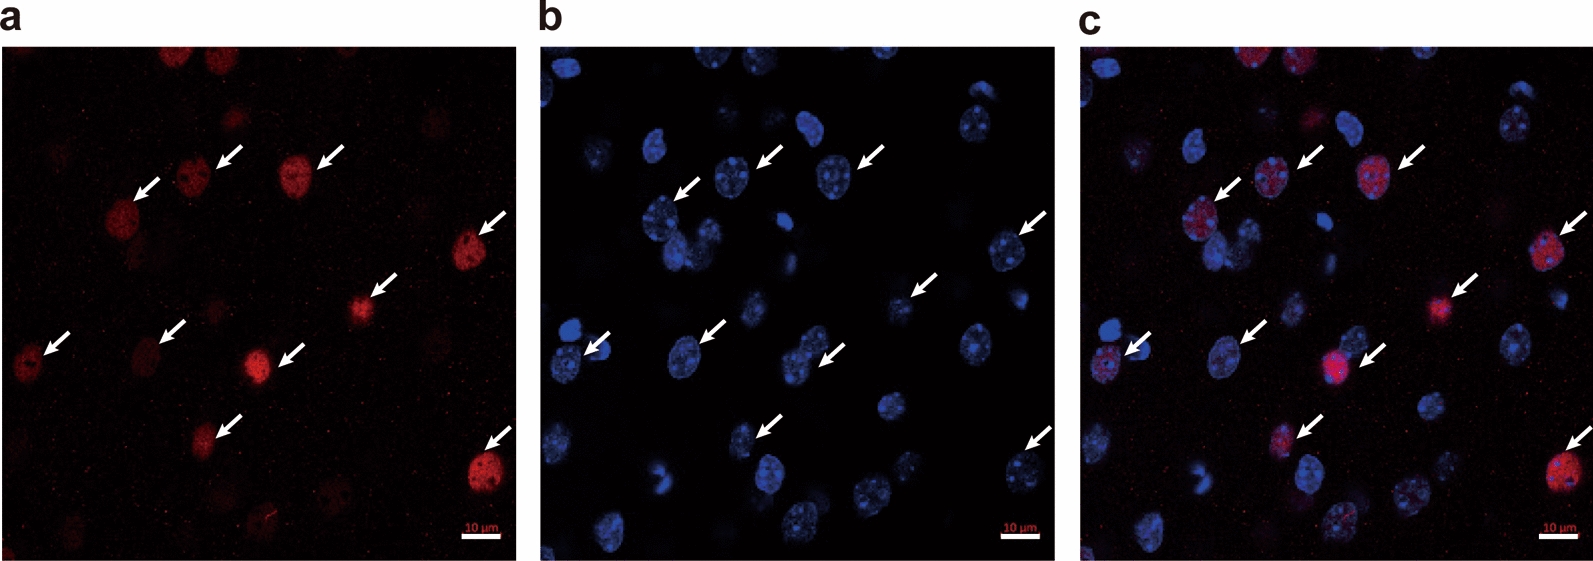
Results: EMD 281014 (0.001-0.05 mg/kg) or MA (0.1-5 mg/kg) blocked d-fenfluramine-induced HTR dose-dependently during ageing. The 5-HT1A antagonist WAY 100635 countered the inhibitory effect of MA on d-fenfluramine-induced HTR in 30-day old mice, whereas the adrenergic ɑ2 antagonist RS 79948 reversed MA's inhibitory effect in both 20- and 30- day old mice. d-Fenfluramine significantly increased c-fos expressions in PFC regions. MA (1 mg/kg) pretreatment significantly increased d-fenfluramine-evoked c-fos expression in different regions of PFC. EMD 281014 (0.05 mg/kg) failed to prevent d-fenfluramine-induced c-fos expression, but significantly increased it in one PFC region (PrL at - 2.68 mm).

Conclusion: EMD 281014 suppressed d-fenfluramine-induced HTR but failed to prevent d-fenfluramine-evoked c-fos expression which suggest involvement of additional serotonergic receptors in the mediation of evoked c-fos. The suppressive effect of MA on d-fenfluramine-evoked HTR is due to well-recognized functional interactions between stimulatory 5-HT2A- and the inhibitory 5-HT1A- and ɑ2-receptors. MA-evoked increases in c-fos expression in PFC regions are due to the activation of diverse monoaminergic receptors through increased synaptic concentrations of 5-HT, NE and/or DA, which may also account for the additive effect of MA on d-fenfluramine-evoked changes in c-fos expression. Our findings suggest potential drug receptor functional interaction during development when used in combination.

Keywords: 5-HT1A receptor; 5-HT2A receptor; Adrenergic ɑ2-receptors; Head-twitch response; Methamphetamine; d-fenfluramine.


Conflict of interest statement

The author(s) declare no potential conflicts of interest with respect to the research, authorship, and/or publication of this article.

Figures

Fig. 1
Fig. 1
The individual as well as mean (± SEM) frequency of HTR induced by d-fenfluramine (5 mg/kg, i.p.) across different ages (20-, 30- and 60-day old) in mice. Significant differences occurring between 20- and 30-day (****p < 0.0001) and between 30- and 60-day old mice (****p < 0.0001). One-way ANOVA followed by Tukey's test. n = 10 in each age group. Data are presented as means ± SEM
Fig. 2
Fig. 2
Suppressive effects of varying doses of the selective 5-HT2A receptor antagonist EMD 281014 (0, 0.001, 0.005, 0.01 and 0.05 mg/kg, i.p.) on the mean (± SEM) frequency of HTR induced by d-fenfluramine (5 mg/kg, i.p.) in 20-, 30- and 60-day old mice. Among the EMD 281014 vehicle-pretreated control age groups, significant differences in the mean frequency of d-fenfluramine-induced HTR were observed between 20- and 30-day (####p < 0.0001) and between 30- and 60-day old mice (####p < 0.0001). Varying doses of EMD 281014 suppressed d-fenfluramine-induced HTR in a dose-dependent manner across the age-range tested. Compared to corresponding age-matched vehicle-pretreated control group, significant reductions were observed at all tested doses of EMD 281014 in 30-day old mice, but only at 0.005, 0.01 and 0.05 mg/kg doses in 20- and 60-day old mice. *p < 0.05, **p < 0.01, ***p < 0.001, ****p < 0.0001 vs. vehicle injection; two-way ANOVA followed by Dunnett's test. n = 5 − 9 in each group. Data are presented as means ± SEM
Fig. 3
Fig. 3
Suppressive effects of varying doses of MA on the mean (± SEM) frequency of HTR induced by d-fenfluramine (5 mg/kg, i.p.) in 20 (MA at 0, 0.1, 0.25, 1 mg/kg, i.p.)-, 30 (MA at 0, 0.1, 0.25, 1, 2.5 mg/kg, i.p.)- and 60 (MA at 0, 1, 2.5, 5 mg/kg, i.p.)-day old mice. Varying doses of MA inhibited d-fenfluramine-induced HTR in a dose-dependent manner across the age-range tested. Compared to corresponding age-matched vehicle-pretreated control group, significant reductions were observed at 1 mg/kg in 20-day old mice, at 1 and 2.5 mg/kg in 30-day old mice, at 2.5 and 5 mg/kg in 60-day old mice, respectively. **p < 0.01, ***p < 0.001, ****p < 0.0001 vs. vehicle injection; Kruskal–Wallis non-parametric one-way ANOVA followed by Dunn’s test. n = 5 − 9 in each group. Data are presented as means ± SEM
Fig. 4
Fig. 4
Pretreatment with either the selective 5-HT1A receptor antagonist WAY 100635 (0.25 mg/kg, i.p., a), or the selective ɑ2-adrenergic receptor antagonist RS 79948 (0.1 mg/kg, i.p., b), reversed the inhibitory action of MA (1 mg/kg, i.p.) on d-fenfluramine-induced (5 mg/kg, i.p.) HTR in 20- and 30-day old mice. Relative to the corresponding age-matched Vehicle + Vehicle + d-fenfluramine pretreated group, MA pretreatment (i.e. MA + Vehicle + d-fenfluramine treatment group) significantly reduced the frequency of d-fenfluramine-induced HTR in 20- (*p = 0.0342) and 30-day old mice (****p < 0.0001; a, b); whereas WAY 100635 pretreatment (i.e. Vehicle + WAY 100635 + d-fenfluramine treatment group) significantly potentiated the frequency of d-fenfluramine-induced HTR in 30-day (####p < 0.0001, a) but not in 20-day old mice. Relative to the corresponding MA + Vehicle + d-fenfluramine treatment group, inclusion of WAY 100635 (i.e. the MA + WAY 100635 + d-fenfluramine treatment group) only significantly reversed the inhibitory effect of MA on DOI-induced HTR in 30-day old mice (****p < 0.0001, a); whereas inclusion of RS 79948 (i.e. the MA + RS 79948 + d-fenfluramine treatment group) significantly reversed the inhibitory effect of MA on DOI-induced HTR in both 20 (**p = 0.0082, b)- and 30 (****p < 0.0001, b)-day old mice. Two-way ANOVA followed by Dunnett's test. n = 6 − 9 in each group. Data are presented as means ± SEM
Fig. 5
Fig. 5
Double-labeled immunofluorescent staining for c-fos (red; a), DAPI (blue; b) and the merged image (c) in mice PFC. c-fos immunoreactivity was counted when the cell nucleus was round or oval, completely filled, and double-labeled with DAPI, scale bars = 10 μm
Fig. 6
Fig. 6
Effects of the selective 5-HT2A receptor antagonist EMD 281014 on d-fenfluramine-induced c-fos expression in different regions at 5 coronal sections in the PFC of mice. Compared to the Vehicle + Vehicle control group, administration of d-fenfluramine (i.e. Vehicle + d-fenfluramine group) significantly induced c-fos expressions in the: (1) FrA at the level of − 2.68 mm relative to bregma (a); (2) M1 and AI at the level of − 2.34, and − 2.1 mm relative to bregma (cf); (3) S1 and M1 at the level of − 1.98 mm relative to bregma (g); (4) S1 at the level of − 1.7 mm relative to bregma (i). Compared to the Vehicle + Vehicle group, EMD 281014 by itself (i.e. EMD 281014 + Vehicle group) did not cause any changes in c-fos expression in the PFC, whereas inclusion of d-fenfluramine (i.e. EMD 281014 + d-fenfluramine treatment group) significantly increased c-fos expression in the: (1) FrA and PrL at the level of − 2.68 mm relative to bregma (a); (2) M1 and AI at the level of − 2.34 mm relative to bregma (c, d); (3) M2 and AI at the level of − 2.1 mm relative to bregma (e, f); (4) S1, M1 and AI at the level of − 1.98 mm relative to bregma (g, h); (5) S1 at the level of − 1.7 mm relative to bregma (i). Compared to the EMD 281014 + Vehicle treatment group, inclusion of d-fenfluramine (i.e. EMD 281014 + d-fenfluramine treatment group) significantly increased c-fos expression in the: (1) PrL at the level of − 2.68 mm relative to bregma (a); (2) M1 and AI at the level of − 2.34 mm relative to bregma (c, d); (3) M2 at the level of − 2.1 mm relative to bregma (e); (4) S1 at the level of − 1.98 mm relative to bregma (g). However, EMD 281014 did not prevent d-fenfluramine -induced c-fos expressions in the areas of the PFC (i.e., EMD 281014 + d-fenfluramine treatment group vs. Vehicle + d-fenfluramine treatment group, (aj). In addition, pre-treatment with EMD 281014 significantly increased d-fenfluramine-induced c-fos expression in the PrL at the level of − 2.68 mm relative to bregma (a). *p < 0.05, **p < 0.01, ***p < 0.001 vs. Vehicle + Vehicle pretreated control-mice; #p < 0.05 vs. Vehicle + d-fenfluramine treatment group; $p < 0.05, $$p < 0.01, $$$p < 0.001 vs. EMD 281014 + Vehicle group; one-way ANOVA followed by Tukey's test. Data are presented as means ± SEM
Fig. 7
Fig. 7
Effects of MA on d-fenfluramine-induced c-fos expression in different regions at 5 coronal sections in the PFC of mice. Relative to Vehicle + Vehicle group, d-fenfluramine by itself (i.e., Vehicle + d-fenfluramine) significantly increased c-fos expression in the areas in mice PFC as described in Fig. 6. Compared to the Vehicle + Vehicle control group, MA by itself (i.e. MA + Vehicle group) significantly increased c-fos expressions in the: (1) FrA, PrL, LO and DLO at the level of − 2.68 mm relative to bregma (a, b); (2) M1, M2, Cg1 and AI at the level of − 2.34 and − 2.1 mm relative to bregma (cf); (3) S1 and M1 at the level of − 1.98 and − 1.7 mm relative to bregma (g, i); inclusion of d-fenfluramine (i.e. MA + d-fenfluramine treatment group) significantly increased c-fos expression in the: (1) FrA, PrL, LO and DLO at the level of − 2.68 mm relative to bregma (a, b); (2) M1, M2 and AI at the level of − 2.34 and − 2.1 mm relative to bregma (cf); (3) S1, M1 and AI at the level of − 1.98 mm relative to bregma (g, h); (4) S1, M1 and M2 at the level of − 1.7 mm relative to bregma (i). Compared to the Vehicle + d-fenfluramine group, pre-treatment with MA (i.e. MA + d-fenfluramine group) significantly increased c-fos expression in the: (1) FrA, LO and DLO at the level of − 2.68 mm relative to bregma (a, b); (2) M2 at the level of − 2.34 mm relative to bregma (c); (3) M1, M2 and AI at the level of − 2.1 mm relative to bregma (e, f); (4) S1 and M1 at the level of − 1.98 and − 1.7 mm relative to bregma (g, i). Neither MA alone nor in combination with d-fenfluramine produced any significant changes in c-fos expression in the: (1) MO, VO at the level of − 2.68 mm relative to bregma (a, b); (2) PrL, MO, VO and LO at the level of − 2.34 and − 2.1 mm relative to bregma (cf); (3) M2, Cg1, PrL, IL, MO, VO and LO at the level of − 1.98 mm relative to bregma (g, h); and (4) Cg1, PrL, IL and DP at the level of − 1.7 mm relative to bregma (i, j). *p < 0.05, **p < 0.01, ***p < 0.001, ****p < 0.0001 vs. Vehicle + Vehicle group; #p < 0.05, ##p < 0.01, ###p < 0.001, ####p < 0.0001 vs. Vehicle + d-fenfluramine group; one-way ANOVA followed by Tukey's test. Data are presented as means ± SEM

Similar articles

References

    1. Canal CE, Morgan D. Head-twitch response in rodents induced by the hallucinogen 2,5-dimethoxy-4-iodoamphetamine: a comprehensive history, a re-evaluation of mechanisms, and its utility as a model. Drug Test Anal. 2012;4:556–576. doi: 10.1002/dta.1333. - DOI - PMC - PubMed
    1. Halberstadt AL, Chatha M, Klein AK, Wallach J, Brandt SD. Correlation between the potency of hallucinogens in the mouse head-twitch response assay and their behavioral and subjective effects in other species. Neuropharmacology. 2020;167:107933. doi: 10.1016/j.neuropharm.2019.107933. - DOI - PMC - PubMed
    1. Tizabi Y, Russell LT, Johnson M, Darmani NA. Nicotine attenuates DOI-induced head-twitch response in mice: implications for Tourette syndrome. Prog Neuropsychopharmacol Biol Psychiatr. 2001;25:1445–1457. doi: 10.1016/S0278-5846(01)00194-4. - DOI - PubMed
    1. Hongyan L, Zhenyang S, Chunyan W, Qingqing P. Lipopolysaccharide aggravated DOI-induced Tourette syndrome: elaboration for recurrence of Tourette syndrome. Metab Brain Dis. 2017;32:1929–1934. doi: 10.1007/s11011-017-0084-3. - DOI - PubMed
    1. Darmani NA, Johnson JC. Central and peripheral mechanisms contribute to the antiemetic actions of delta-9-tetrahydrocannabinol against 5-hydroxytryptophan-induced emesis. Eur J Pharmacol. 2004;488:201–212. doi: 10.1016/j.ejphar.2004.02.018. - DOI - PubMed

Publication types

MeSH terms