. 2023 Jan 11;23(1):8.
doi: 10.1186/s12874-023-01837-4.

Machine learning for predicting neurodegenerative diseases in the general older population: a cohort study

Affiliations

Machine learning for predicting neurodegenerative diseases in the general older population: a cohort study

Gloria A Aguayo et al. BMC Med Res Methodol. .

Erratum in

Abstract

Background: In the older general population, neurodegenerative diseases (NDs) are associated with increased disability, decreased physical and cognitive function. Detecting risk factors can help implement prevention measures. Using deep neural networks (DNNs), a machine-learning algorithm could be an alternative to Cox regression in tabular datasets with many predictive features. We aimed to compare the performance of different types of DNNs with regularized Cox proportional hazards models to predict NDs in the older general population.

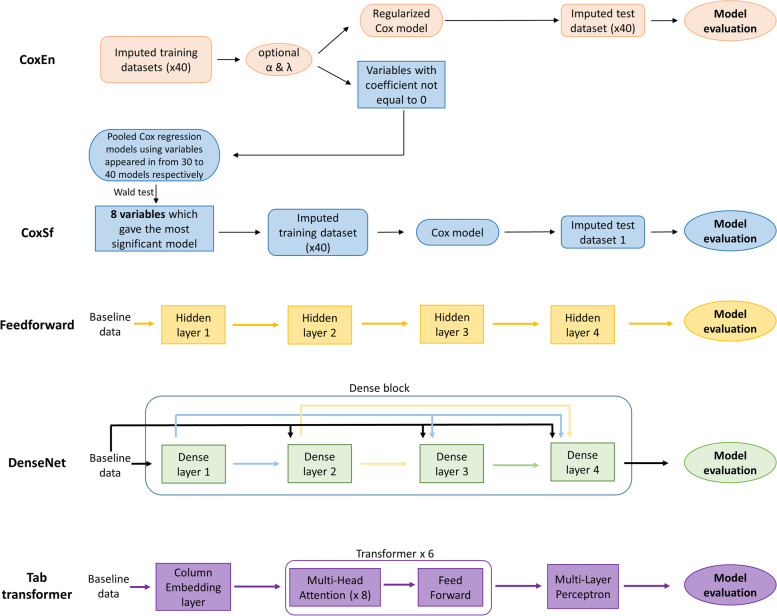
Methods: We performed a longitudinal analysis with participants of the English Longitudinal Study of Ageing. We included men and women with no NDs at baseline, aged 60 years and older, assessed every 2 years from 2004 to 2005 (wave2) to 2016-2017 (wave 8). The features were a set of 91 epidemiological and clinical baseline variables. The outcome was new events of Parkinson's, Alzheimer or dementia. After applying multiple imputations, we trained three DNN algorithms: Feedforward, TabTransformer, and Dense Convolutional (Densenet). In addition, we trained two algorithms based on Cox models: Elastic Net regularization (CoxEn) and selected features (CoxSf).

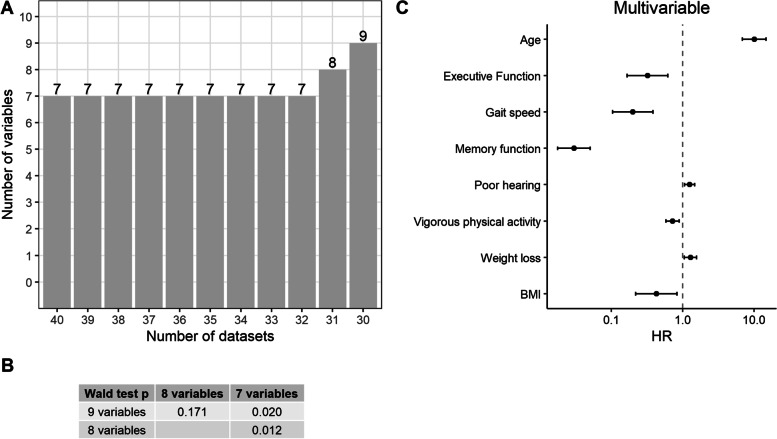
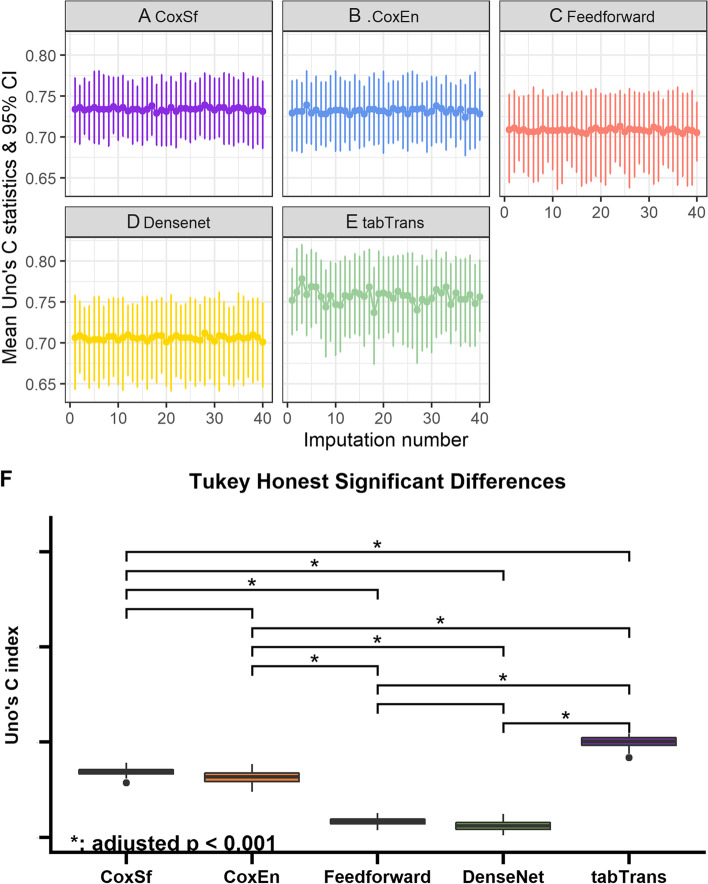
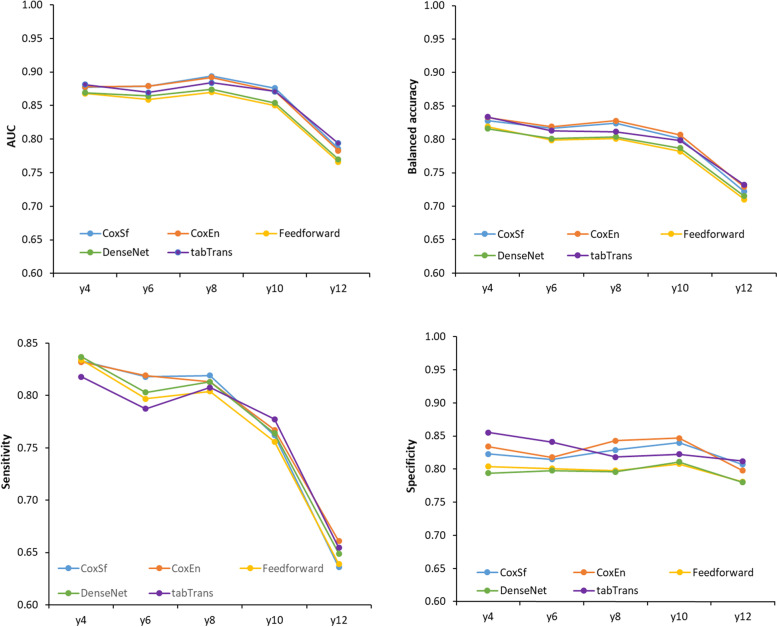
Results: 5433 participants were included in wave 2. During follow-up, 12.7% participants developed NDs. Although the five models predicted NDs events, the discriminative ability was superior using TabTransformer (Uno's C-statistic (coefficient (95% confidence intervals)) 0.757 (0.702, 0.805). TabTransformer showed superior time-dependent balanced accuracy (0.834 (0.779, 0.889)) and specificity (0.855 (0.0.773, 0.909)) than the other models. With the CoxSf (hazard ratio (95% confidence intervals)), age (10.0 (6.9, 14.7)), poor hearing (1.3 (1.1, 1.5)) and weight loss 1.3 (1.1, 1.6)) were associated with a higher DNN risk. In contrast, executive function (0.3 (0.2, 0.6)), memory (0, 0, 0.1)), increased gait speed (0.2, (0.1, 0.4)), vigorous physical activity (0.7, 0.6, 0.9)) and higher BMI (0.4 (0.2, 0.8)) were associated with a lower DNN risk.

Conclusion: TabTransformer is promising for prediction of NDs with heterogeneous tabular datasets with numerous features. Moreover, it can handle censored data. However, Cox models perform well and are easier to interpret than DNNs. Therefore, they are still a good choice for NDs.

Keywords: Alzheimer; Cox models; Deep neural networks; Dementia; Older general population; Parkinson disease; Prediction; Tabular data.


Conflict of interest statement

The authors declare that the research was conducted in the absence of any commercial or financial relationships that could be construed as a potential conflict of interest.

Figures

Fig. 1
Fig. 1
Model architecture developed for prediction of new events of neurodegenerative diseases. Time of follow-up: from 2004 to 2005 to 2016–2017. Population: The English Longitudinal Study of Ageing. Cox models with Elastic Net regularisation are in salmon, and Cox models with selected variables are in blue. The FeedForward model is in yellow, the Densenet model is in green and the TabTransformer model is in blue-violet. In the deep neural network models (Feedforward, Densenet and TabTransformer), the input was the baseline data (91 features) and the log-risk function is the output of the network
Fig. 2
Fig. 2
Cox model with selected features and pooled Cox regression model of new events of neurodegenerative diseases. Panel A: The number above the columns shows the number of features appearing in different numbers of imputed datasets (from 30 to 40). Seven variables appeared in 32 to 40 imputed datasets, 8 variables in 31 datasets and 9 variables in 30 datasets. Panel B: P values from the Wald test on the pooled Cox regression models with different numbers of variables. P values < 0.05 are shown in bold. The model with eight variables showed the most significant difference (smallest p value) compared to the other models. Panel C: Hazard ratios and 95% confidence intervals in Cox regression model with eight selected variables (CoxSf) pooled according to the Rubin’s rules. All the selected variables were significantly associated with neurocognitive disorders
Fig. 3
Fig. 3
Assessing the models for predicting new events of neurodegenerative diseases from 2004 to 2005 to 2016–2017. The English Longitudinal Study of Ageing. Bootstrapping results of the mean (and 95% confidence intervals) of Uno’s C-statistics on the 40 imputed test datasets. Panel A shows Cox regression model with eight selected variables (CoxSf). Panel B shows Elastic Net regularised Cox regression model (CoxEn). Panel C shows FeedForward neural network model (Feedforward). Panel D shows DenseNet neural network model (Densenet). Panel E shows TabTransformer neural network (tabTrans). Panel F The difference of Uno’s C-statistic among the five models was significant (Tukey’s test adjusted p < 0.001)
Fig. 4
Fig. 4
Time-dependent assessment of models predicting new events of neurodegenerative diseases. The curves represent the evolution of the performance assessed with time-dependent AUC, balanced accuracy, sensitivity and specificity for each of the five models. Panel A: The average of AUC from 40 imputed test datasets in 4, 6, 8, 10 and 12 years after the enrolment. Panel B: The average of balanced accuracy from 40 imputed test datasets in 4, 6, 8, 10 and 12 years after the enrolment. Panel C: The average of sensitivity from 40 imputed test datasets in 4, 6, 8, 10 and 12 years after the enrolment. Panel D: The average of specificity from 40 imputed test datasets in 4, 6, 8, 10 and 12 years after the enrolment

References

    1. Erkkinen MG, Kim M-O, Geschwind MD. Clinical neurology and epidemiology of the major neurodegenerative diseases. Cold Spring Harb Perspect Biol. 2018;10(4):a033118. doi: 10.1101/cshperspect.a033118. - DOI - PMC - PubMed
    1. Hou Y, Dan X, Babbar M, Wei Y, Hasselbalch SG, Croteau DL, et al. Ageing as a risk factor for neurodegenerative disease. Nat Rev Neurol. 2019;15(10):565–581. doi: 10.1038/s41582-019-0244-7. - DOI - PubMed
    1. Vermunt L, Sikkes SA, Van Den Hout A, Handels R, Bos I, Van Der Flier WM, et al. Duration of preclinical, prodromal, and dementia stages of Alzheimer's disease in relation to age, sex, and APOE genotype. Alzheimers Dement. 2019;15(7):888–898. doi: 10.1016/j.jalz.2019.04.001. - DOI - PMC - PubMed
    1. Dommershuijsen LJ, Boon AJ, Ikram MK. Probing the pre-diagnostic phase of Parkinson's disease in population-based studies. Front Neurol. 2021;12:1–8. - PMC - PubMed
    1. Wingo TS, Liu Y, Gerasimov ES, Vattathil SM, Wynne ME, Liu J, et al. Shared mechanisms across the major psychiatric and neurodegenerative diseases. Nat Commun. 2022;13(1):1–19. doi: 10.1038/s41467-022-31873-5. - DOI - PMC - PubMed

Publication types