. 2022 Dec 31;31(6):376-389.
doi: 10.5607/en22024.

Lateral Septum Somatostatin Neurons are Activated by Diverse Stressors

Affiliations

Lateral Septum Somatostatin Neurons are Activated by Diverse Stressors

Myungmo An et al. Exp Neurobiol. .

Abstract

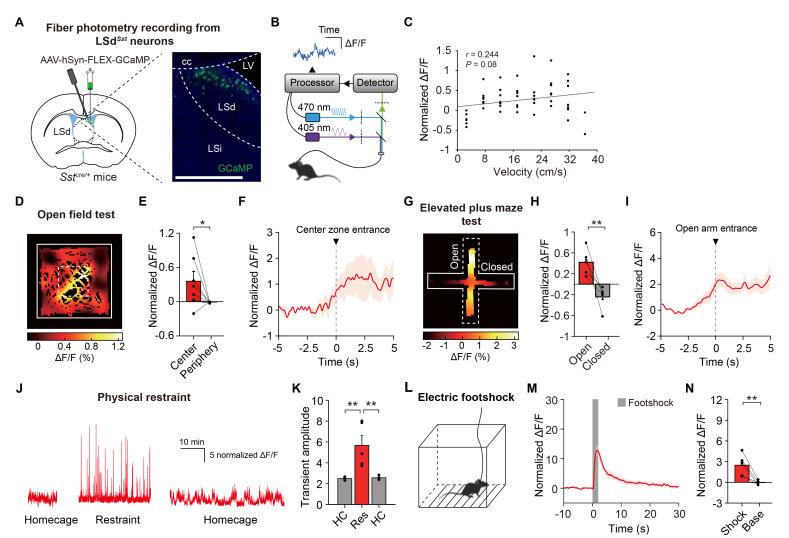
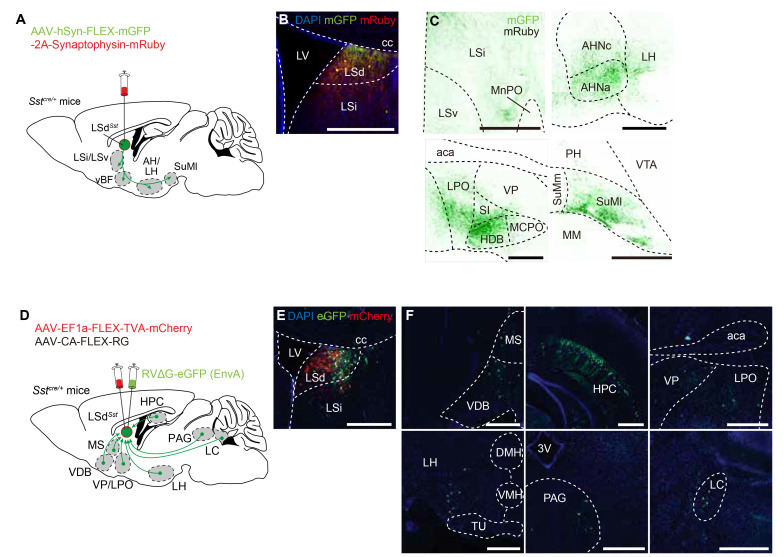
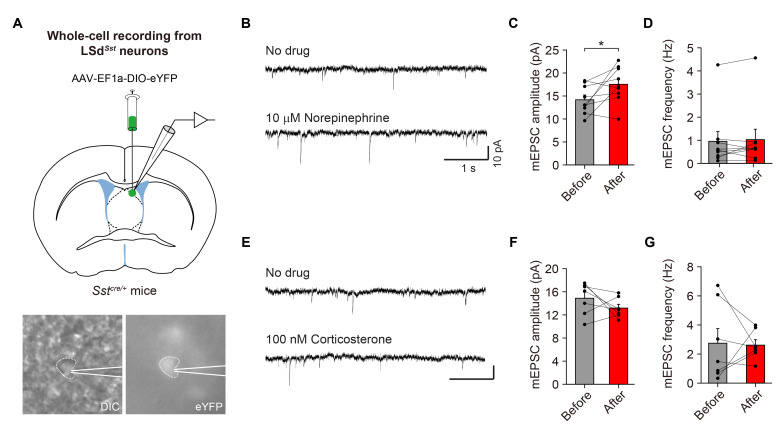
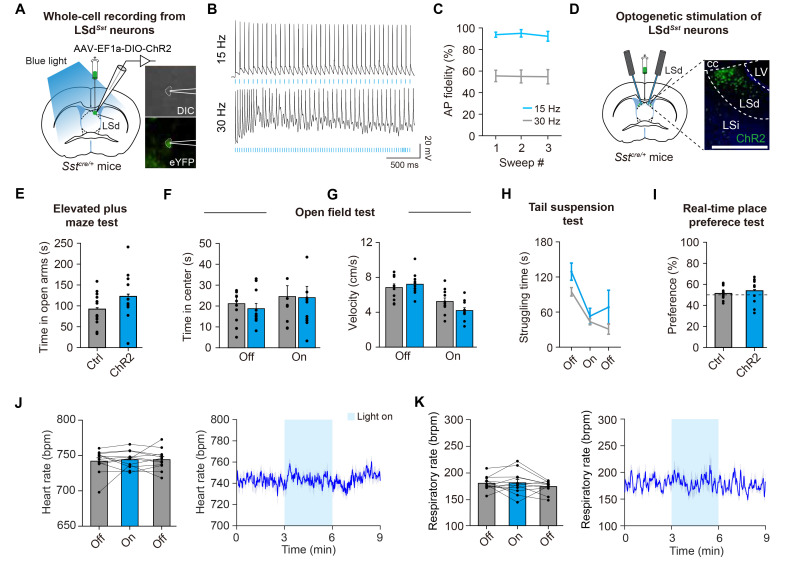
The lateral septum (LS) is a forebrain structure that has been implicated in a wide range of behavioral and physiological responses to stress. However, the specific populations of neurons in the LS that mediate stress responses remain incompletely understood. Here, we show that neurons in the dorsal lateral septum (LSd) that express the somatostatin gene (hereafter, LSdSst neurons) are activated by diverse stressors. Retrograde tracing from LSdSst neurons revealed that these neurons are directly innervated by neurons in the locus coeruleus (LC), the primary source of norepinephrine well-known to mediate diverse stress-related functions in the brain. Consistently, we found that norepinephrine increased excitatory synaptic transmission onto LSdSst neurons, suggesting the functional connectivity between LSdSst neurons and LC noradrenergic neurons. However, optogenetic stimulation of LSdSst neurons did not affect stress-related behaviors or autonomic functions, likely owing to the functional heterogeneity within this population. Together, our findings show that LSdSst neurons are activated by diverse stressors and suggest that norepinephrine released from the LC may modulate the activity of LSdSst neurons under stressful circumstances.

Keywords: Lateral septum; Locus coeruleus; Norepinephrine; Somatostatin; Stress.


Figures

Fig. 1
Fig. 1
LSdSst neurons are activated in response to diverse stressors. (A) Schematics showing Cre-dependent expression of GCaMP6 and fiberoptic cannula implantation for fiber photometry recordings from LSdSst neurons. Representative confocal images show LSd- restricted expression. Scale bar, 200 µm. (B) Schematic of the fiber photometry system. (C) Velocity of mice was only weakly correlated with the activity of LSdSst neurons (n=7, Pearson’s r=0.244, p=0.08). (D) Spatial calcium activity map of a representative mouse showing the higher activity of LSdSst neurons in the center zone of the open field arena. Average normalized calcium responses are color-coded for each pixel of spatial location. (E) Average calcium activity of LSdSst neurons in the center and the periphery (n=7, p=0.03). (F) Peri-event plot showing increases in the activity of LSdSst neurons as mice approach and enter the center zone. (G) Representative calcium response heatmap showing increased activity of LSdSst neurons in the open arms of the elevated plus maze. (H) Average calcium activity of LSdSst neurons for open arms (Open) was higher than for closed arms (Closed) (n=5, p=0.008). (I) Peri-event plot showing increases in the activity of LSdSst neurons as mice approach and enter open arms. (J) Representative traces showing increased activity of LSdSst neurons during the baselines and physical restraint. (K) Calcium transient amplitudes of LSdSst neurons were increased by restraint (n=5, one-way repeated measures ANOVA interaction, F(2,8)=19.65, p=0.0008). HC, homecage; Res, restraint. (L) Mice were given a series of electric footshocks. (M) Average calcium transients around the shock show time-locked responses of LSdSst neurons (n=5). Shaded box, footshock. (N) Average normalized calcium responses of both LSdSst neurons to shock delivery (Shock, 0~2 s from the shock onset) were larger than activity level during rest of the session (Base) (n=5, p=0.008). Data are represented as mean±s.e.m. Asterisks indicate significance levels for comparisons in each panel using Bonferroni post-tests following one-way repeated measures ANOVA or Wilcoxon rank-sum test (*p<0.05, **p<0.01).
Fig. 2
Fig. 2
LSdSst neurons are connected with regions implicated in stress response. (A) AAV vector expressing cytosol-filling mGFP and terminal bouton-labeling mRuby-fused synaptophysin was injected into the LSd of the Sstcre /+ mice for anterograde tracing (n=3). Summary of the tracing experiment is shown. (B) Example image of the injection site, showing the expression of both mRuby and mGFP. (C) Representative images of the identified projection targets. Green, mGFP; black, mRuby. MnPO, median preoptic area; AH, anterior hypothalamus; SI, substantia innominata; HDB, horizontal limb of the diagonal band of Broca; MCPO, magnocellular preoptic nucleus; PH, posterior hypothalamus; VTA, ventral tegmental area; SuMm, medial supramammillary nucleus; SuMl, lateral supramammillary nucleus; MM, medial mammillary nucleus. Scale bars, 500 μm (C), 50 μm (B, insets). (D) AAV vectors Cre-dependently expressing rabies G protein and TVA receptor, and G-deficient EnvA-pseudotyped RV carrying eGFP were injected into the LSd of the Sstcre /+ mice for tracing monosynaptic inputs of LSdSst neurons (n=3). Summary of the retrograde tracing is shown. (E) Representative confocal image of the injection site, showing the expression of mCherry fused to TVA (red) and eGFP (green). (F) Representative images of monosynaptically connected upstream neurons of LSdSst neurons. MS, medial septum; VDB, nucleus of the vertical limb of the diagonal band; HPC, hippocampus; aca, anterior commissure; VP, ventral pallidum; LPO, lateral preoptic area; LH, lateral hypothalamus; DMH, dorsomedial hypothalamic nucleus; VMH, ventromedial hypothalamic nucleus; TU, tuberal nucleus; 3V, third ventricle; PAG, periaqueductal gray; LC, locus coeruleus.
Fig. 3
Fig. 3
NE increases spontaneous excitatory synaptic transmission onto LSdSst neurons. (A) Top, schematic of Cre-dependent expression of eYFP and patch-clamp whole-cell recording from LSdSst neurons. Bottom, representative differential interference contrast (DIC) and fluorescence images of a LSdSst neuron expressing eYFP during recording. (B~D) Bath application of 10 μM NE increased mEPSC amplitude without affecting mEPSC frequency. Representative traces (B) and group data for mEPSC amplitude (n=9, p=0.039) (C) and frequency (n=9, p=0.570) (D). (E~G) Application of 100 nM corticosterone did not affect either mEPSC amplitude (n=7, p=0.297) (F) or frequency (n=7, p=0.938) (G). Scale bar, 10 pA, 1 s. Data are represented as mean±s.e.m. Asterisks indicate significance levels for comparisons using Wilcoxon rank-sum test (*p<0.05).
Fig. 4
Fig. 4
Optogenetic stimulation of LSdSst neurons does not affect stress-related behaviors or autonomic functions. (A) Schematic of patch-clamp recording from ChR2-expressing LSdSst neurons. The LS area was illuminated with blue light for optogenetic stimulations. Right, example images of a LSdSst neuron expressing ChR2-eYFP during recording. DIC, differential interference contrast. (B) Representative traces showing the responses of LSdSst neurons upon the delivery of light pulse trains in 15 Hz or 30 Hz. (C) 15 Hz blue laser-stimulation evokes action potentials (AP) with high fidelity, whereas 30 Hz stimulation shows 50~60% of success rate in inducing action potentials (n=4 cells from 2 animals). (D) Schematics showing Cre-dependent expression of ChR2 and fiberoptic cannula implantation for bilateral optogenetic stimulations of LSdSst. Representative confocal image shows LSd-restricted expression of ChR2. Scale bar, 200 µm. (E~K) Optogenetic stimulation of LSdSst neurons did not affect time spent in open arms of the elevated plus maze (n=11 ChR2, n=12 Ctrl, p=0.339) (E), time spent in the center (n=11 ChR2, n=11 Ctrl, two-way repeated measures ANOVA interaction, F(1,20)=0.097, p=0.759) (F) or velocity (n=11 ChR2, n=11 Ctrl, two-way repeated measures ANOVA interaction, F(1,20)=7.787, p=0.011) (G) in an open field arena, struggling time in the tail suspension test (n=4 ChR2, n=7 Ctrl, two-way repeated measures ANOVA interaction, F(2,18)=0.778, p=0.474) (H), nor real-time place preference (n=11 ChR2, n=12 Ctrl, p=0.347) (I). Dashed line indicates 50% preference. This manipulation also did not affect heart rate (n=12, one-way repeated measures ANOVA interaction, F(2,22)=0.199, p=0.821) (J) and respiratory rate (n=12, one-way repeated measures ANOVA interaction, F(2,22)=1.114, p=0.339) (K), Data are represented as mean±s.e.m. Asterisks indicate significance levels for comparisons in each panel using Bonferroni post-tests following two-way repeated measures ANOVA or Wilcoxon rank-sum test.

References

    1. McEwen BS. Protection and damage from acute and chronic stress: allostasis and allostatic overload and relevance to the pathophysiology of psychiatric disorders. Ann N Y Acad Sci. 2004;1032:1–7. doi: 10.1196/annals.1314.001. - DOI - PubMed
    1. Koob GF. A role for brain stress systems in addiction. Neuron. 2008;59:11–34. doi: 10.1016/j.neuron.2008.06.012. - DOI - PMC - PubMed
    1. Hollon NG, Burgeno LM, Phillips PE. Stress effects on the neural substrates of motivated behavior. Nat Neurosci. 2015;18:1405–1412. doi: 10.1038/nn.4114. - DOI - PMC - PubMed
    1. Ulrich-Lai YM, Herman JP. Neural regulation of endocrine and autonomic stress responses. Nat Rev Neurosci. 2009;10:397–409. doi: 10.1038/nrn2647. - DOI - PMC - PubMed
    1. Lupien SJ, McEwen BS, Gunnar MR, Heim C. Effects of stress throughout the lifespan on the brain, behaviour and cognition. Nat Rev Neurosci. 2009;10:434–445. doi: 10.1038/nrn2639. - DOI - PubMed