. 2023 Feb 22;51(3):1208-1228.
doi: 10.1093/nar/gkac1223.

Genome-wide mapping of fluoroquinolone-stabilized DNA gyrase cleavage sites displays drug specific effects that correlate with bacterial persistence

Affiliations

Genome-wide mapping of fluoroquinolone-stabilized DNA gyrase cleavage sites displays drug specific effects that correlate with bacterial persistence

Juechun Tang et al. Nucleic Acids Res. .

Abstract

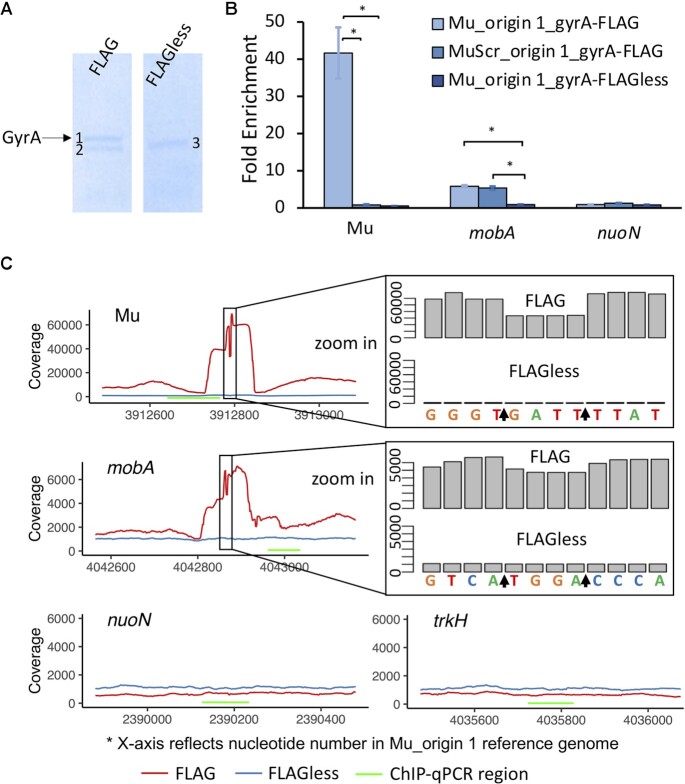
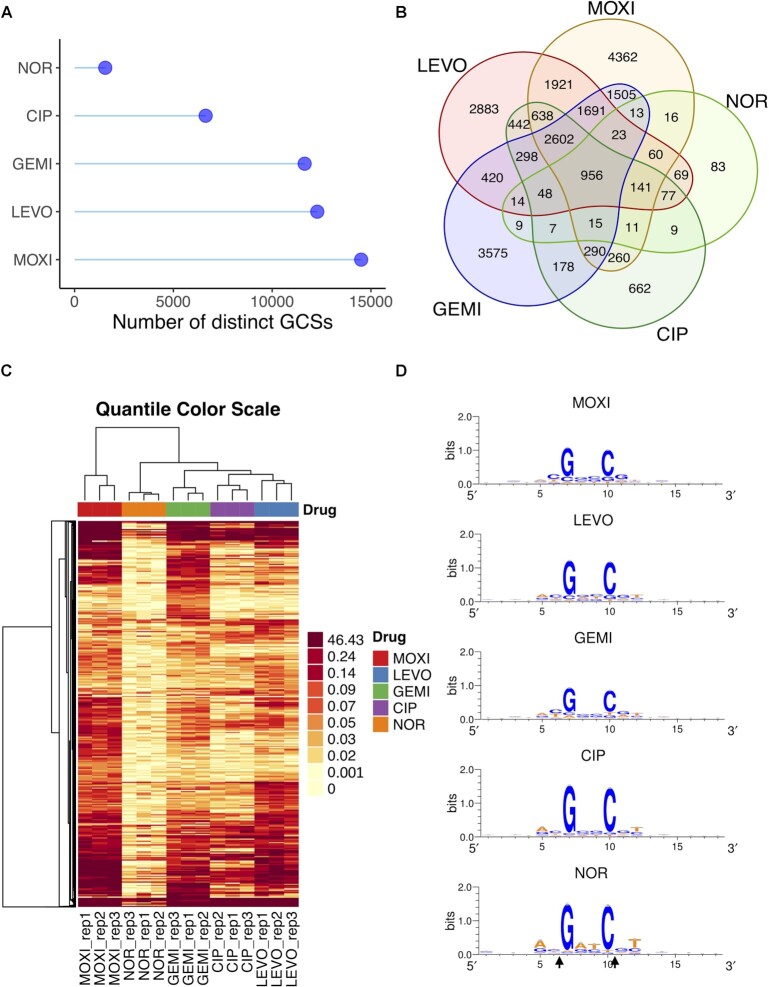
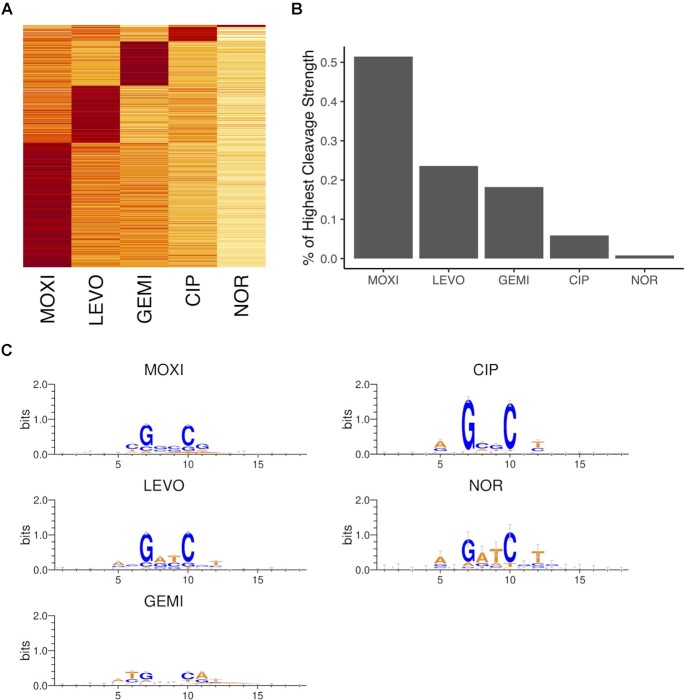
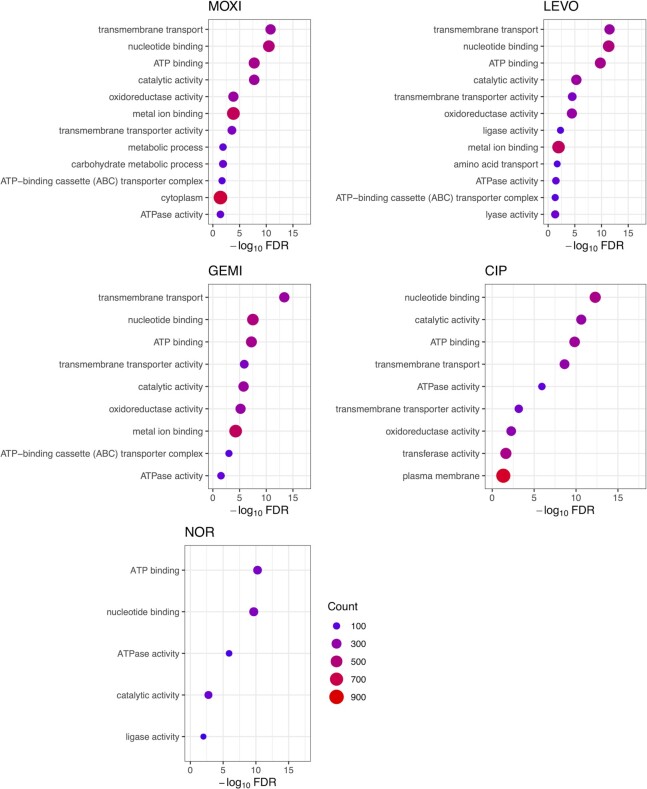
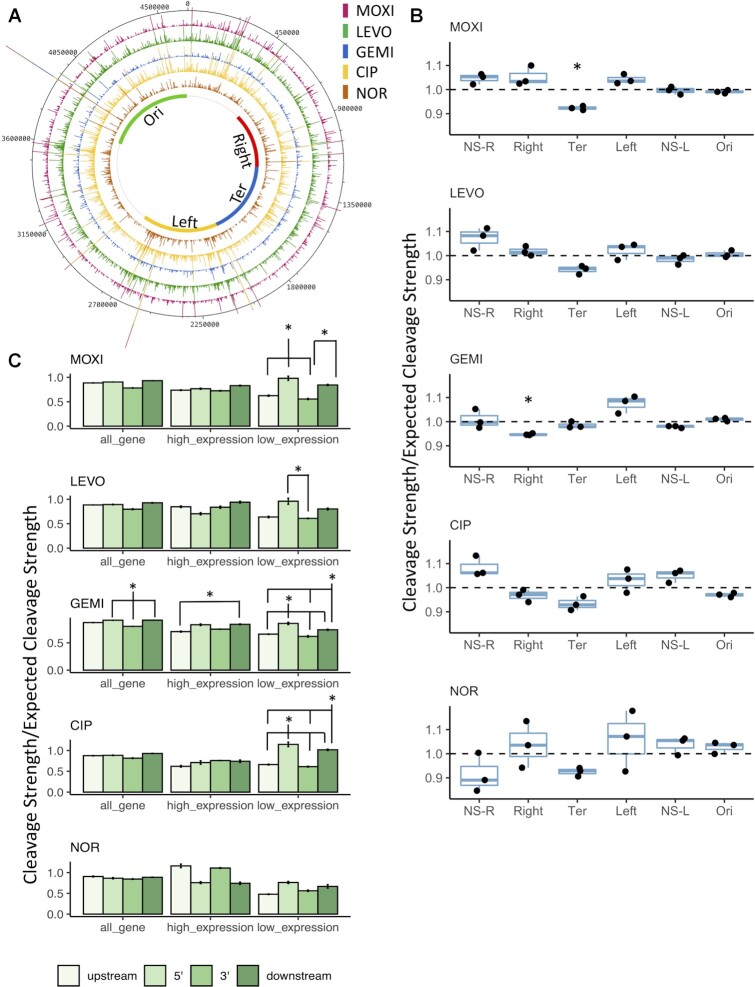
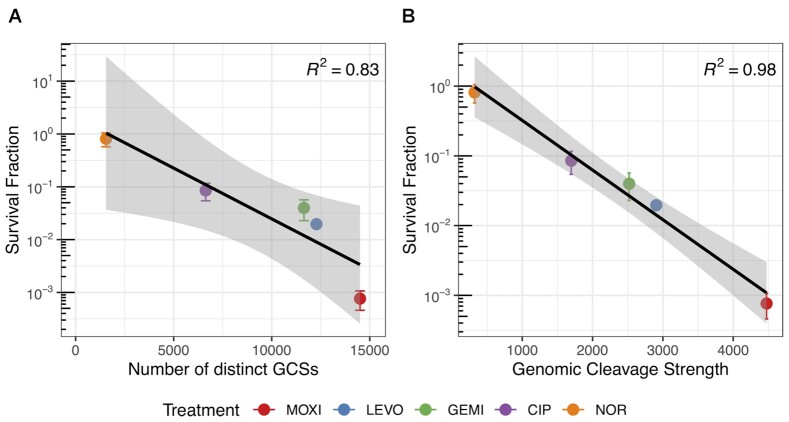
Bacterial persisters are rare phenotypic variants that are suspected to be culprits of recurrent infections. Fluoroquinolones (FQs) are a class of antibiotics that facilitate bacterial killing by stabilizing bacterial type II topoisomerases when they are in a complex with cleaved DNA. In Escherichia coli, DNA gyrase is the primary FQ target, and previous work has demonstrated that persisters are not spared from FQ-induced DNA damage. Since DNA gyrase cleavage sites (GCSs) largely govern the sites of DNA damage from FQ treatment, we hypothesized that GCS characteristics (e.g. number, strength, location) may influence persistence. To test this hypothesis, we measured genome-wide GCS distributions after treatment with a panel of FQs in stationary-phase cultures. We found drug-specific effects on the GCS distribution and discovered a strong negative correlation between the genomic cleavage strength and FQ persister levels. Further experiments and analyses suggested that persistence was unlikely to be governed by cleavage to individual sites, but rather survival was a function of the genomic GCS distribution. Together, these findings demonstrate FQ-specific differences in GCS distribution that correlate with persister levels and suggest that FQs that better stabilize DNA gyrase in cleaved complexes with DNA will lead to lower levels of persistence.


Figures

Figure 1.
Figure 1.
GCS-seq validation in starving cells. FLAG-tagged strains and the FLAG-less controls were immunoprecipitated using anti-FLAG M2 gel following FQ treatment as described in Materials and Methods. (A) Chromatin immunoprecipitated solutions were loaded for SDS-PAGE and three individual bands shown on the gel (indicated as 1, 2, 3) were excised for mass spectrometry analysis. Left: Strain Mu_origin 1_gyrA-FLAG. Right: Strain Mu_origin1_gyrA-FLAGless. Band 1 showed an overrepresentation of the target protein, GyrA. (B) Fold enrichment of chromatin immunoprecipitated samples at Mu, mobA and nuoN sites were measured by qPCR (n = 3) and normalized by the trkH site. Statistical analysis was performed by comparing between FLAG-tagged strains and the FLAG-less control strains at each site. Data are presented as mean of enrichment ± SEM. Asterisk (formula image denotes statistical significance (P < 0.05, using two-tailed t-tests with unequal variances). (C) Visualization of the coverage depths at Mu, mobA, nuoN and trkH sites. Local sequences (Reference: Mu-origin 1 strain) are indicated below the coverage track. Arrows indicate cleavage positions. GCSs show a characteristic 4-bp trough. Green bars represent the selected regions where we performed qPCR as shown in (B).
Figure 2.
Figure 2.
GCS-seq identified distinctive GCS distribution for FQs. (A) Distinct number of GCSs found for MOXI, LEVO, GEMI, CIP, NOR-treated samples. (B) Venn diagram of GCSs in different FQ-treated samples. A total of 23277 potential GCSs were identified from GCS-seq. (C) Dendrogram and unsupervised hierarchical clustering of the cleavage strengths of all potential GCSs identified from MOXI, LEVO, GEMI, CIP, and NOR treatment (n = 3). Due to high numbers of low cleavage strength values, we used quantile break color scheme to ensure each color represents an equal proportion of the data for visualization purpose. Data were clustered using complete linkage. (D) Sequence logo representation of the central 18 nucleotides surrounding GCSs.
Figure 3.
Figure 3.
Sites preferentially cleaved by different FQs. (A) Heatmap representation of mean GCS cleavage strengths (n = 3) of union of all potential GCSs identified from MOXI, LEVO, GEMI, CIP, and NOR treatment. GCSs were sorted and ranked according to their cleavage strengths (including pseudo cleavage strengths). Rows represent genomic location of GCSs and columns represent FQ treatment. Row scaling was applied to compare across FQ treatments. (B) Percentage of GCSs with top cleavage strength for specific FQs. (C) GCSs with the highest cleavage strengths for specific FQs (MOXI, LEVO, GEMI, CIP and NOR) were used for motif construction. Data show sequence logo representation of the central 18 nucleotides surrounding GCSs.
Figure 4.
Figure 4.
Analysis of GO terms for GCSs of different FQs. GO term (molecular function, cellular component, biological process) enrichment analysis was performed on all GCSs identified within genes following different FQ treatments. Dot size and color represent the number of genes with GCSs associated with GO terms displayed on the y axis. GO term categories are sorted based on false discovery rate (FDR). An FDR of 0.05 was used as significance threshold.
Figure 5.
Figure 5.
GCSs distributed across the chromosome do not show Ori-Ter gradient nor enrichment downstream of highly transcribed genes. (A) Genome atlas representation of GCSs location distribution and cleavage strengths. Inner circle depicts the macrodomain (MD) boundaries (Supplementary Table S3). (B) Gyrase cleavage strengths within each MD were summed and normalized with respect to the length of the MD following MOXI, LEVO, GEMI, CIP, and NOR treatment. A value of 1.0 indicates that the cleavage strength equals the expected value. Data are presented as box plots showing the individual normalized cleavage strength (formula image). Statistical analysis was performed using one-sample t-test comparing to value of 1. Asterisk (formula image denotes statistical significance (adjusted P < 0.05). (C) Bar plot representation of the normalized gyrase cleavage strength in upstream, 5′, 3′ and downstream of all genes, genes with high expression, and genes with low expression following FQ treatments. Statistical analysis was performed using one-way ANOVA assessing the effects of location to cleavage strength (LEVO all genes: F(3,8) = 0.46, P = 0.72; LEVO high expression genes: F(3,8) = 1.39, P = 0.31; LEVO low expression genes: F(3,8) = 4.9, P = 0.03; MOXI all genes: F(3,8) = 1.87, P = 0.21; MOXI high expression genes: F(3,8) = 1.01, P = 0.44; MOXI low expression genes: F(3,8) = 15.1, P < 0.002; GEMI all genes: F(3,8) = 8.76, P = 0.007; GEMI high expression genes: F(3,8) = 0.004, P = 0.44; GEMI low expression genes: F(3,8) = 46.82, P = 2.03e-5; CIP all genes: F(3,8) = 0.34, P = 0.797; CIP high expression genes: F(3,8) = 0.004, P = 0.44; CIP low expression genes: F(3,8) = 16.16, P = 0.0009; NOR all genes: F(3,8) = 0.031, P = 0.992; NOR high expression genes: F(3,8) = 1.387, P = 0.315; NOR low expression genes: F(3,8) = 1.098, P = 0.405) followed by Tukey HSD post hoc test for multiple comparisons. Asterisk (formula image denotes statistical significance (adjusted Pformula image) between indicated regions.
Figure 6.
Figure 6.
Persister survival is negatively correlated with cleavage strength and number of distinct GCSs. Stationary-phase E. coli cultures were treated with MOXI, LEVO, GEMI, CIP, or NOR for 5 h and the survival fractions were measured. Data are presented as mean survival fraction ± SEM (formula image) against (A) the number of distinct GCSs identified for each FQ treatment, or (B) the genomic cleavage strengths for each FQ treatment. Black curve represents the fitted regression line and coefficient of determination (formula image) is indicated in each plot. Shaded bands around the regression line represent 95% confidence interval for the regression estimates.
Figure 7.
Figure 7.
Introduction of strong GCS close to origin or terminus does not impact survival. Wild type E. coli strain MG1655 was modified by insertion with either a confirmed strong gyrase cleavage sequence Mu or a scrambled control sequence MuScr at positions close to the origin (A–C) or terminus (D–F). Cultures with inserted sequences were grown to stationary phase and then treated with either 5 μg/ml MOXI (A and D), LEVO (B and E), or GEMI (C and F). Additional data with CIP and NOR treatment and water treatment controls can be found in Supplementary Figures S14 and S15, respectively. Data denote means ± SEM (formula image). P = 0.05 (two-tailed t-tests with unequal variances) was used as significance threshold and log transformed CFU/ml values were compared between Mu and MuScr strains at each insert location for each time point. Statistical significance was not detected.
Figure 8.
Figure 8.
Removal of a strong GCS within recD does not impact survival. Wild type E. coli strain MG1655 and ΔrecD were grown to stationary phase and treated with MOXI, LEVO, GEMI, CIP or NOR. Data denote means ± SEM (formula image). P = 0.05 (two-tailed t-tests with unequal variances) was used as the significance threshold, comparing log transformed CFU/ml values between MG1655 and ΔrecD for each FQ treatment. Statistical significance was not detected.

Similar articles

Cited by

References

    1. Murray C.J., Ikuta K.S., Sharara F., Swetschinski L., Aguilar G.R., Gray A., Han C., Bisignano C., Rao P., Wool E.et al. .. Global burden of bacterial antimicrobial resistance in 2019: a systematic analysis. Lancet. 2022; 399:629–655. - PMC - PubMed
    1. Balaban N.Q., Helaine S., Lewis K., Ackermann M., Aldridge B., Andersson D.I., Brynildsen M.P., Bumann D., Camilli A., Collins J.J.et al. .. Definitions and guidelines for research on antibiotic persistence. Nat. Rev. Microbiol. 2019; 17:441–448. - PMC - PubMed
    1. Meylan S., Andrews I.W., Collins J.J.. Targeting antibiotic tolerance, pathogen by pathogen. Cell. 2018; 172:1228–1238. - PubMed
    1. Balaban N.Q., Merrin J., Chait R., Kowalik L., Leibler S.. Bacterial persistence as a phenotypic switch. Science. 2004; 305:1622–1625. - PubMed
    1. Allison K.R., Brynildsen M.P., Collins J.J.. Heterogeneous bacterial persisters and engineering approaches to eliminate them. Curr. Opin. Microbiol. 2011; 14:593–598. - PMC - PubMed

Publication types