. 2022 Dec 17;5(1):fcac332.
doi: 10.1093/braincomms/fcac332. eCollection 2023.

Sleep slow-wave oscillations trigger seizures in a genetic epilepsy model of Dravet syndrome

Affiliations

Sleep slow-wave oscillations trigger seizures in a genetic epilepsy model of Dravet syndrome

Mackenzie A Catron et al. Brain Commun. .

Abstract

Sleep is the preferential period when epileptic spike-wave discharges appear in human epileptic patients, including genetic epileptic seizures such as Dravet syndrome with multiple mutations including SCN1A mutation and GABAA receptor γ2 subunit Gabrg2Q390X mutation in patients, which presents more severe epileptic symptoms in female patients than male patients. However, the seizure onset mechanism during sleep still remains unknown. Our previous work has shown that the sleep-like state-dependent homeostatic synaptic potentiation can trigger epileptic spike-wave discharges in one transgenic heterozygous Gabrg2+/Q390X knock-in mouse model.1 Here, using this heterozygous knock-in mouse model, we hypothesized that slow-wave oscillations themselves in vivo could trigger epileptic seizures. We found that epileptic spike-wave discharges in heterozygous Gabrg2+/Q390X knock-in mice exhibited preferential incidence during non-rapid eye movement sleep period, accompanied by motor immobility/facial myoclonus/vibrissal twitching and more frequent spike-wave discharge incidence appeared in female heterozygous knock-in mice than male heterozygous knock-in mice. Optogenetically induced slow-wave oscillations in vivo significantly increased epileptic spike-wave discharge incidence in heterozygous Gabrg2+/Q390X knock-in mice with longer duration of non-rapid eye movement sleep or quiet-wakeful states. Furthermore, suppression of slow-wave oscillation-related homeostatic synaptic potentiation by 4-(diethylamino)-benzaldehyde injection (i.p.) greatly attenuated spike-wave discharge incidence in heterozygous knock-in mice, suggesting that slow-wave oscillations in vivo did trigger seizure activity in heterozygous knock-in mice. Meanwhile, sleep spindle generation in wild-type littermates and heterozygous Gabrg2+/Q390X knock-in mice involved the slow-wave oscillation-related homeostatic synaptic potentiation that also contributed to epileptic spike-wave discharge generation in heterozygous Gabrg2+/Q390X knock-in mice. In addition, EEG spectral power of delta frequency (0.1-4 Hz) during non-rapid eye movement sleep was significantly larger in female heterozygous Gabrg2+/Q390X knock-in mice than that in male heterozygous Gabrg2+/Q390X knock-in mice, which likely contributes to the gender difference in seizure incidence during non-rapid eye movement sleep/quiet-wake states of human patients. Overall, all these results indicate that slow-wave oscillations in vivo trigger the seizure onset in heterozygous Gabrg2+/Q390X knock-in mice, preferentially during non-rapid eye movement sleep period and likely generate the sex difference in seizure incidence between male and female heterozygous Gabrg2+/Q390X knock-in mice.

Keywords: Dravet syndrome; genetic epilepsy; sleep; slow-wave oscillations; spike–wave discharges.


Figures

Graphical abstract
Graphical abstract
Figure 1
Figure 1
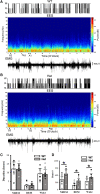
NREM/REM sleep/wake states, power spectrograms of EEG activity and simultaneous EMG from mouse polysomnography for one wt littermate and one het Gabrg2+/Q390X KI. Top panels in A/B show sleep NREM (N)/REM (R) and wake (w) states in one wt littermate and one het Gabrg2+/Q390X KI mouse from 7:00am to 7:00pm (12 h shown, from continuous 24 h recordings). Middle panels in A/B show the multi-tape power spectrograms of continuous EEG activity of the wt littermate and het KI mouse. Original EEG/EMG for wake, REM, and NREM sleep episodes (each 30 s long) are indicated as A1/B1, A2/B2 (very short), and A3/B3 here and are shown in Fig. 2A/B. Lower panels in A/B show simultaneous EMG activity for these EEG recordings to show mouse motor activity. Scale bars are indicated as labelled. Panels C shows summary duration data for NREM/REM sleep and wake period (continuous 24 h recordings) for wt n = 9 (male 1, female 8) and het n = 12 (male 6, female 6) mice. Panels D shows summary data of sleep NREM/REM and wake bouts. * indicates t-test significance with P < 0.05 by using t-test between wt and het KI (wt 9, male 1, female 8 and het 12, male 6, female 6) mice.
Figure 2
Figure 2
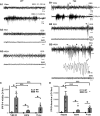
Epileptic SWD incidence prefers NREM sleep period to REM sleep and wakeful state in het Gabrg2+/Q390X KI mice. Panels A/B show representative EEG/EMG traces (30 s) for wake and REM/NREM sleep periods whose power spectrograms are indicated in Fig. 1A/B in one wt littermate and one het KI mouse. In panel B, SWDs are indicated by arrowheads and one SWD is expanded with a smaller temporal scale in panel B3. All scale bars are labelled as indicated. Panels C/D show summary data for SWD incidence and duration during NREM/REM sleep and wake periods (continuous 24 hrs recordings) for wt n = 9 (male 1, female 8) and het n = 12 (male 6, female 6) mice. * indicates significance with P < 0.05 by using t-test between wt and het in NREM or REM or wake groups and &&& one-way ANOVA significance with P < 0.05 between NREM, REM and wake groups in het mice (also see result section).
Figure 3
Figure 3
Female het Gabrg2+/Q390X KI mice exhibit more seizure incidence than male het Gabrg2+/Q390X KI mice. Panels A/B show summary SWD incidence and duration data from male (M, blank) and female (F, filled) het Gabrg2+/Q390X KI mice, with male and female het KI mice (n = 13 each). * indicates t-test significance with P < 0.05.
Figure 4
Figure 4
Optogenetically induced SWOs in vivo increase NREM sleep duration and trigger more epileptic SWDs in het Gabrg2+/Q390X KI mice. Panels A/B show representative pre-SWO and post-SWO EEG/EMG traces (30 s) in one wt littermate. Panels C/D show representative pre-SWO and post-SWO EEG/EMG traces (30 s) in one het KI mouse. Inset is one representative SWO in vivo (2 s episode, total 10 min) with optogenetic activation of NpHR channels. SWDs are indicated as arrowheads and one SWD is expanded with a smaller temporal scale in panel D. All scale bars are labelled as indicated. Panels E/F show summary duration data of pre-SWO and post-SWO NREM/REM/wake period from wt littermates (n = 12, male 6, female 6) and het KI (n = 14, male 7, female 7) mice (total NREM/REM/wake duration are converted as 100% for prior SWO or post-SWO period). Panels G/H show summary SWD incidence data for wt littermates (n = 14, male 7, female 7) and het KI mice (n = 14, male 7, female 7). * indicates paired t-test significance with P < 0.05 between pre-SWO and post-SWO.
Figure 5
Figure 5
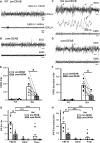
Suppression of SWO-induced homeostatic synaptic potentiation by DEAB decreases epileptic SWD incidence in het Gabrg2+/Q390X KI mice. Panels A/B show representative pre-DEAB and post-DEAB EEG/EMG traces (30 s) in one wt littermate. Panels C/D show representative pre-DEAB and post-DEAB EEG/EMG traces (30 s) in one het KI mouse. SWDs are indicated as arrowheads, and one SWD is expanded with a smaller temporal scale in panel C. All scale bars are labelled as indicated. Panels E/F show summary SWD incidence and duration data for wt littermates (n = 7, male 5, female 2) and het KI mice (n = 9, male 2, female 7). Panels G/H show summary pre-DEAB and post-DEAB SWD incidence and duration data from het KI mice during NREM/REM/wake period. * indicates paired t-test significance with P < 0.05 between pre-DEAB and post-DEAB in panels E–H (also see result section). One-way ANOVA was tested for pre-DEAB (not shown) or post-DEAB (shown) NREM, REM and wake period for panels G and H, with significance &&& P < 0.00001.
Figure 6
Figure 6
Sleep spindles in wt littermates and het Gabrg2+/Q390X KI mice following SWO induction in vivo or DEAB injection i.p. Panels A/B show representative pre-DEAB original simultaneous EEG/EMG traces (30 s long) during NREM sleep period and sleep spindles (10–15 Hz) detected (arrowheads in the middle panels) for one wt littermate (A) and one het KI mouse (B). Individual spindle events below are expanded in smaller temporal scales. Panels C/D show summary data for sleep spindles following SWO induction in vivo (panel C, wt n = 14, male 7, female 7; het n = 15, male 7, female 8 mice) or DEAB injection (panel D, wt n = 7, male 5, female 2; het n = 8, male 2, female 6 mice). All scale bars are labelled as indicated. * indicates paired t-test significance with P < 0.05.
Figure 7
Figure 7
Female het Gabrg2+/Q390X KI mice exhibit larger delta-frequency power during NREM sleep than male het Gabrg2+/Q390X KI mice and the diagram for seizure onset in het Gabrg2+/Q390X KI mice. Panels A shows summary data of the power of delta-frequency (0.1–4 Hz) EEG activity during NREM sleep period for male (M, blank) and female (F, filled) het KI mice (n = 13 each). * indicates t-test significance with P < 0.05. Panels B shows the mechanism/pathway diagram in the study. All scale bars are labelled as with the same scale indicated. The black arrows in the diagram indicate the sequential pathways for epileptic SWD onset. The Laser-NpHR arrow indicates the laser-activated NpHR to generate SWOs in vivo, and the DEAB arrow with a vertical bar indicates the DEAB suppression of homeostatic synaptic plasticity in vivo.

Comment in

References

    1. Zhang CQ, Catron MA, Ding L, et al. Impaired state-dependent potentiation of GABAergic synaptic currents triggers seizures in a genetic generalized epilepsy model. Cereb Cortex. 2021;31:768–784. - PMC - PubMed
    1. Hengen KB, Torrado Pacheco A, McGregor JN, Van Hooser SD, Turrigiano GG. Neuronal firing rate homeostasis is inhibited by sleep and promoted by wake. Cell. 2016;165:180–191. - PMC - PubMed
    1. Torrado Pacheco A, Bottorff J, Gao Y, Turrigiano GG. Sleep promotes downward firing rate homeostasis. Neuron. 2021;109:530–544.e6. - PMC - PubMed
    1. Watson BO, Levenstein D, Greene JP, Gelinas JN, Buzsaki G. Network homeostasis and state dynamics of neocortical sleep. Neuron. 2016;90:839–852. - PMC - PubMed
    1. Levenstein D, Watson BO, Rinzel J, Buzsaki G. Sleep regulation of the distribution of cortical firing rates. Curr Opin Neurobiol. 2017;44:34–42. - PMC - PubMed

LinkOut - more resources