. 2023 Jan 1;13(2):510-530.
doi: 10.7150/thno.80066. eCollection 2023.

Multiple mitochondria-targeted components screened from Sini decoction improved cardiac energetics and mitochondrial dysfunction to attenuate doxorubicin-induced cardiomyopathy

Affiliations

Multiple mitochondria-targeted components screened from Sini decoction improved cardiac energetics and mitochondrial dysfunction to attenuate doxorubicin-induced cardiomyopathy

Xin Ding et al. Theranostics. .

Abstract

Rationale: Sini decoction (SND) is an efficient formula against DOX-induced cardiomyopathy (DCM), but the active ingredient combination (AIC) and mechanisms of SND remain unclear. Therefore, the present study aimed to identify the AIC and elucidate the underlying mechanism of AIC on DCM. Methods: The AIC were screened by a novel comprehensive two-dimensional cardiac mitochondrial membrane chromatography (CMMC)-TOFMS analysis system and further validated by cell viability, reactive oxygen species (ROS) generation, ATP level, and mitochondrial membrane potential in DOX-induced H9c2 cell injury model. Then, an integrated model of cardiac mitochondrial metabolomics and proteomics were applied to clarify the underlying mechanism in vitro. Results: The CMMC column lifespan was significantly improved to more than 10 days. Songorine (S), neoline, talatizamine, 8-gingerol (G) and isoliquiritigenin (I), exhibiting stronger retention on the first-dimension CMMC column, were screened to have protective effects against DOX cardiotoxicity in the H9c2 cell model. S, G and I were selected as an AIC from SND according to the bioactivity evaluation and the compatibility theory of SND. The combined in vitro use of S, G and I produced more profound therapeutic effects than any component used individually on increasing ATP levels and mitochondrial membrane potential and suppressing intracellular ROS production. Moreover, SGI attenuated DCM might via regulating mitochondrial energy metabolism and mitochondrial dysfunction. Conclusions: The provided scientific evidence to support that SGI combination from SND could be used as a prebiotic agent for DCM. Importantly, the proposed two-dimensional CMMC-TOFMS analytical system provides a high-throughput screening strategy for mitochondria-targeted compounds from natural products, which could be applied to other subcellular organelle models for drug discovery.

Keywords: Cardiac mitochondria; Doxorubicin; Multiomics; Sini decoction; Two-dimensional biochromatography.


Conflict of interest statement

Competing Interests: The authors have declared that no competing interest exists.

Figures

Figure 1
Figure 1
Synthesis process of covalent modified cardiac mitochondrial membrane stationary phase (A) and brief scheme of 2D CMMC/C18-TOFMS analytical system (B).
Figure 2
Figure 2
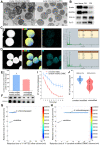
The purity assessment of purified mitochondria, and HRTEM image, protein content and blotting, selectivity, lifespan, and reproducibility of mitochondria membrane-coated APTES-silica stationary phase. (A) TEM showing typical mitochondrial morphology (20,500×). (B) Western blot analyses of subcellular marker proteins. (C and D) HRTEM image, corresponding EDX elemental mapping of phosphorus and energy spectrum of APTES-modified silica microparticles (C) and mitochondria membrane-coated APTES-silica microparticles (D). (E) Content of mitochondria membrane protein (μg) on 40 mg APTES-modified and unmodified silica. Data are expressed as means ± SD, n=3; *p<0.05, vs. unmodified group. (F) Western blotting of TSPO and COX IV proteins in mitochondria membrane-coated stationary phase. (G and H) Typical 2D contour plots of 4'-chlorodiazepam and ranitidine obtained by APTES silica column TOFMS system (G) and covalent modified CMMC column TOFMS system (H). (I) Retention time (RT) of 4'-chlorodiazepam on covalent modified and unmodified CMMC columns (n = 3). (J) The reproducibility (RSD) of RT of 4'-chlorodiazepam from unmodified and covalent modified CMMC column for the first 3 days.
Figure 3
Figure 3
2D contour plots of SND (A) and five mixed standard solution including S (5), neoline (7), talatizamine (8), I (12) and G (22) (B) obtained by the 2D covalent modified CMMC/C18 column-TOFMS system.
Figure 4
Figure 4
Effect of six weakly retained components, five strongly retained components and SGI combination on DOX-induced cell death, ROS generation and ATP level in H9c2 cells. (A) Cell viability (%) on exposure with various concentrations of six weakly retained and five strongly retained components in DOX-induced cell death model. (B and C) Cell viability (%) on exposure with various concentrations of SGI combination (B) and the comparison results between respective component and SGI combination (C). (D) ROS fluorescence images of SGI combination and respective component-treated groups (scale bar = 100 μm, 100 ×). (E) The ratio of ROS fluorescence intensity. (F) Intracellular ATP levels were regulated by SGI combination and respective component. ##p < 0.01, ###p < 0.001, compared with the control group; * p < 0.05, **p < 0.01, *** p <0.001, compared with the DOX group. Data are mean ± SD, n=5.
Figure 5
Figure 5
Effect of and SGI combination and respective component on dissipation of ΔΨm in H9c2 cells and effect of SGI combination on DOX's antineoplastic activity. (A) The fluorescence images of SGI combination and respective component-treated groups (scale bar = 100 μm, 100 ×). Red fluorescence represents the mitochondrial aggregate form of JC-1, indicating intact mitochondrial membrane potential. Green fluorescence represents the monomeric form of JC-1, indicating dissipation of ΔΨm. (B) Ratio of red fluorescence to green fluorescence. (C) Effect of SGI combination on DOX's antineoplastic activity. HepG2 and K562 cell viabilities after DOX treatment for 24 h with or without pre-treatment of different concentrations of SGI. ### p < 0.001, compared with the control group; * p < 0.05, ** p < 0.01, *** p < 0.001, compared with the DOX group. Data are mean ± SD, n = 5.
Figure 6
Figure 6
SGI combination alleviated DCM in vivo. (A) Representative two-dimensional M-mode images in each group. (B) Summary echocardiogram data of ejection fraction (EF%) and fractional shortening (FS%). (C) Contents of serum CK, CK-MB, and LDH in each group. (D) Representative images of H&E staining (scale bar = 50 μm, 200 ×). (E) Representative images of Masson (scale bar = 50 μm, 200 ×). (F) Collagen volume fraction (%). (G) Representative TEM micrographs of myocardial tissue from each group. Each image represents one individual subject (scale bar = 1 μm, 11500 ×). (H) Quantitative measurements of interfibrillar mitochondrial cristae density using ImageJ (=10 randomly selected images from each sample). ## p < 0.01, ### p < 0.001, compared with the control group; * p < 0.05, ** p < 0.01, *** p < 0.001, compared with the DOX group. Data are mean ± SD, n= 6-20.
Figure 7
Figure 7
Metabolomic analyses of cardiac mitochondria samples from the control, DOX, and SGI-treated groups based on UHPLC-MS. (A) Representative total ion chromatogram (TIC) of the control, DOX and SGI-treated groups in the positive and negative ion modes. (B) PCA score plots of metabolites obtained from the positive and negative ion modes. (C) The heatmaps of the potential biomarkers both of control vs. DOX and SGI vs. DOX groups. The asterisk (*) indicates significant differences between the SGI-treated group and the DOX group. (D) The metabolic pathway enrichment analysis of SGI-reversed metabolites.
Figure 8
Figure 8
Identification, biological function and pathway enrichment analyses of DEPs. (A and B) Volcano plots of DEPs from control vs. DOX (A) and SGI vs. DOX (B). The point (blue) on the left is the protein with a downregulated expression, and the point (red) on the right is the protein with an upregulated expression. Each point in the figure represents a specific protein. (C) A heatmap analysis of 222 DEPs. (D) Chord diagram showing the top 10 enriched WikiPathways. The different colors represent the different categories to which they belong, and the color map represents fold change of proteins (log2FC).
Figure 9
Figure 9
Schematic metabolic network of DCM in cardiac mitochondria and SGI modulation based on mitochondrial metabolomics and proteomics results. Column value in histograms is expressed as mean ± SD. Metabolites or proteins in red and blue represent elevation and inhibition in DOX group, respectively. Metabolites in black means they were not detected in our experiment. CMMC: cardiac mitochondrial membrane chromatography; Cpt1b, carnitine palmitoyltransferase-1B; Cpt2, Carnitine O-palmitoyltransferase 2; CACT, Carnitine-acylcarnitine translocase; Mpc2, Mitochondrial pyruvate carrier 2; Sdha, Succinate dehydrogenase [ubiquinone] flavoprotein subunit; Sdhb, Succinate dehydrogenase [ubiquinone] iron-sulfur subunit; Sdhd, Succinate dehydrogenase [ubiquinone] cytochrome b small subunit, mitochondrial; Mdh, Malate dehydrogenase, mitochondria; Sucla2, Succinate-CoA ligase [ADP-forming] subunit beta, mitochondrial; Idh2, Isocitrate dehydrogenase [NADP], mitochondrial; Ogdh, 2-oxoglutarate dehydrogenase, mitochondrial; Dlat, Dihydrolipoyllysine-residue acetyltransferase component of pyruvate dehydrogenase complex, mitochondrial; Acsl1, Long-chain-fatty-acid-CoA ligase 1; Crat, carnitine acetyltransferase; Hadha, Trifunctional enzyme subunit alpha, mitochondrial.
Figure 10
Figure 10
Western blotting and quantification of Ogdh, Sdha, Cpt1b, Cpt2, and Acsl1 associated with TCA cycle and fatty acid metabolism (A) and Opa1, Mfn1, and Mfn2 associated with mitochondrial dynamics (B), and (C) Chord plot representation of DEPs. COX IV was used as an internal control. For relative quantitation of the protein levels, band intensities were converted to arbitrary densitometric units, normalized to the value of COX IV. * p < 0.05, compared with the control group; # p < 0.05, compared with the DOX group. Data are mean ± SD, n=3. (C) Chord plot representation of DEPs related to mitochondria from 7 enriched pathways generated by GO terms (cellular component). The color map represents fold change of proteins (log2FC).

References

    1. Minotti G, Menna P, Salvatorelli E, Cairo G, Gianni L. Anthracyclines: molecular advances and pharmacologic developments in antitumor activity and cardiotoxicity. Pharmacogn Rev. 2004;56:185–229. - PubMed
    1. Stansfeld A, Radia U, Goggin C, Mahalingam P, Benson C, Napolitano A. et al. Pharmacological strategies to reduce anthracycline-associated cardiotoxicity in cancer patients. Expert Opin Pharmacother. 2022;23:1641–1650. - PubMed
    1. Reichardt P, Tabone MD, Mora J, Morland B, Jones RL. Risk-benefit of dexrazoxane for preventing anthracycline-related cardiotoxicity: re-evaluating the European labeling. Future Oncol. 2018;14:2663–76. - PubMed
    1. Yang X, Liu N, Li X, Yang Y, Wang X, Li L. et al. A review on the effect of Traditional Chinese medicine against anthracycline-induced cardiac toxicity. Front Pharmacol. 2018;9:444. - PMC - PubMed
    1. Zhou Q, Meng P, Zhang Y, Chen P, Wang H, Tan G. The compatibility effects of sini decoction against doxorubicin-induced heart failure in rats revealed by mass spectrometry-based serum metabolite profiling and computational analysis. J Ethnopharmacol. 2020;252:112618. - PubMed

Publication types

MeSH terms