

EEG biomarker candidates for the identification of epilepsy
- PMID: 36632368
- PMCID: PMC9826889
- DOI: 10.1016/j.cnp.2022.11.004
EEG biomarker candidates for the identification of epilepsy
Abstract
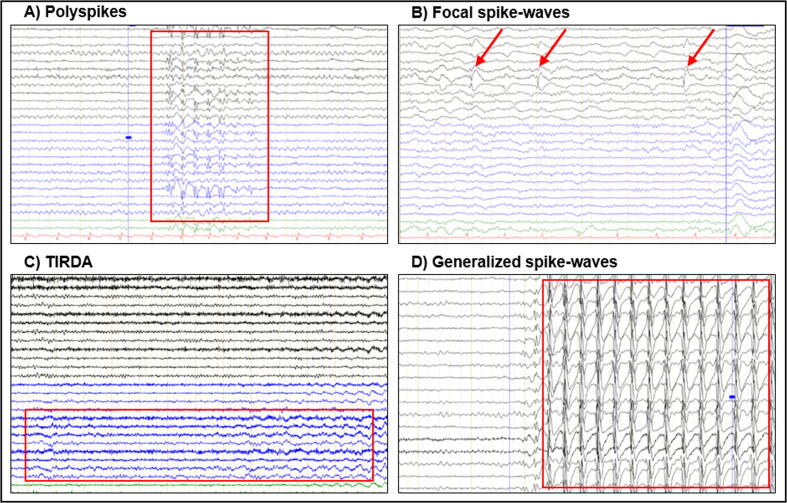
Electroencephalography (EEG) is one of the main pillars used for the diagnosis and study of epilepsy, readily employed after a possible first seizure has occurred. The most established biomarker of epilepsy, in case seizures are not recorded, are interictal epileptiform discharges (IEDs). In clinical practice, however, IEDs are not always present and the EEG may appear completely normal despite an underlying epileptic disorder, often leading to difficulties in the diagnosis of the disease. Thus, finding other biomarkers that reliably predict whether an individual suffers from epilepsy even in the absence of evident epileptic activity would be extremely helpful, since they could allow shortening the period of diagnostic uncertainty and consequently decreasing the risk of seizure. To date only a few EEG features other than IEDs seem to be promising candidates able to distinguish between epilepsy, i.e. > 60 % risk of recurrent seizures, or other (pathological) conditions. The aim of this narrative review is to provide an overview of the EEG-based biomarker candidates for epilepsy and the techniques employed for their identification.
Keywords: Connectivity; EEG biomarkers; Epilepsy; HFOs; IEDs; Microstates.
© 2022 International Federation of Clinical Neurophysiology. Published by Elsevier B.V.
Conflict of interest statement
Margitta Seeck has shares in Epilog©. SG and MS were supported by the Swiss National Science Foundation (180 365, 163398).The authors declare that they have no known competing financial interests or personal relationships that could have appeared to influence the work reported in this paper.
Figures
Similar articles
-
Interictal High Frequency Oscillations Detected with Simultaneous Magnetoencephalography and Electroencephalography as Biomarker of Pediatric Epilepsy.J Vis Exp. 2016 Dec 6;(118):54883. doi: 10.3791/54883. J Vis Exp. 2016. PMID: 28060325 Free PMC article.
-
Therapeutic Strategies in Children with Epilepsy: A Quality-of-Life-Related Perspective.J Clin Med. 2024 Jan 11;13(2):405. doi: 10.3390/jcm13020405. J Clin Med. 2024. PMID: 38256539 Free PMC article. Review.
-
Spike-microstates correlate with interictal epileptogenic discharges: a marker for hidden epileptic activity.Brain Commun. 2023 Apr 18;5(3):fcad124. doi: 10.1093/braincomms/fcad124. eCollection 2023. Brain Commun. 2023. PMID: 37151228 Free PMC article.
-
Different seizure-onset patterns in mesiotemporal lobe epilepsy have a distinct interictal signature.Clin Neurophysiol. 2017 Jul;128(7):1282-1289. doi: 10.1016/j.clinph.2017.04.020. Epub 2017 May 9. Clin Neurophysiol. 2017. PMID: 28549276
-
Interictal epileptiform discharge effects on neuropsychological assessment and epilepsy surgical planning.Epilepsy Behav. 2016 Mar;56:131-8. doi: 10.1016/j.yebeh.2016.01.001. Epub 2016 Feb 12. Epilepsy Behav. 2016. PMID: 26874864 Free PMC article. Review.
Cited by
-
Association of interictal epileptiform discharges and serum concentration of levetiracetam and lamotrigine.Front Neurol. 2025 Jan 24;15:1524637. doi: 10.3389/fneur.2024.1524637. eCollection 2024. Front Neurol. 2025. PMID: 39925638 Free PMC article.
-
Diagnosing Epilepsy with Normal Interictal EEG Using Dynamic Network Models.Ann Neurol. 2025 May;97(5):907-918. doi: 10.1002/ana.27168. Epub 2025 Jan 16. Ann Neurol. 2025. PMID: 39817338 Free PMC article.
-
Recent applications of EEG-based brain-computer-interface in the medical field.Mil Med Res. 2025 Mar 24;12(1):14. doi: 10.1186/s40779-025-00598-z. Mil Med Res. 2025. PMID: 40128831 Free PMC article. Review.
-
Computer-assisted analysis of routine EEG to identify hidden biomarkers of epilepsy: A systematic review.Comput Struct Biotechnol J. 2023 Dec 10;24:66-86. doi: 10.1016/j.csbj.2023.12.006. eCollection 2024 Dec. Comput Struct Biotechnol J. 2023. PMID: 38204455 Free PMC article. Review.
-
The value of linear and non-linear quantitative EEG analysis in paediatric epilepsy surgery: a machine learning approach.Sci Rep. 2024 May 13;14(1):10887. doi: 10.1038/s41598-024-60622-5. Sci Rep. 2024. PMID: 38740844 Free PMC article.
References
-
- Angus-Leppan H. First seizures in adults. BMJ (Clinical research ed.) 2014;348(apr15 1):g2470. - PubMed
Publication types
LinkOut - more resources
Full Text Sources
