

Temporal dynamics of charge buildup in cryo-electron microscopy
- PMID: 36632442
- PMCID: PMC9826809
- DOI: 10.1016/j.yjsbx.2022.100081
Temporal dynamics of charge buildup in cryo-electron microscopy
Abstract
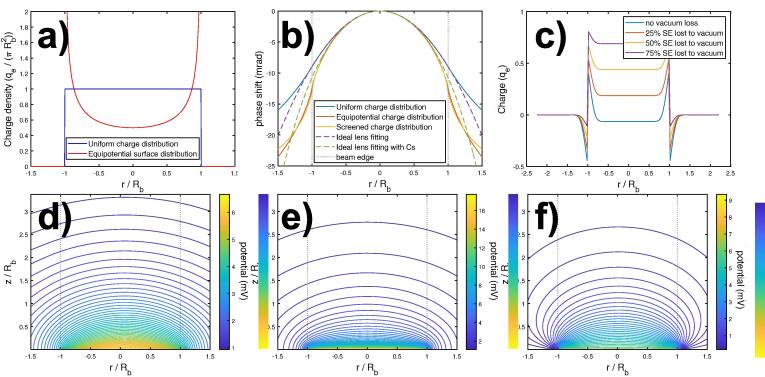
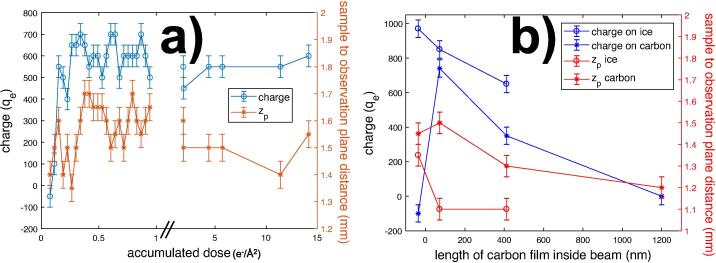
It is well known that insulating samples can accumulate electric charges from exposure to an electron beam. How the accumulation of charge affects imaging parameters and sample stability in transmission electron microscopy is poorly understood. To quantify these effects, it is important to know how the charge is distributed within the sample and how it builds up over time. In the present study, we determine the spatial distribution and temporal dynamics of charge accumulation on vitreous ice samples with embedded proteins through a combination of modeling and Fresnel diffraction experiments. Our data reveal a rapid evolution of the charge state on ice upon initial exposure to the electron beam accompanied by charge gradients at the interfaces between ice and carbon films. We demonstrate that ice film movement and charge state variations occur upon electron beam exposure and are dose-rate dependent. Both affect the image defocus through a combination of sample height changes and lensing effects. Our results may be used as a guide to improve sample preparation, data collection, and data processing for imaging of dose-sensitive samples.
Keywords: Cryo-electron microscopy; Defocused diffraction; Fresnel diffraction; Ice; Specimen charging.
© 2022 The Author(s).
Conflict of interest statement
The authors declare the following financial interests/personal relationships which may be considered as potential competing interests: Matthias Wolf reports financial support was provided by Japan Agency for Medical Research and Development. Makoto T Schreiber reports financial support was provided by Japan Society for the Promotion of Science.
Figures


Similar articles
-
Charging of Vitreous Samples in Cryogenic Electron Microscopy Mitigated by Graphene.ACS Nano. 2023 Aug 22;17(16):15836-15846. doi: 10.1021/acsnano.3c03722. Epub 2023 Aug 2. ACS Nano. 2023. PMID: 37531407 Free PMC article.
-
Electron beam coater for reduction of charging in ice-embedded biological specimens using Ti(88)Si(12) alloy.Microsc Microanal. 2003 Dec;9(6):566-73. doi: 10.1017/S1431927603030435. Microsc Microanal. 2003. PMID: 14750991
-
Paraxial charge compensator for electron cryomicroscopy.Ultramicroscopy. 2012 May;116:106-14. doi: 10.1016/j.ultramic.2012.03.006. Epub 2012 Mar 13. Ultramicroscopy. 2012. PMID: 22564508
-
Toward Compositional Contrast by Cryo-STEM.Acc Chem Res. 2021 Oct 5;54(19):3621-3631. doi: 10.1021/acs.accounts.1c00279. Epub 2021 Sep 7. Acc Chem Res. 2021. PMID: 34491730 Review.
-
Specimen Behavior in the Electron Beam.Methods Enzymol. 2016;579:19-50. doi: 10.1016/bs.mie.2016.04.010. Epub 2016 May 31. Methods Enzymol. 2016. PMID: 27572722 Review.
Cited by
-
Electron Imaging of Nanoscale Charge Distributions Induced by Femtosecond Light Pulses.Nano Lett. 2024 May 15;24(19):5746-5753. doi: 10.1021/acs.nanolett.4c00773. Epub 2024 May 3. Nano Lett. 2024. PMID: 38701367 Free PMC article.
-
The Influence of Ionizing Radiation on Quantification for In Situ and Operando Liquid-Phase Electron Microscopy.Adv Mater. 2025 Apr;37(13):e2415728. doi: 10.1002/adma.202415728. Epub 2025 Feb 21. Adv Mater. 2025. PMID: 39981755 Free PMC article. Review.
-
Reducing the effects of radiation damage in cryo-EM using liquid helium temperatures.Proc Natl Acad Sci U S A. 2025 Apr 29;122(17):e2421538122. doi: 10.1073/pnas.2421538122. Epub 2025 Apr 22. Proc Natl Acad Sci U S A. 2025. PMID: 40261934 Free PMC article.
-
Charging of Vitreous Samples in Cryogenic Electron Microscopy Mitigated by Graphene.ACS Nano. 2023 Aug 22;17(16):15836-15846. doi: 10.1021/acsnano.3c03722. Epub 2023 Aug 2. ACS Nano. 2023. PMID: 37531407 Free PMC article.
References
-
- Berriman J.A., Rosenthal P.B. Paraxial charge compensator for electron cryomicroscopy. Ultramicroscopy. 2012;116:106–114. - PubMed
-
- Brink J., Sherman M.B., Berriman J., Chiu W. Evaluation of charging on macromolecules in electron cryomicroscopy. Ultramicroscopy. 1998;72(1):41–52. - PubMed
-
- Brink J., Gross H., Tittmann P., Sherman M., Chiu W. Reduction of charging in protein electron cryomicroscopy. J. Microsc. 1998;191:67–73. - PubMed
-
- Cazaux J. Springer; 1993. Some physical descriptions of the charging effects in insulators under irradiation.
LinkOut - more resources
Full Text Sources
