. 2022 Dec 16:4:100065.
doi: 10.1016/j.crneur.2022.100065. eCollection 2023.

Characterisation of functional deficits induced by AAV overexpression of alpha-synuclein in rats

Affiliations

Characterisation of functional deficits induced by AAV overexpression of alpha-synuclein in rats

F Gubinelli et al. Curr Res Neurobiol. .

Abstract

Background: In the last decades different preclinical animal models of Parkinson's disease (PD) have been generated, aiming to mimic the progressive neuronal loss of midbrain dopaminergic (DA) cells as well as motor and non-motor impairment. Among all the available models, AAV-based models of human alpha-synuclein (h-aSYN) overexpression are promising tools for investigation of disease progression and therapeutic interventions.

Objectives: The goal with this work was to characterise the impairment in motor and non-motor domains following nigrostriatal overexpression of h-aSYN and correlate the behavioural deficits with histological assessment of associated pathology.

Methods: Intranigral injection of an AAV9 expressing h-aSYN was compared with untreated animals, 6-OHDA and AAV9 expressing either no transgene or GFP. The animals were assessed on a series of simple and complex behavioural tasks probing motor and non-motor domains. Post-mortem neuropathology was analysed using immunohistochemical methods.

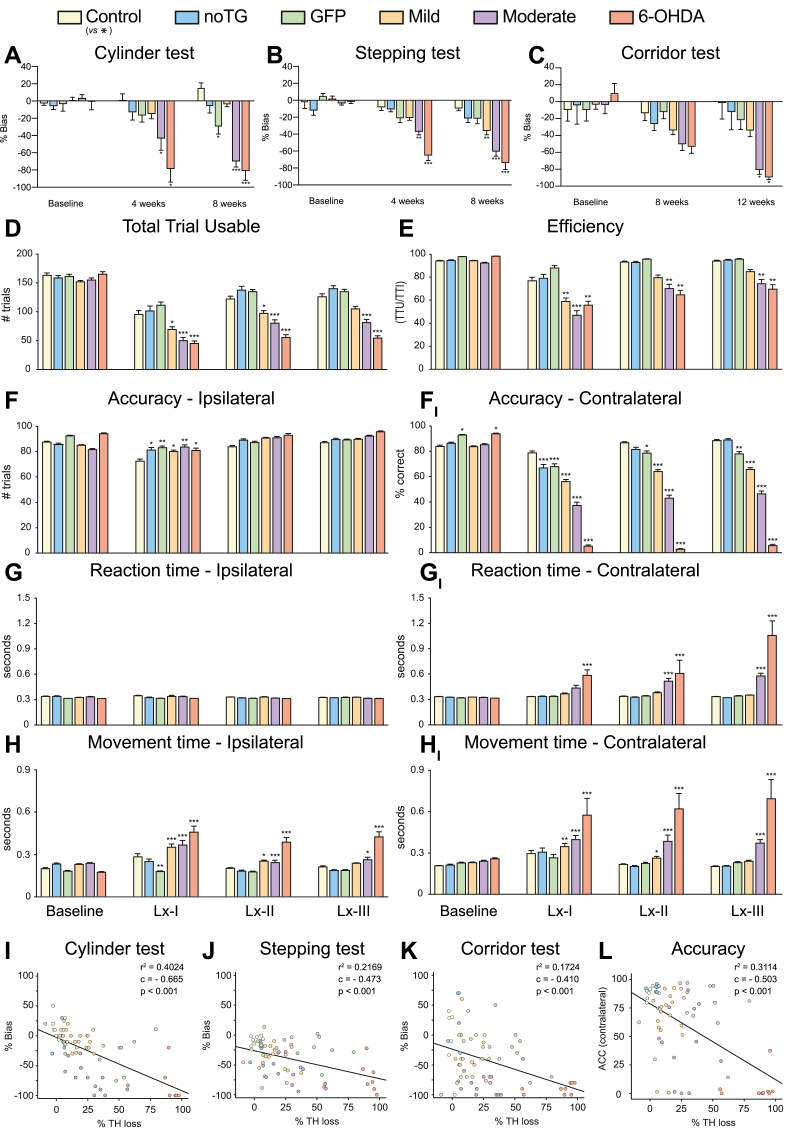
Results: Overexpression of h-aSYN led to progressive degeneration of DA neurons of the SN and axonal terminals in the striatum (STR). We observed extensive nigral and striatal pathology, resembling that of human PD brain, as well as the development of stable progressive deficit in simple motor tasks and in non-motor domains such as deficits in motivation and lateralised neglect.

Conclusions: In the present work we characterized a rat model of PD that closely resembles human PD pathology at the histological and behavioural level. The correlation of cell loss with behavioural performance enables the selection of rats which can be used in neuroprotective or neurorestorative therapies.

Keywords: AAV; Alpha-synuclein; Choice reaction time; Parkinson's disease; Visuo-spatial neglect.


Conflict of interest statement

The authors declare that they have no known competing financial interests or personal relationships that could have appeared to influence the work reported in this paper.

Figures

Image 1
Graphical abstract
Fig. 1
Fig. 1
Experimental outline and lateralised choice reaction time task overview. A: Table of group descriptions and timeline of key experimental timepoints. B: Schematic of AAV vector capsid and transgene cassette displaying the construct used in the current experiment and the injection sites into the rat midbrain. noTG = no transgene, GFP = green fluorescent protein, h-aSYN = human alpha-synuclein, 6-OHDA = 6-hydroxydopamine, pA = polyadenylation, ITR = Inverted Terminals Repeats, CBA = Chicken Beta Actin. C: Schematic of 6-OHDA injection aimed at the medial forebrain bundle. D-F: Schematic representation of the lateralised choice reaction time task. A trial is started with an illumination of the centre hole. The rat is then required to perform a sustained nose-poke into the illuminated hole. After a variable delay a brief (300 ms) visual stimulus is presented randomly to either side of the animals' head. The rat is then required to respond with a nose-poke into the previously illuminated hole in order to obtain a food reward. The time taken from stimulus presentation to withdrawal from the centre hole is indicative of the reaction time whereas the time from withdrawal to execution of the lateralised response is taken as movement time.
Fig. 2
Fig. 2
Evaluation of transgene overexpression. A-C: Representative overviews for the GFP (A), h-aSYN mild (B) and h-aSYN moderate (C) labelled for GFP and aSYN211, respectively. D: Schematic representation of the analysed area for striatal optical density. Red area represents the striatum, while the black square represents the area where microscope picture was acquired. E: Optical Density measurements comparing GFP and aSYN211 labelling intensity between the ipsilateral and contralateral striatum. Data are expressed as mean ± SEM; *** = p < 0.001. F: Schematic representation of the analysed area for midbrain optical density. Red area represents the substantia nigra, while the black square represents the area where microscope picture was acquired. G: Optical Density measurements comparing GFP and aSYN211 labelling intensity between the ipsilateral and contralateral substantia nigra. Data are expressed as mean ± SEM; *** = p < 0.001. H-J: Representative brightfield photomicrographs of striatal sections labelled for GFP (H) and h-aSYN (I–J) respectively for the GFP and h-aSYN mild and moderate groups. K-M: Representative brightfield photomicrographs of midbrain sections labelled for GFP (K) and aSYN211 (L–M) respectively for the GFP and h-aSYN mild and moderate groups. N–NIII: High magnification confocal microscope images of individual neurons in the midbrain of the AAV-GFP injected group demonstrating colocalization between GFP, TH and VMAT2. O-PIII: High magnification confocal microscope images of individual neurons of the h-aSYN moderate group demonstrating a colocalization between h-aSYN, TH and VMAT2 or pSer129.
Fig. 3
Fig. 3
Neuronal loss following AAV delivery at 16 weeks post injection. A-D: Representative overviews of TH immunolabelling for the control group (A), noTG group (B), h-aSYN mild group (C) and h-aSYN moderate group (D). E-J: Representative brightfield photomicrographs of striatal sections labelled for TH for the control (E), noTG (F), GFP (G), h-aSYN mild (H), h-aSYN moderate (I), and 6-OHDA (J) groups. EI-JI: Representative brightfield photomicrographs of midbrain sections labelled for TH for the control (EI), noTG (FI), GFP (GI), h-aSYN mild (HI), h-aSYN moderate (II) and 6-OHDA (JI) groups. K: Optical Density measurements comparing TH labelling intensity between the ipsilateral and contralateral striatum of all experimental groups. Data are expressed as mean ± SEM; * = p < 0.05, *** = p < 0.001. L: Percent TH cell loss quantified via unbiased stereology. Data are expressed as mean ± SEM; *** = p < 0.001. Significance in the figure is only displayed in relation to the control group. M. Percent NeuN cell loss. Data are expressed as mean ± SEM; * = p < 0.05; ** = p < 0.01. Significance in the figure is only displayed in relation to the control group.
Fig. 4
Fig. 4
Simple and complex behavioural assessment. A-C: Cylinder (A) and stepping (B) tests were performed at baseline, 4- and 8- weeks post lesion for all the experimental groups. Corridor (C) test was performed at baseline, 8- and 12-weeks post lesion for all the experimental groups. D: Lateralised choice reaction time task total trial usable (TTU) for the baseline and for the 5-days blocks post-lesion (LX-1, LX-2, and LX-3. E: Lateralised choice reaction time task efficiency (EFF). F-FI: Lateralised choice reaction time task accuracy (ACC) for ipsilateral (F) and contralateral (FI) side. G-GI: Lateralised choice reaction time task reaction time (RT) for stimuli presented at the ipsilateral (G) and contralateral (GI) side. H–HI: Lateralised choice reaction time task movement time (MT) for responses directed to the ipsilateral (H) and contralateral (HI) side. The number of asterisks denotes significant differences at the <0.05, <0.01, and <0.001 levels of significance, respectively to the control group. All data are expressed as mean ± SEM. The full table of statistical cross comparison is provided in Supplementary Tables 2–12 for all behavioural tests. I: Scatterplot displaying the correlation between the loss of TH + cells as quantified by unbiased stereology and cylinder test contralateral bias. J: Scatterplot displaying the correlation between the loss of TH + cells quantified by unbiased stereology and bias on the stepping test. K: Scatterplot displaying the correlation between the loss of TH + cells as quantified by unbiased stereology and bias on the corridor test. L: Scatterplot displaying the correlation between the loss of TH+ cells as quantified by unbiased stereology and contralateral accuracy. The number of asterisks denotes significant differences at the <0.05, <0.01, and <0.001 levels of significance, respectively. Differences from the respective groups are indicated by colour. All data are expressed as mean ± SEM.
Fig. 5
Fig. 5
Striatal axonal pathology following AAV delivery at 16 weeks post injection. A-F: Representative brightfield photomicrographs of PFC axonal swellings in the ipsilateral PFC labelled for TH for the control (A), noTG (B), GFP (C) h-aSYN mild (D), h-aSYN moderate (E) and 6-OHDA (F) groups. G-L: Representative brightfield photomicrographs of striatal axonal swellings in the ipsilateral STR labelled for TH for the control (G), noTG (H), GFP (I) h-aSYN mild (J), h-aSYN moderate (K) and 6-OHDA (L) groups. M-N: Representative brightfield photomicrographs of PFC axonal swellings in the ipsilateral PFC labelled for aSYN211 for the h-aSYN mild (M) and h-aSYN moderate (N) groups. O–P: Representative brightfield photomicrographs of STR axonal swellings in the ipsilateral STR labelled for aSYN211 for the h-aSYN mild (o) and h-aSYN moderate (p) groups. O–P: Schematic representation of the analysed area for the PFC (Q) and STR (R). Black squares indicate the areas where image acquisition was performed. S: Quantification of TH+ swellings in the ipsilateral PFC for all the experimental groups. Data are presented as mean ± SEM. T: Quantification of TH+ swellings in the ipsilateral STR for all the experimental groups. Data are presented as mean ± SEM; ** = p < 0.01; *** = p < 0.001. Significance is expressed in relation to the control group. U: Ratio between number of TH+ STR swellings and remaining TH+ DA nigral neurons. Data are presented as mean ± SEM; * = p < 0.05; *** = p < 0.001. Significance is expressed in relation to the control group. V: Quantification of aSYN211+ swellings in the ipsilateral and contralateral PFC for the h-aSYN mild and h-aSYN moderate groups. Data are presented as mean ± SEM; * = p < 0.05; ** = p < 0.01. W: Quantification of aSYN211+ swellings in the ipsilateral and contralateral STR for the h-aSYN mild and h-aSYN moderate groups. Data are presented as mean ± SEM; *** = p < 0.001. X: Ratio between number of aSYN211+ STR swellings and remaining TH + DA nigral neurons. Data are presented as mean ± SEM.
Fig. 6
Fig. 6
Axonal and nigral pathology following AAV delivery at 16 weeks post injection. A-BIII: Representative high magnification confocal images of the h-aSYN moderate ipsilateral striatal swellings presenting with beaded morphology labelled for TH (A, B) VMAT2 (AI) or aSYN211 (BI) and pSer129 (AII, BII). C-D: High magnification images of midbrain cellular pathology and protein accumulation revealed by aSYN211 immunoreactivity without (C) or with pK treatment (D). E-F: High magnification images of midbrain cellular pathology and protein accumulation revealed by pSer129 (E) and TH (F) immunoreactivity. G-GIII: Representative triple fluorescent labelling of DAPI (G), ThioS (GI) and pSer129 (GII) displaying co-localization of phosphorylated aSYN with protein aggregates known to be present in human LBs.

References

    1. Acheson A.L., Zigmond M.J. Short and long term changes in tyrosine hydroxylase activity in rat brain after subtotal destruction of central noradrenergic neurons. J. Neurosci. 1981;1:493–504. - PMC - PubMed
    1. Alarcon-Aris D., Pavia-Collado R., Miquel-Rio L., Coppola-Segovia V., Ferres-Coy A., Ruiz-Bronchal E., Galofre M., Paz V., Campa L., Revilla R., Montefeltro A., Kordower J.H., Vila M., Artigas F., Bortolozzi A. Anti-alpha-synuclein ASO delivered to monoamine neurons prevents alpha-synuclein accumulation in a Parkinson's disease-like mouse model and in monkeys. EBioMedicine. 2020;59 - PMC - PubMed
    1. Albert K., Voutilainen M.H., Domanskyi A., Airavaara M. AAV vector-mediated gene delivery to substantia nigra dopamine neurons: implications for gene therapy and disease models. Genes (Basel) 2017;8 - PMC - PubMed
    1. Albert K., Voutilainen M.H., Domanskyi A., Piepponen T.P., Ahola S., Tuominen R.K., Richie C., Harvey B.K., Airavaara M. Downregulation of tyrosine hydroxylase phenotype after AAV injection above substantia nigra: caution in experimental models of Parkinson's disease. J. Neurosci. Res. 2019;97:346–361. - PMC - PubMed
    1. Aldrin-Kirk P., Davidsson M., Holmqvist S., Li J.Y., Bjorklund T. Novel AAV-based rat model of forebrain synucleinopathy shows extensive pathologies and progressive loss of cholinergic interneurons. PLoS One. 2014;9 - PMC - PubMed

LinkOut - more resources