. 2023 Jan 1;136(1):jcs260563.
doi: 10.1242/jcs.260563. Epub 2023 Jan 12.

Nucleophagy contributes to genome stability through degradation of type II topoisomerases A and B and nucleolar components

Affiliations

Nucleophagy contributes to genome stability through degradation of type II topoisomerases A and B and nucleolar components

Gabriel Muciño-Hernández et al. J Cell Sci. .

Abstract

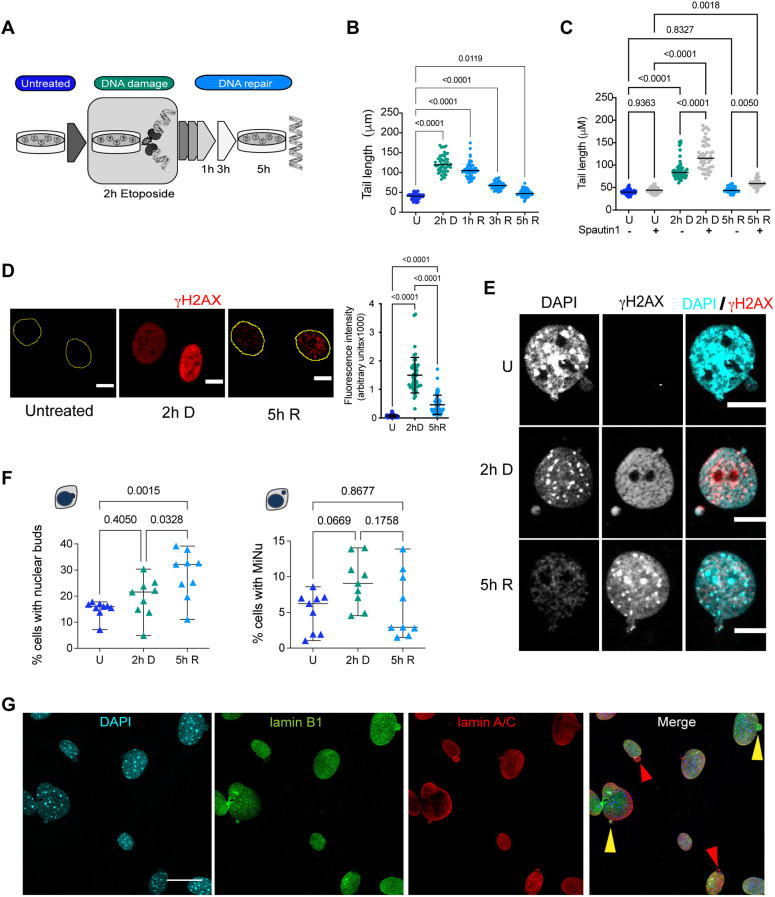
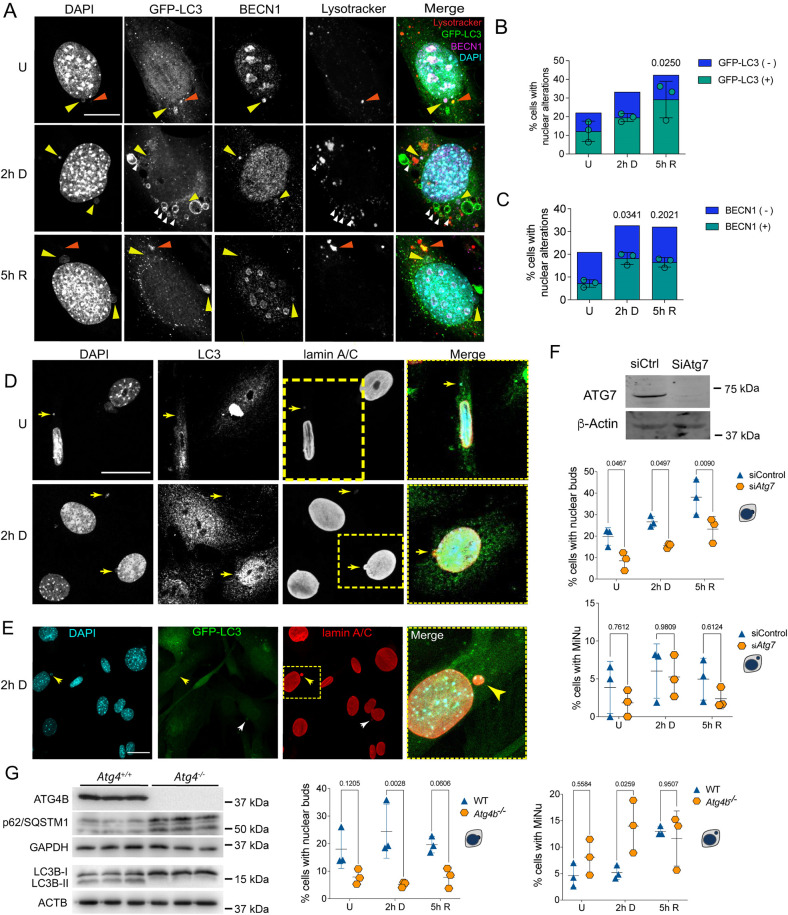
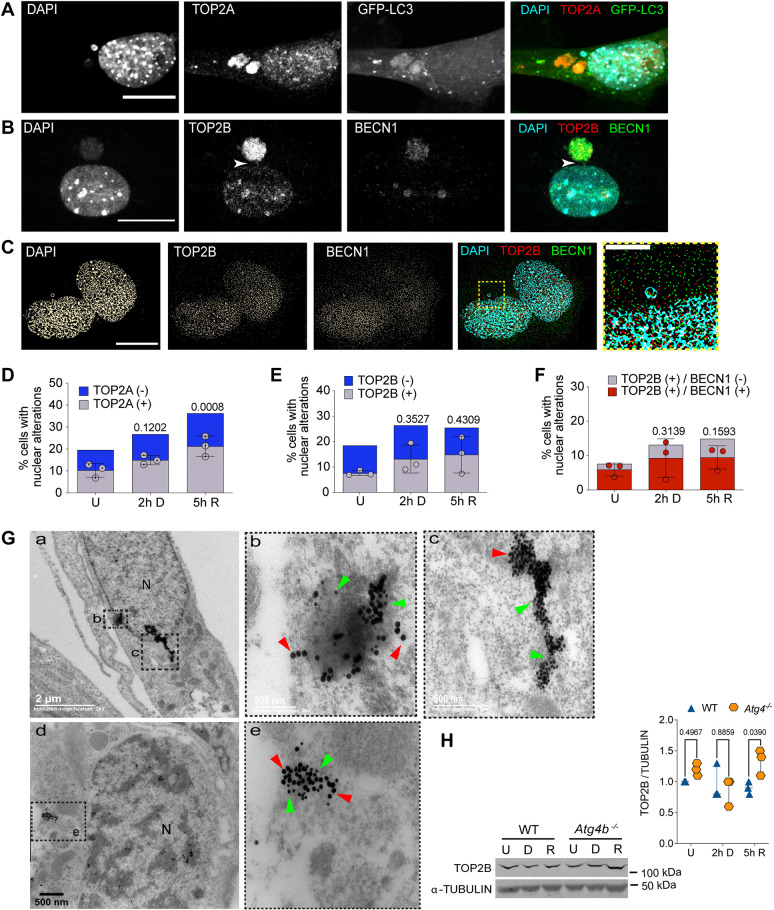
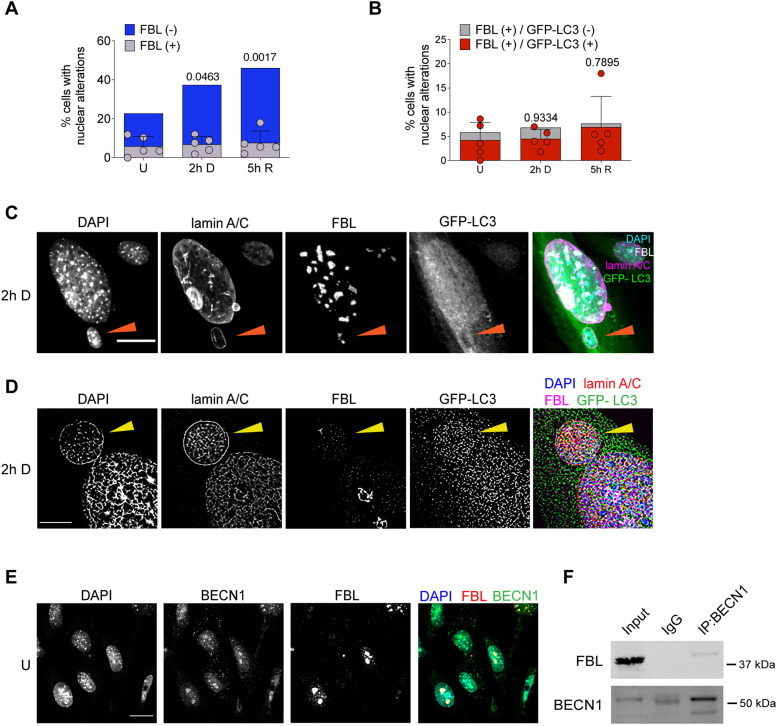
The nuclear architecture of mammalian cells can be altered as a consequence of anomalous accumulation of nuclear proteins or genomic alterations. Most of the knowledge about nuclear dynamics comes from studies on cancerous cells. How normal healthy cells maintain genome stability, avoiding accumulation of nuclear damaged material, is less understood. Here, we describe that primary mouse embryonic fibroblasts develop a basal level of nuclear buds and micronuclei, which increase after etoposide-induced DNA double-stranded breaks. Both basal and induced nuclear buds and micronuclei colocalize with the autophagic proteins BECN1 and LC3B (also known as MAP1LC3B) and with acidic vesicles, suggesting their clearance by nucleophagy. Some of the nuclear alterations also contain autophagic proteins and type II DNA topoisomerases (TOP2A and TOP2B), or the nucleolar protein fibrillarin, implying they are also targets of nucleophagy. We propose that basal nucleophagy contributes to genome and nuclear stability, as well as in response to DNA damage.

Keywords: Autophagy; DNA damage; Mammalian nucleophagy; Micronuclei; Nucleolus.


Conflict of interest statement

Competing interests The authors declare no competing or financial interests.

Figures

Fig. 1.
Fig. 1.
There is a basal formation of nuclear buds and micronuclei in primary fibroblasts, which increases with etoposide-mediated induction of DSBs. (A) Workflow for the DNA damage and repair assay. MEFs were exposed to 120 µM etoposide for 2 h to damage DNA (2 h D), then etoposide was removed to allow DNA repair, which was monitored after 1, 3 or 5 h. (B) Quantification of comet tail length (which is proportional to the number of DSBs) in untreated cells (U), after 2 h of etoposide exposure (2 h D), and after 1 h, 3 h or 5 h of etoposide removal (1 h R, 3 h R, 5 h R, respectively). Bars represent median at each time point, statistical significant differences were determined by one-way ANOVA followed by Dunnett's multiple comparison test; adjusted P-value is indicated for each comparison. 50 comets were measured in each of three independent experiments. Detailed data are shown in Table S1. (C) Quantification of comet tail length in untreated cells (U), after 2 h of etoposide exposure (2 h D), and 5 h of etoposide removal (5 h R), previously treated for 12 h with vehicle (−) or 10 µM Spautin1 (+). Bars represent median at each time point, statistical significant differences were determined by one-way ANOVA followed by Dunnett's multiple comparison test; adjusted P-value is indicated for each comparison. 50 comets were measured in each of three independent experiments. Detailed data are shown in Table S1. (D) DDR followed by the recruitment of γH2AX in untreated (U), damaged (2 h D) or repaired (5 h R) DNA. Yellow contours indicate the nuclei of cells. Scale bars: 10 µm. The fluorescence signal was quantified in 48 cells per experiment in three independent experiments and the mean±s.d. is graphed to the right. Statistical significant difference was determined by One-way ANOVA followed by Tukey′s multiple comparison test; adjusted P-value is indicated for each comparison. Detailed data are shown in Table S1. (E) Nuclear buds or independent micronuclei were observed by confocal microscopy in untreated (U), damaged (2 h D) or repaired (5 h R) DNA. DNA damaged marked with γH2AX (red) was found in both buds and micronuclei, mainly when cells were treated with etoposide. DNA was stained with DAPI. Scale bars: 10 µm. (F) Quantification of the percentage of cells with nuclear buds or micronuclei (MiNu) in untreated (U), damaged (2 h D) or repaired (5 h R) DNA. The mean±s.d. of nine independent experiments is graphed. Statistical significant difference was determined by one-way ANOVA followed by Dunnett's multiple comparison test; adjusted P-value is indicated for each comparison. For every experiment (represented as triangles) at least 50 cells were counted; detailed data are shown in Table S1. (G) Representative immunofluorescence images from five independent experiments to detect lamin A/C (red) and lamin B1 (green) in MEFs treated with etoposide for 2 h (2 h D). Yellow arrowheads show examples of buds containing both lamin A/C and lamin B1. Red arrowheads show examples of buds containing only lamin A/C. Scale bar: 30 µm.
Fig. 2.
Fig. 2.
Nuclear buds and micronuclei are associated with components of different stages of the autophagic pathway. (A) Representative images of autophagic proteins GFP–LC3 and BECN1 found in nuclear buds (yellow arrowhead) in MEFs that were untreated (U), treated for 2 h with etoposide (2 h D) or after 5 h of DNA repair (5 h R), as used for quantifications shown in B and C. Some micronuclei were contained in autolysosomes, identified by having DNA (DAPI), GFP–LC3 and Lysotracker® staining (orange arrowheads). GFP–LC3-labeled vesicles next to Lysotracker® staining, or with Lysotracker® staining inside, are shown with white arrowheads. Scale bar: 10 µm. (B,C) Percentage of cells with nuclear alterations (nuclear buds and micronuclei). Among nuclear alterations, those containing GFP–LC3 (B) or BECN1 (C) are shown in green, whereas those without GFP–LC3 or BECN1 are shown in blue. Color bars represent the mean of three independent experiments. Green symbols represent the percentage of cells with nuclear alterations containing GFP–LC3 or BECN1; bars represent mean±s.d. The percentage of cells with nuclear buds or micronuclei are shown independently in Fig. S3. At least 50 cells were counted per treatment and experiment, and significant differences were determined by one-way ANOVA followed by a Kruskal–Wallis test; P-value is indicated in comparison with untreated samples. (D) Representative images of endogenous LC3B localized in micronuclei surrounded by lamin A/C, and containing DNA detected by DAPI staining (yellow arrows) in MEFs untreated (U) or treated for 2 h with etoposide (2 h D). Yellow squares indicate the magnified areas shown to the right. Scale bar: 30 μm. (E) Representative micronuclei surrounded by lamin A/C containing GFP–LC3 (yellow arrows) in MEFs treated for 2 h with etoposide. Yellow dotted square indicates the magnified area shown to the right. Scale bar: 30 µm. Images in D and E are representative of five repeats. (F) Functional autophagy seems to be necessary to form nuclear buds. MEFs were transfected with siRNA control (siCtrl) or siAtg7 for 48 h and then treated or not with etoposide for 2 h and left to repair DNA for 5 h [untreated (U), damaged (2 h D) or repaired (5 h R) DNA]. The western blot shows representative level of Atg7 silencing; β-actin was used as loading control. Whole blots are shown in Fig. S4A. Graphs show the percentage of cells with nuclear buds (top) or micronuclei (MiNu; bottom). For every experiment at least 50 cells were counted by detecting DAPI signal in nuclear alterations in confocal images. The distribution of the data from three independent experiments is graphed (mean±s.d.). Significant differences were obtained by two-way ANOVA analysis, followed by a Sidak's multiple comparison test. Adjusted P-values are indicated for each comparison. (G) Functional autophagy seems to be necessary for micronuclei elimination. WT and Atg4b−/− MEFs were analyzed to evaluate the abundance of nuclear alterations. Western blot demonstrates lack of ATG4B in Atg4b−/− MEFs, accompanied by an accumulation of p62/SQSTM1 protein and absence of LC3B lipidation (lack of LC3B-II), confirming deficient autophagosome formation. The indicated sizes correspond to the molecular mass markers used for each blot. Whole blots are shown in Fig. S4B. Graphs show the percentage of cells with nuclear buds (left) or micronuclei (right). For every experiment at least 140 cells were counted by detecting the DAPI signal in nuclear alterations in confocal images. The distribution of the data from three independent experiments is graphed (mean±s.d.). Significant differences were analyzed by two-way ANOVA following a Sidak's multiple comparison test; P-value is shown for each comparison. Detailed data of every graph are shown in Table S1.
Fig. 3.
Fig. 3.
TOP2cc are targeted for nucleophagic clearance. (A) Representative confocal image after immunofluorescence staining to detect TOP2A in MEFs expressing GFP–LC3, treated with 120 µM etoposide for 2 h. Scale bar: 20 µm. (B) Representative confocal image after immunofluorescence staining to detect TOP2B and BECN1 in MEFs treated with 120 µM etoposide for 2 h. Scale bar: 20 µm. Arrowheads show a bridge contacting both the main nucleus and a micronucleus containing both TOP2B and BECN1 signals. (C) Representative images obtained by super-resolution microscopy to detect colocalization of DNA and TOP2B (TOP2Bcc) with BECN1 in MEFs after 5 h of DNA repair. Yellow square represents the magnified section presented to the right. Scale bar: 15 µm; magnified section, 5 µm. Images in A–C are representative of three repeats. (D) Percentage of untreated (U), DNA damaged (2 h D) or DNA repaired (5 h R) cells with nuclear alterations (nuclear buds and micronuclei) containing DNA and TOP2A (gray bars). Nuclear alterations without TOP2A are shown as blue bars. The mean±s.d. for three independent experiments (counting at least 50 cells per experiment) are graphed. (E,F) Percentage of cells with nuclear alterations (nuclear buds and micronuclei) containing TOP2B (in E) or TOP2B colocalizing with BECN1 (in F) in untreated MEFs or after DNA damage (2 h D, cells treated with 120 µM etoposide for 2 h) or DNA repair phase (5 h R, cells after 5 h of etoposide removal). At least 50 cells were counted for each experiment. The mean±s.d. of three independent experiments is graphed. In D–F, statistical significance was calculated by two-way ANOVA followed by Dunnett's multiple comparison test; adjusted P-values are shown for each comparison. (G) Electron micrographs showing simultaneous detection of LC3B and TOP2B by immunogold labeling. Figures b and c show higher magnification views of the area indicated in a; e shows a higher magnification views of the area indicated in d. Green arrowheads show examples of 15 nm gold particles coupled to secondary antibody to detect TOP2B and red arrowheads point to 25 nm gold particles coupled to secondary antibody to detect LC3B. Images in G are representative of three repeats. (H) Western blot of total extracts from WT or Atg4b−/− MEFs that were untreated (U), treated for 2 h with etoposide (D) or after 5 h of DNA repair (R) to compare the abundance of TOP2B in the presence (WT) or absence of ATG4 (Atg4b−/−). α-Tubulin was detected as a loading control. Whole blots are presented in Fig. S4. Graph shows a densitometric analysis of three independent experiments. Statistical significance was determined by two-way ANOVA followed by Sidak's multiple comparisons test. Adjusted P-values are shown for each comparison.
Fig. 4.
Fig. 4.
The nucleolar protein fibrillarin is found in nuclear buds and micronuclei containing autophagic proteins. (A) Percentage of cells containing nuclear alterations (buds and micronuclei), with (gray bars) or without (blue bars) fibrillarin (FBL) in untreated cells (U), or after etoposide treatment (2 h D) or after 5 h of DNA repair (5 h R). (B) Percentage of cells containing nuclear alterations (buds and micronuclei), with (gray bars) or without (red bars) FBL and GFP–LC3 in untreated cells (U), or after etoposide treatment (2 h D) or after 5 h of DNA repair (5 h R). For A and B, dots represent the mean of each experiment (n=5); at least 50 cells were counted per experiment by analyzing DAPI distribution in confocal images. Bars correspond to s.d. A two-way-ANOVA followed by Dunnett′s multiple comparison test of the total number of nuclear alterations. Adjusted P-values are indicated for each comparison with control cells. Even though there is a trend to increase nuclear alterations containing fibrillarin upon DNA damage, no statistical significant differences were obtained. Detailed data are presented in Table S1. (C) Representative confocal microscopy images showing fibrillarin (FBL) in a micronucleus containing DNA stained with DAPI and surrounded by lamin A/C (arrowhead) and GFP–LC3, in cells treated with etoposide for 2 h. Scale bar: 20 µm. (D) Representative super-resolution microscopy images of the same experiment described in C. Scale bar: 5 µm. (E) Representative confocal microscopy images showing the concurrent distribution of FBL and BECN1 in control cells. Scale bar: 20 µm. (F) Immunoprecipitation (IP) of BECN1, and western blot to detect FBL or BECN1 as indicated, from total protein extract of untreated cells. IgG was used as control of FBL-specific interaction with BECN1. Whole blots are shown in Fig. S4C. Images in C–E are representative of three repeats. Blots in F are representative of two repeats.

Similar articles

Cited by

References

    1. Alchanati, I., Teicher, C., Cohen, G., Shemesh, V., Barr, H. M., Nakache, P., Ben-Avraham, D., Idelevich, A., Angel, I., Livnah, N.et al. (2009). The E3 ubiquitin-ligase Bmi1/Ring1A controls the proteasomal degradation of Top2alpha cleavage complex - a potentially new drug target. PLoS One 4, e8104. 10.1371/journal.pone.0008104 - DOI - PMC - PubMed
    1. Alt, F. W., Wei, P. C. and Schwer, B. (2017). Recurrently breaking genes in neural progenitors: potential roles of DNA breaks in neuronal function, degeneration and cancer. In Genome Editing in Neurosciences (ed. Jaenisch R., Zhang F. and Gage F.), pp. 63-72. Springer. - PubMed
    1. Ashour, M. E., Atteya, R. and El-Khamisy, S. F. (2015). Topoisomerase-mediated chromosomal break repair: an emerging player in many games. Nat. Rev. Cancer 15, 137-151. 10.1038/nrc3892 - DOI - PubMed
    1. Austin, C. A., Lee, K. C., Swan, R. L., Khazeem, M. M., Manville, C. M., Cridland, P., Treumann, A., Porter, A., Morris, N. J. and Cowell, I. G. (2018). TOP2B: the first thirty years. Int. J. Mol. Sci. 19, 2765. 10.3390/ijms19092765 - DOI - PMC - PubMed
    1. Bae, H. and Guan, J. L. (2011). Suppression of autophagy by FIP200 deletion impairs DNA damage repair and increases cell death upon treatments with anticancer agents. Mol. Cancer Res. 9, 1232-1241. 10.1158/1541-7786.MCR-11-0098 - DOI - PMC - PubMed

Publication types