Review
. 2023 Jan 31;59(10):1274-1284.
doi: 10.1039/d2cc05907j.

Dance with spins: site-directed spin labeling coupled to electron paramagnetic resonance spectroscopy directly inside cells

Affiliations
Review

Dance with spins: site-directed spin labeling coupled to electron paramagnetic resonance spectroscopy directly inside cells

Annalisa Pierro et al. Chem Commun (Camb). .

Abstract

Depicting how biomolecules move and interact within their physiological environment is one of the hottest topics of structural biology. This Feature Article gives an overview of the most recent advances in Site-directed Spin Labeling coupled to Electron Paramagnetic Resonance spectroscopy (SDSL-EPR) to study biomolecules in living cells. The high sensitivity, the virtual absence of background, and the versatility of spin-labeling strategies make this approach one of the most promising techniques for the study of biomolecules in physiologically relevant environments. After presenting the milestones achieved in this field, we present a summary of the future goals and ambitions of this community.


Conflict of interest statement

There are no conflicts to declare.

Figures

Fig. 1
Fig. 1. Applications of SDSL–EPR to study dynamics and conformational changes of biomolecules. (A) Scheme representing a singly-labeled protein in the absence [Apo] and presence of DNA [Complex]. (B) Simulation of typical room-temperature EPR spectra obtainable from such samples: the global simulation is reported in black, the populations with different dynamics in green (broad-feature) or blue (sharp-feature). (C) Example of a plot for the simulation results: the weight of each component is represented as the surface of the spheres while the τc is plotted on the X-axis. (D) Scheme of a doubly-labeled protein interacting with DNA ([Apo] and [Complex], respectively). (E) Four-pulses DEER sequence. (F) Exemplary raw data and distance distributions obtainable by recording the DEER traces of the [Apo] (grey) and [Complex] (blue) samples. Error barrs in the distance distributions are shown as shadows of the same color.
Fig. 2
Fig. 2. Structures of most commonly used spin-labels: nitroxides ([1] MTSSL; [2] M-TETPO/MAG-1; [3] TPA); metal-chelators ([4] M-DOTA charged with Gd(iii); [5] Cu(ii)-NTA coordinated by two Histidines); trityls ([6] OX-SLIM). The paramagnetic centres are highlighted in green, and the reactive moieties are in blue. This colour code is retained in the following figures.
Fig. 3
Fig. 3. In-cell SDSL–EPR on DNA G-quadruplex and RNA duplexes. (A) Nitroxide spin-label used for the study [7] and unfolded DNA sequence injected in X. laevis oocytes. The labeled sites are highlighted with grey arrows. (B) Distance distributions extracted from X-band DEER of spin-labeled HT fitted with the Two-Gauss-curve model (red) and model-free Tikhonov regularization (blue); (C) time-resolved DEER distance measurement of the same DNA sequence in cellular extract: the red solid lines represent a superposition of two separate Gaussian curves (black); (D) nitroxide spin-label ElmUm [8], RNA sequence and structure used in the study; the modified Uracyl base is highlighted in the sequence in red; (E) background-corrected DEER data normalized by the modulation depth; (F) distance probability distributions obtained by model-free analysis for the duplex RNA (multiple traces show results obtained from different samples). Adapted with permission from M. Azarkh, V. Singh, O. Okle, D. R. Dietrich, J. S. Hartig and M. Drescher, ChemPhysChem, 2012, 13, 1444–1447, © 2012 Wiley-VCH Verlag GmbH & Co. KGaA, Weinheim; and from A. Collauto, S. Bülow, D. B. Gophane, S. Saha, L. S. Stelzl, G. Hummer, S. T. Sigurdsson and T. F. Prisner, Angew. Chem., Int. Ed., 2020, 132, 23225–23229. ©2020 Published by Wiley-VCH GmbH.
Fig. 4
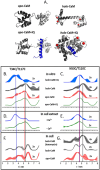
Fig. 4. Conformational changes of CaM in vitro, in cellular extract, and in cells. (A) Possible conformations of CaM: Ca(ii) ions are represented in red, and the peptide partner “IQ” in blue. Distances distributions extracted from in vitro experiments are in panels (B) and (C); in HeLa cellular extracts (D), (E) and in HeLa cells in panels (F) and (G) The data corresponding to the apo-protein is shown in red, in the presence of Ca(ii) ions (holo-CaM) in grey, of the IQ peptide in green, and of both in blue. Adapted from A. Dalaloyan, A. Martorana, Y. Barak, D. Gataulin, E. Reuveny, A. Howe, M. Elbaum, S. Albeck, T. Unger, V. Frydman, E. H. Abdelkader, G. Otting and D. Goldfarb, ChemPhysChem, 2019, 20, 1860–1868, ©2019 Wiley-VCH Verlag GmbH & Co. KGaA, Weinheim.
Fig. 5
Fig. 5. In-cell EPR study of a protein in its native host. (A) Structure of the nitroxide M-proxyl [9] and AlphaFold predicted structure of NarJ: the positions targeted for cysteine mutations are highlighted in blue, the c-terminal disordered tail in pink. (B) In-cell activity test of NarJ delivered in E. coli cells expressing the protein partner: inactive apoNarGH prior to delivery of NarJ (negative control, black); holoNarGH (positive control, green); apoNarGH activated by unlabeled NarJ (pink) or labeled NarJprox (purple). (C) Room temperature, X-band CW-EPR spectra recorded for the NarJ in vitro and in E. coli cells. Experimental data are in black, simulated in magenta. (D) results of the spectral simulations: in vitro data are above the axis (green and navy), in cell are below (yellow and cyan). The two components extracted from each spectrum are represented as spheres whose surface reports their percentage, while their position on the X-axis the τc (ns). Adapted with permission from Pierro, A., Bonucci, A., Normanno, D., Ansaldi, M., Pilet, E., Ouari, O., Guigliarelli, B., Etienne, E., Gerbaud, G., Magalon, A., Belle, V. and Mileo, E. (2022), Probing Structural Dynamics of a Bacterial Chaperone in Its Native Environment by Nitroxide-Based EPR Spectroscopy. Chem. Eur. J. 2022, 28, e202202249, © 2022 The Authors. Chemistry – A European Journal published by Wiley-VCH GmbH.
Fig. 6
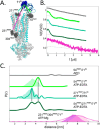
Fig. 6. Sybody (Sb) labeling of the ABC transporter via Gd–nitroxide distances. (A) Crystal of the protein labelled with MTSSL (gray) in the presence of the Sybody labeled with (Gd)M-DOTA (blue). (B) DEER traces of protein labeled with Sybody-Gd and MTSSL. (C) Distance distributions of three variants of the transporter in the apo-form and in the presence of ATP-EDTA and ATP-Mg. Simulated distance distributions are shown as shaded areas, the one for 231TM287-71Sb is displayed in purple, 304TM287-71Sb in pink. The distribution obtained by Gaussian model fit is shown in dotted lines. Adapted with permission from L. Galazzo, G. Meier, M. Hadi Timachi, C. A. J. Hutter, M. A. Seeger and E. Bordignon, Proc. Natl. Acad. Sci. U. S. A., 2020, 117, 2441–2448 ©2020 National Academy of Sciences.
Fig. 7
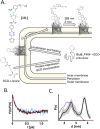
Fig. 7. In situ EPR on BtuB protein combining ncAA genetic-code expansion and photo-induced nitroxide PaNDA [10]. (A) Schematic representation of the protein expression and spin-labeling reaction; (B) background corrected DEER traces of BtuB-SCO-PaNDA in the presence of the TEMPO-CNCbl in E. coli cell membrane (black) or in isolated outer membranes (light blue). (C) Corresponding in situ distance distribution (black, error bar in grey). The purple line indicates the simulated distance distribution. Reproduced from A. Kugele, S. Ketter, B. Silkenath, V. Wittmann, B. Joseph and M. Drescher, Chem. Commun., 2021, 57, 12980–12983 with permission from the Royal Society of Chemistry.
Fig. 8
Fig. 8. Genetic encoding of spin-labeled amino acid SLK-1 and intramolecular EPR distance measurements in E. coli on TRX protein. (A) SLK-1 spin-label [11]; (B) structure of the Thioredoxin (pdb: 2TRX) highlighting the rotamers of SLK-1 as red, green and blue sticks; (C) distance distribution for Thioredoxin labeled on the residues D14/G34SLK-1 (green, error bars in grey) compared to the corresponding theoretical distance distribution predicted on the basis of the rotamer library (blue). Adapted with permission from M. J. Schmidt, J. Borbas, M. Drescher and D. Summerer, J. Am. Chem. Soc., 2014. © 2014 American Chemical Society.
Fig. 9
Fig. 9. In-cell DEER on an in vivo labeled protein. (A) Schematic overview of the in vivo spin labeling approach via incorporation of ncAA pENF in eGFP, copper-catalyzed labeling followed by in-cell EPR distance determination. (B) Comparison of the form factors of Y39/L221pENF-L eGFP from DEER measurements conducted in vitro (orange) or in vivo (green). (C) Derived distance distribution for DEER measurements in vitro (orange) and in vivo (green). The gray area indicates the expected distance distribution based on MMM calculations. Reproduced from P. Widder, J. Schuck, D. Summerer and M. Drescher, Phys. Chem. Chem. Phys, 2020, 22, 4875, with permission from the Royal Society of Chemistry.
None
Annalisa Pierro
None
Malte Drescher

Similar articles

Cited by

References

    1. Mchaourab H. S. Lietzow M. A. Hideg K. Hubbell W. L. Biochemistry. 1996;35:7692–7704. doi: 10.1021/bi960482k. - DOI - PubMed
    1. Todd A. P. Cong J. Levinthal F. Levinthal C. Hubell W. L. Proteins: Struct., Funct., Genet. 1989;6:294–305. doi: 10.1002/prot.340060312. - DOI - PubMed
    1. Hubbell W. L. Altenbach C. Curr. Opin. Struct. Biol. 1994;4:566–573. doi: 10.1016/S0959-440X(94)90219-4. - DOI
    1. Hubbell W. L. Mchaourab H. S. Altenbach C. Lietzow M. A. Structure. 1996;4:779–783. doi: 10.1016/S0969-2126(96)00085-8. - DOI - PubMed
    1. Cornish V. W. Benson D. R. Altenbach C. A. Hideg K. Hubbell W. L. Schultz P. G. Proc. Natl. Acad. Sci. U. S. A. 1994;91:2910. doi: 10.1073/pnas.91.8.2910. - DOI - PMC - PubMed

MeSH terms