. 2023 Feb 15;133(4):e160959.
doi: 10.1172/JCI160959.

Reduced methylation correlates with diabetic nephropathy risk in type 1 diabetes

Affiliations

Reduced methylation correlates with diabetic nephropathy risk in type 1 diabetes

Ishant Khurana et al. J Clin Invest. .

Abstract

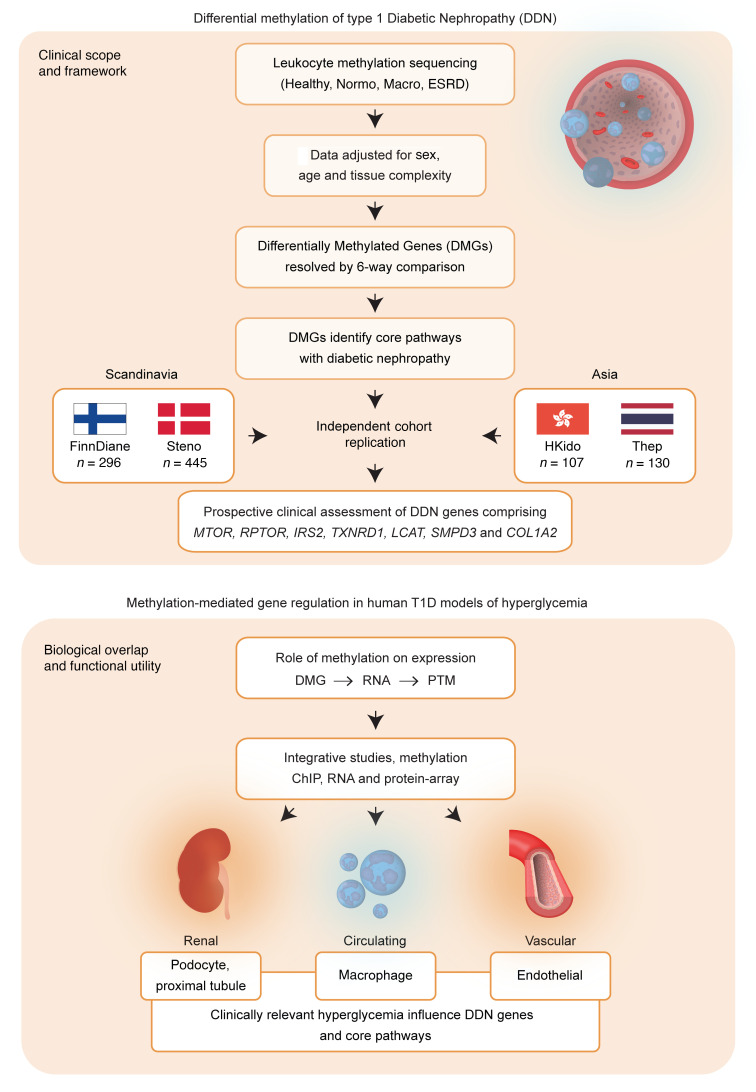
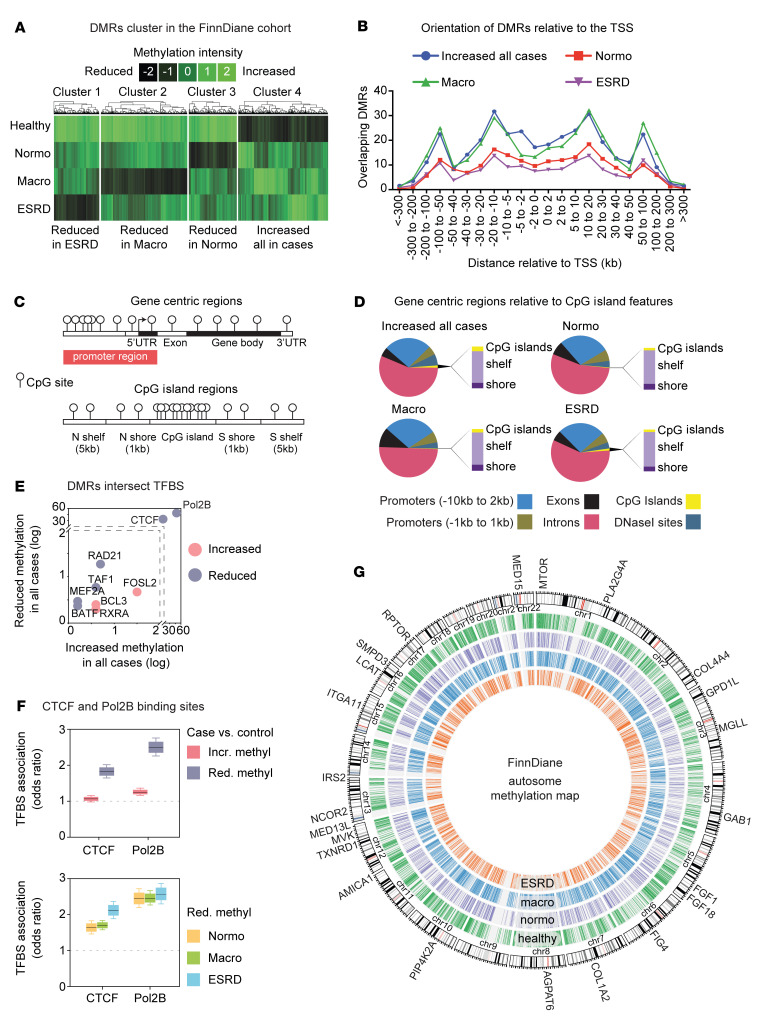
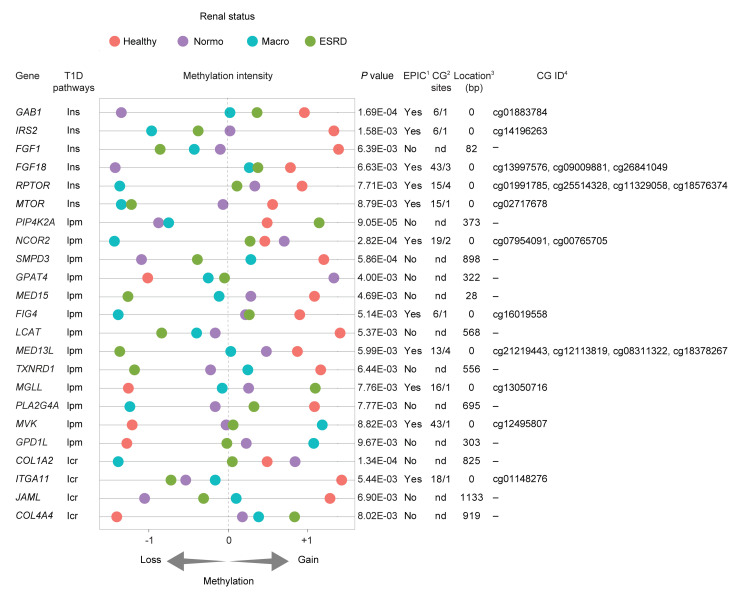
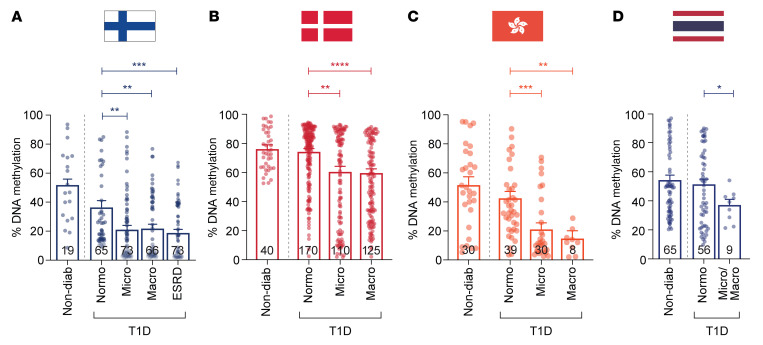
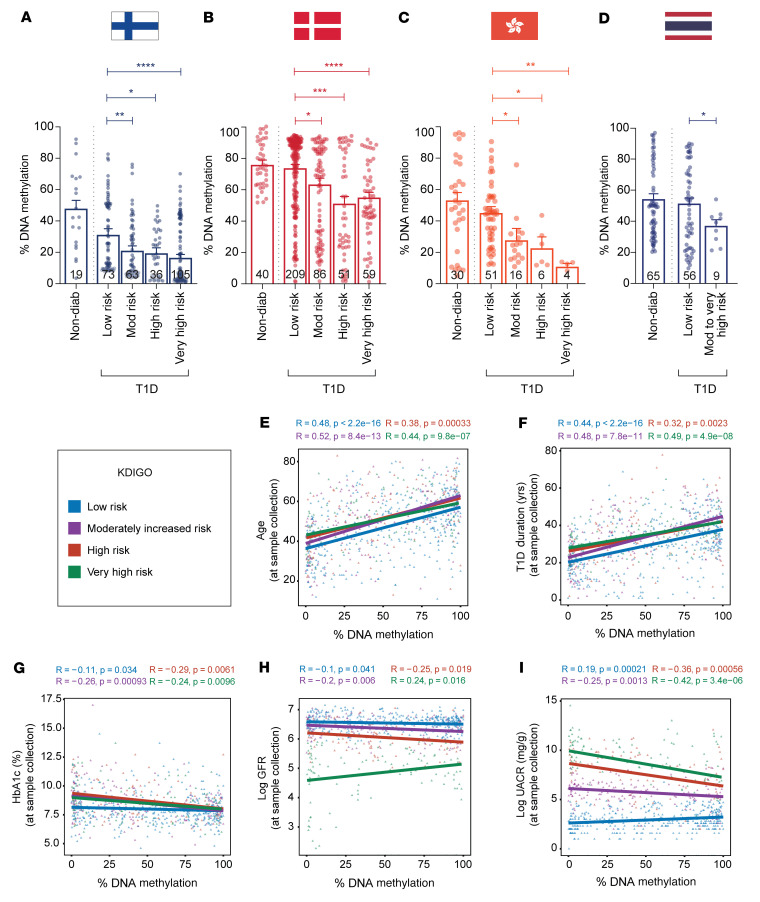
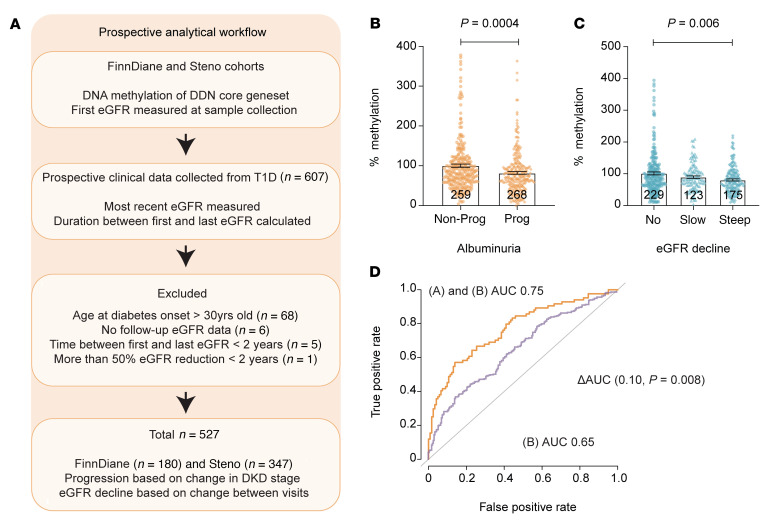
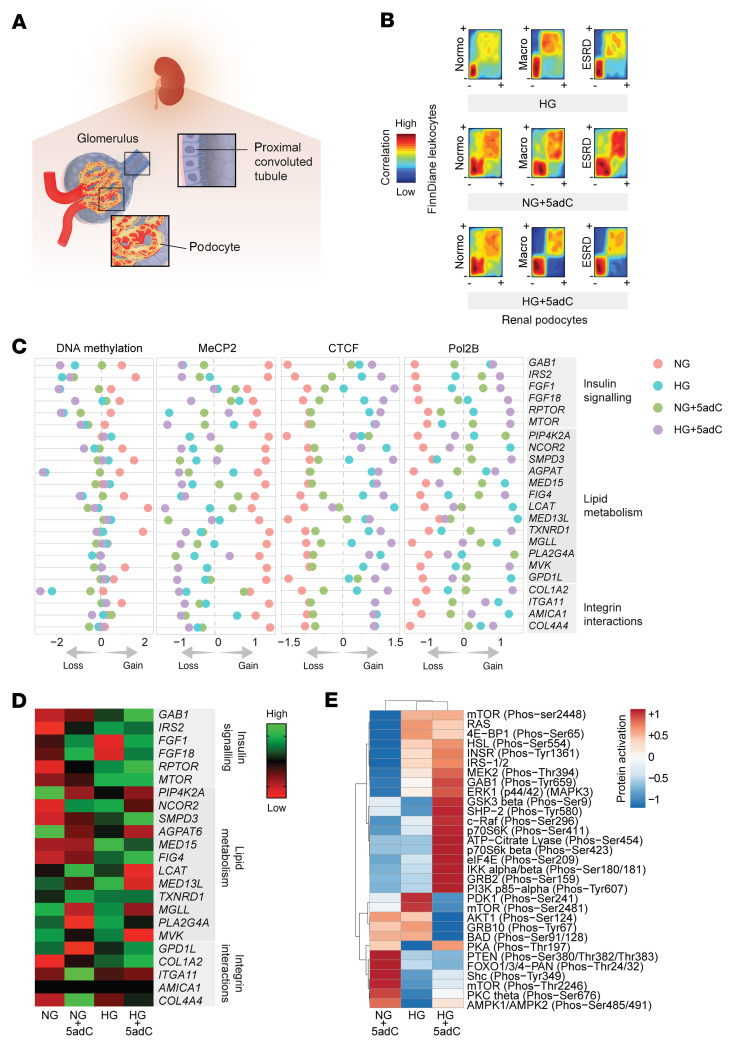
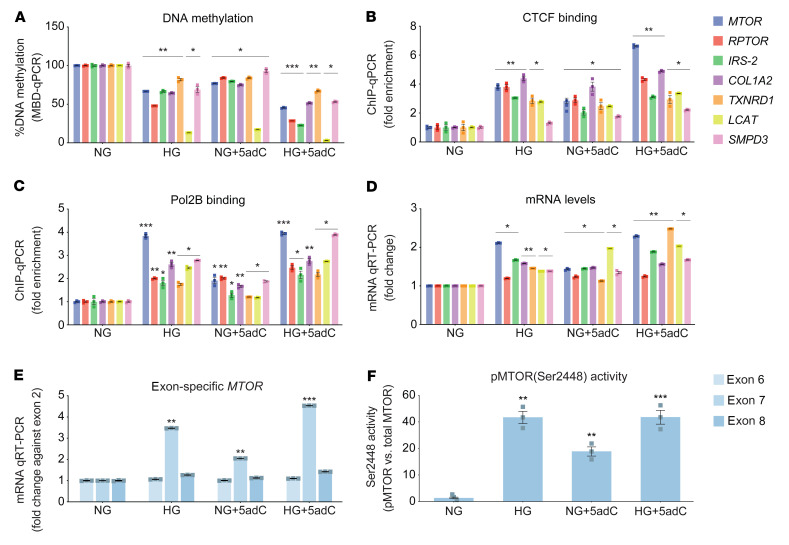
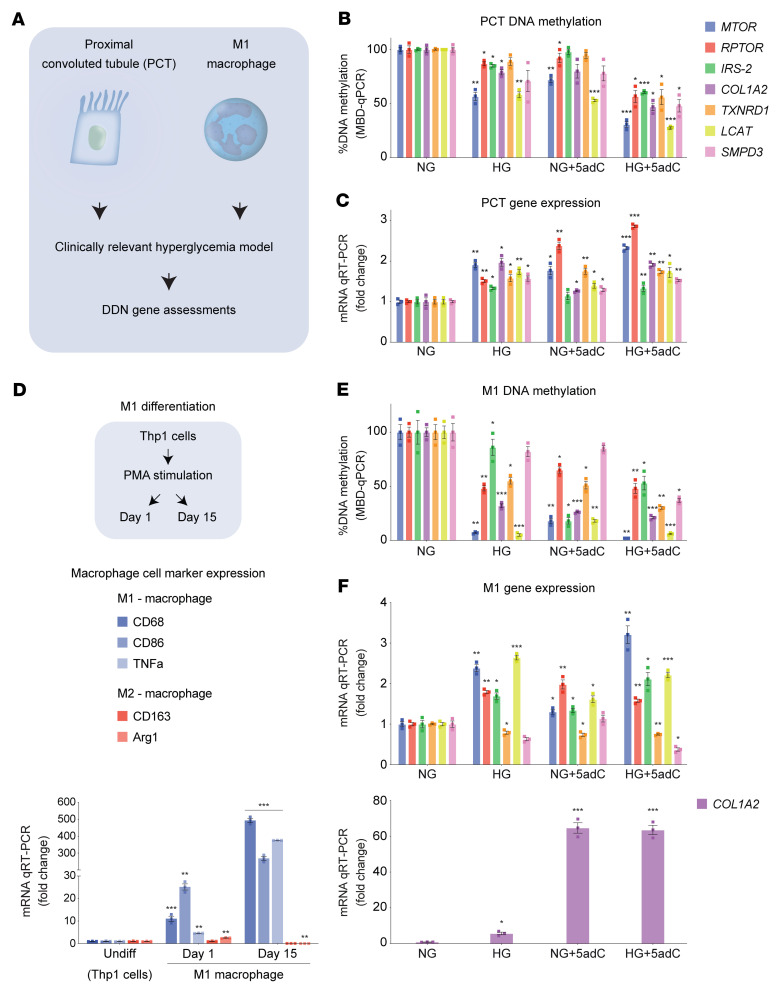
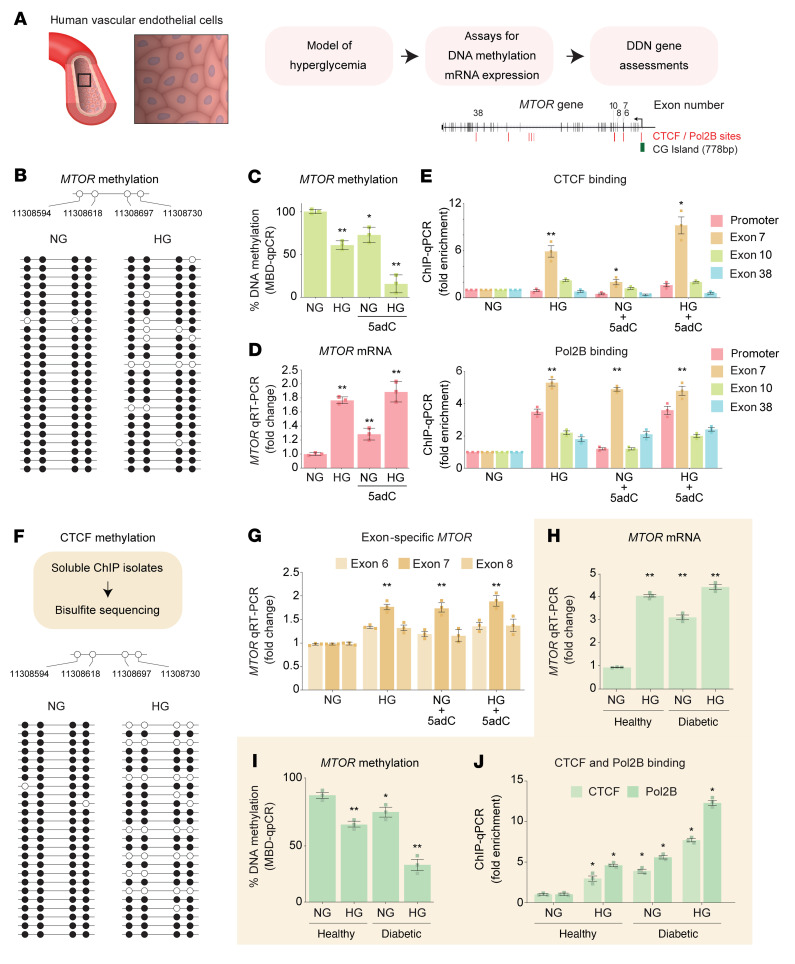
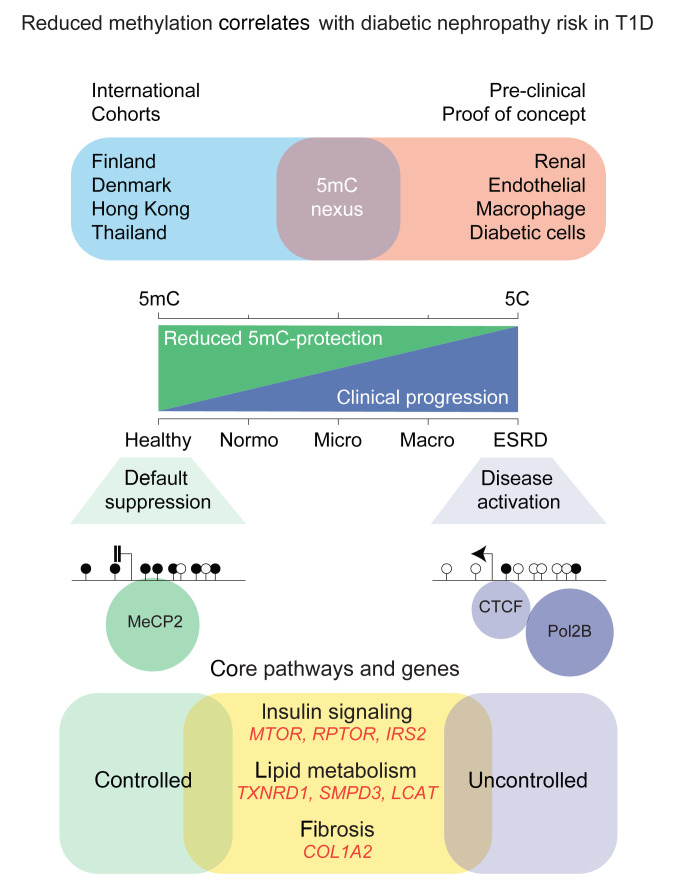
Diabetic nephropathy (DN) is a polygenic disorder with few risk variants showing robust replication in large-scale genome-wide association studies. To understand the role of DNA methylation, it is important to have the prevailing genomic view to distinguish key sequence elements that influence gene expression. This is particularly challenging for DN because genome-wide methylation patterns are poorly defined. While methylation is known to alter gene expression, the importance of this causal relationship is obscured by array-based technologies since coverage outside promoter regions is low. To overcome these challenges, we performed methylation sequencing using leukocytes derived from participants of the Finnish Diabetic Nephropathy (FinnDiane) type 1 diabetes (T1D) study (n = 39) that was subsequently replicated in a larger validation cohort (n = 296). Gene body-related regions made up more than 60% of the methylation differences and emphasized the importance of methylation sequencing. We observed differentially methylated genes associated with DN in 3 independent T1D registries originating from Denmark (n = 445), Hong Kong (n = 107), and Thailand (n = 130). Reduced DNA methylation at CTCF and Pol2B sites was tightly connected with DN pathways that include insulin signaling, lipid metabolism, and fibrosis. To define the pathophysiological significance of these population findings, methylation indices were assessed in human renal cells such as podocytes and proximal convoluted tubule cells. The expression of core genes was associated with reduced methylation, elevated CTCF and Pol2B binding, and the activation of insulin-signaling phosphoproteins in hyperglycemic cells. These experimental observations also closely parallel methylation-mediated regulation in human macrophages and vascular endothelial cells.

Keywords: Diabetes; Epigenetics; Metabolism; Nephrology.


Figures

Figure 1
Figure 1. Clinical framework and experimental overlap.
The clinical scope and framework for determining differential methylation in type 1 diabetic nephropathy using Scandinavian and Asian cohorts. Genome-wide DNA methylation was analyzed to identify leukocyte-based DMRs in T1D participants from the Finnish Diabetic Nephropathy (FinnDiane) study using methyl-capture coupled with sequencing. DMRs were annotated to differentially methylated genes (DMGs) associated with progression of diabetic nephropathy (DDN) and validated in a larger subset of the FinnDiane study (n = 296) and independent cohorts from Denmark (n = 445), Hong Kong (107), and Thailand (n = 130). Biological overlap and functional utility were assessed for methylation-mediated gene regulation in human cell models of hyperglycemia. We performed functional studies in human podocytes, proximal convoluted tubule cells, macrophages, and vascular endothelial cells and confirmed methylation-mediated regulation of core genes MTOR, RPTOR, IRS2, COL1A2, TXNRD1, LCAT, and SMPD3. PTM, posttranslational modification.
Figure 2
Figure 2. FinnDiane T1D methylome at sites of regulation.
(A) Hierarchical profile-based clustering of DMRs. DNA methylation differences detected between controls and cases with normoalbuminuria (Normo), macroalbuminuria (Macro), and end-stage renal disease (ESRD). Heatmap shows loss (black) and gain (green) of methylation. We observed clustering of DMRs by the prevalence of DN (P value < 0.01). (B) Binned orientation and distance of DMRs relative to transcription start site (TSS). (C) Graphical representation of genomic features and CG islands, shelves, and shores. (D) Distribution of DMR clusters shown at gene promoters, exons, introns, CG islands (CGI), and CG island shores (±1 kb from CGI) and shelves (±1–5 kb from CGI). The majority of CG differences occur at gene intronic regions. (E) Scatterplot of DMR overlap with TFBSs (ENCODE data). The x axis shows increased methylation at sites compared with reduced methylation at sites in T1D cases (y axis). TFBSs that associate with DMRs are shown as increased in methylation (pink) circles and reduced in methylation (purple) in T1D cases when compared with healthy controls. Criteria for TFBS overlap with DMRs was set to 50%. (F) CTCF and Pol2B binding sites are overrepresented at DMRs with reduced methylation in T1D cases when compared with healthy controls. Within each box, horizontal black lines denote median values; boxes extend from the 25th to the 75th percentile of each group’s distribution and the whisker denote the 5th and 95th percentiles. CTCF and Pol2B binding sites were overrepresented at sites of reduced methylation in diabetics that developed renal complications. All P values < 0.001. (G) Atlas of DNA methylation from FinnDiane discovery cohort. Human chromosome ideogram of DMRs clustered by DN (P < 0.01). The outermost track is organized by autosomes, showing several methylation-dependent genes. The centromere of each chromosome (chr) is represented by a double red line. The second track represents a genomic view of 3362 regions with increased methylation in all cases (hypomethylated in healthy group) (green, P < 0.01). The second track represents 1792 regions with decreased methylation in the Normo group (purple, P < 0.01). The fourth track represents the Macro group with 3227 regions with decreased methylation (blue, P < 0.01). The fifth track represents the genomic view of 1697 regions with decreased methylation detected in the ESRD group (orange, P < 0.01).
Figure 3
Figure 3. Functional analysis of FinnDiane cohort identified methylated genes associated with the progression of DN.
Differentially methylated genes associated with progression of diabetic nephropathy (DDN) with overlapping CTCF sites. Gene - annotated gene name; T1D-associated pathways with insulin signaling (Ins), lipid metabolism (lpm), and integrin-cell interaction (Icr); P value; Region length (bp); Methylation Intensity - scaled sequence abundance (–1, unmethylated; +1, methylated), showing relative gene methylation in healthy, Normo, Macro, and ESRD. Table also shows methyl-seq genes identified in the FinnDiane cohort intersected with probes from the Infinium Methylation EPIC profiling BeadChip microarray (EPIC array). Presence on the EPIC array; Number of CG sites assessed by methyl-seq overlapping EPIC array probe; Distance (bp) of the closest EPIC array probe from methyl-seq identified sequences. 1DMRs detected by methyl-seq–overlapping Infinium methylation EPIC BeadChip array probes. 2Comparison of CG number detected by methyl-seq versus EPIC probe CG location; nd denotes no detected probes on EPIC array. 3Distance of nearest EPIC array probe; 0 denotes EPIC CG site that exists within FinnDiane DMR. 4EPIC CG ID listed.
Figure 4
Figure 4. Validation of differentially methylated genes in replication cohorts.
(A) DNA methylation analysis of core genes was performed in a larger FinnDiane replication cohort (n = 296: 19 healthy, 65 Normo, 73 Micro, 66 Macro, and 73 ESRD) using a highly specific methyl-qPCR assay. Data show combined DNA methylation (%) for the 7 core genes: MTOR, RPTOR, IRS2 (insulin signaling), TXNRD1, LCAT, SMPD3 (lipid metabolism), and COL1A2 (integrin-cell interaction) using PCA loading analysis. Results show that reduced DNA methylation (%) is associated with DN. (B) Replication of FinnDiane-derived DDNs in samples from the Danish PROFIL study – Steno Diabetes Center Copenhagen. Methyl-qPCR methylation analysis includes 40 nondiabetic and T1D individuals with Normo (n = 170), Micro (n = 110), and Macro (n = 125). (C) Methylation analysis of the DDNs in 77 age-matched T1D individuals from the Hong Kong T1D registry and 30 healthy controls. Individuals with T1D include 39 Normo, 30 Micro, and 8 Macro. (D) Methylation analysis of the DDNs in age-matched nondiabetic and T1D individuals recruited from the Theptarin registry, Thailand. DNA methylation (%) was assessed for genes in 65 controls and 65 cases (56 without renal complications and 9 with renal complications). Significance was calculated using the Mann-Whitney U test by comparing T1D with no complications (Normo) to Micro, Macro, and ESRD (A) or by comparing T1D with Normo and 9 T1D with Micro/Macro (combined) (BD). *P < 0.05; **P < 0.01; ***P < 0.001; ****P < 0.0001. Error bars are SEM.
Figure 5
Figure 5. Differentially methylated genes associate with the progression of diabetic nephropathy in T1D cohorts based on KDIGO classification.
DNA methylation analysis of genes associated with diabetic nephropathy (DN) identified in the discovery cohort was validated in replication cohorts (A) FinnDiane, (B) PROFIL, (C) HKT1D, and (D) Theptarin T1D using methyl-qPCR assay. Samples from the replication cohorts were separated into 5 groups: nondiabetic and individuals with diabetes with low risk, moderate risk, high risk, and very high risk of developing DN as defined by the KDIGO classification. Data show the percentage DNA methylation (combined core gene set) for the different groups presented as bar plots and SEM, with significance calculated by comparing diabetics with low risk to those with moderate risk, high risk, and very high risk using the Mann-Whitney U test. *P < 0.05, **P < 0.01, ***P < 0.001, ****P < 0.0001. The DDNs include MTOR, RPTOR, IRS2, COL1A2, TXNRD1, LCAT, and SMPD3. Correlation plot between the combined core gene set and clinical covariates such as (E) age, (F) T1D duration, and (G) hemoglobin A1c (HbA1c %) and 2 key markers of chronic kidney disease: (H) estimated glomerular filtration rate (eGFR) and (I) urine albumin-to-creatinine ratio (UACR). Regression lines are shown for DNA methylation (combined methylation of core genes) versus age, T1D duration, HbA1c, eGFR, and UACR. Pearson’s correlation coefficient (R) and P value are reported for each group colored by KDIGO classification: T1D individuals with low risk (blue), with moderately increased risk (purple), and T1D individuals with high (red) and very high risk of developing ESRD (green). Covariate regression analysis was conducted for participants from Finland, Denmark, Hong Kong, and Thailand T1D cohorts (n = 824 T1D individuals). Nondiabetic controls were excluded.
Figure 6
Figure 6. Prospective data analysis of FinnDiane replication and PROFIL validation cohorts.
(A) Schema of prospective data analysis in FinnDiane and PROFIL cohorts — data were obtained prospectively to evaluate disease progression by also including follow-up eGFR from 527 individuals with T1D. (B) Reduced DNA methylation is a feature of albuminuria progression. DNA methylation analysis of genes associated with the DDNs, including MTOR, RPTOR, IRS2, COL1A2, TXNRD1, LCAT, and SMPD3. Samples from these T1D cohorts were classified as nonprogressors and progressors based on change in albuminuria stages (Normo to Micro; Micro to Macro; Macro to ESRD). Changes in DNA methylation for the different groups are presented as bar graphs (combined core genes for each sample in different groups). Error bars represent SEM, and the statistical significance was calculated by comparing nonprogressors and progressors using the Mann-Whitney U test. (C) Reduced DNA methylation is a feature of eGFR decline. DNA methylation analysis of the core genes in the FinnDiane and PROFIL cohorts based on eGFR decline in slope. eGFR decline is defined as the calculated estimated glomerular filtration slope by comparing the difference in the first (with matching DNA methylation readout) and last eGFR measurements as an index of follow-up time in years. No decline is defined as an eGFR slope of –1 mL/min/1.73 m2 or greater. Slow decline is defined by an eGFR slope of greater than –3 and less than –1 mL/min/1.73 m2. Steep decline is defined by an eGFR slope of less than –3 mL/min/1.73 m2. Error bars represent SEM and the significance was calculated by comparing no decline with slow and steep decline groups using the Mann-Whitney U test. Reduced DNA methylation associates with steep eGFR decline (P = 0.006). (D) DNA methylation index improves prediction of eGFR decline. ROC plot shows the AUC score for combined clinical factors (DM duration, HbA1c, UACR, smoking, and systolic blood pressure) 0.65, P = 4.08 × 10⁻⁷ (green). The inclusion of DNA methylation index improves the AUC score of combined clinical factors from 0.65 to 0.75 (P = 7.75 × 10⁻⁷) in predicting eGFR decline in the FinnDiane and PROFIL cohorts (Δ AUC 0.10; P = 0.008). The model for (A) combined core gene methylation and (B) clinical factors reports the combined result of gene methylation with individual covariates and shown in Table 1. P values were processed using bootstrap in R.
Figure 7
Figure 7. Integration of FinnDiane methylation and renal epigenomic indices.
(A) Renal cell types (podocytes and proximal convoluted tubule) assessed for DNA methylation mediated expression. (B) Reduced leukocyte methylation is a feature of hyperglycemia-induced podocyte changes. Comparison of differential methylation (~80,000 DMRs) in FinnDiane with human podocytes using rank-versus-rank analysis. Density plots show regions with gain (+) and loss (–) of DNA methylation in the FinnDiane discovery cohort (y axis) compared with human podocytes (x axis). Podocyte methylation sequencing data derived from 3 biological experiments (n = 3 per group) that were maintained in NG (physiological glucose control), NG + 5adC (physiological glucose including 3-day treatment with 5-aza-2′-deoxycytidine), HG (15 days high glucose), and HG + 5adC (15 days high glucose including 3-day treatment with 5adC). Similar pattern observed between differential methylation in FinnDiane versus human podocytes stimulated by HG and/or 5adC. (C) Diabetic nephropathy is associated with pathways regulated by DNA methylation in FinnDiane leukocytes and human podocytes. Annotated gene name; DNA methylation intensity - scaled (–2, relative methylation loss; +2, relative methylation gain), showing relative gene methylation of human podocytes maintained in NG, NG + 5adC, HG, and HG + 5adC. ChIP-seq data show MeCP2, CTCF, and Pol2B binding intensities relative to inputs (–1, low binding; +1, high binding). (D) mRNA expression levels associated with the progression of diabetic nephropathy. These genes are involved in pathways including insulin signaling, lipid metabolism, and integrin-cell interactions. Log2 scale — relative expression (–1, reduced; +1, elevated). (E) Profiling of phosphoprotein activation in human podocytes (relative to control, NG) using antibody array for the insulin signaling pathway. Proteins (219) were assessed using site-specific and phospho-specific antibodies (n = 2), NG, NG + 5adC, HG, and HG + 5adC. Relative protein activation is normalized to control (NG). Heatmap rows and columns are clustered using correlation distance and average linkage.
Figure 8
Figure 8. Human podocytes are subject to methylation-mediated changes in response to hyperglycemia.
(A) DNA methylation of genes associated with progression of diabetic nephropathy using methyl–qPCR of human podocytes exposed to normal glucose (NG) for 15 days and NG for 15 days including 3-day treatment with 5-aza-2′-deoxycytidine (NG + 5adC), high glucose for 15 days (HG), and high glucose including 3-day treatment with 5adC (HG + 5adC). Significance was calculated by comparing NG vs. HG, NG vs. NG + 5adC, and NG vs. HG + 5adC using 2-tailed Student’s t test (n = 3). (B) CTCF and (C) Pol2B binding was assessed in podocytes using ChIP-qPCR and signals normalized to IgG control. Significance was calculated by comparing to NG control using 2-tailed Student’s t test (n = 3). (D) Expression of core genes associated with diabetic nephropathy assessed in human podocytes stimulated by chronic HG and 5adC. qRT-PCR data are shown relative to H3F3A. Significance was calculated by comparing NG vs. HG, NG vs. NG + 5adC, and NG vs. HG + 5adC using 2-tailed Student’s t test (n = 3). (E) MTOR exon–specific qRT-PCR. Relative expression relative to NG control and MTOR exon 2 expression (n = 3). (F) Quantification of phosphorylated MTOR protein in podocytes exposed to HG and 5adC. Bars represent the relative phosphorylation (Ser2448) of MTOR protein in cells exposed to HG and 5adC detected by Odyssey infrared imaging (n = 3). *P < 0.05; **P < 0.01; ***P < 0.001. Error bars are SEM.
Figure 9
Figure 9. Hyperglycemia influences the DDNs in proximal tubule cells and macrophages.
(A) Overview of experiments: culture conditions and experimental procedures used to assess core gene methylation and mRNA expression. Human proximal convoluted tubule cells and M1 macrophages (THP-1+ monocyte–derived) were cultured in physiological glucose conditions, high glucose (HG), and 5-aza-2′-deoxycytidine (5adC). (B) MTOR, RPTOR, IRS2, COL1A2, TXNRD1, LCAT, and SMPD3 were assessed using methyl–qPCR in PCT cells exposed to normal glucose (NG) for 15 days or NG for 15 days including 3 days with 5adC (NG + 5adC), HG for 15 days (HG), and HG including 3-days with 5adC (HG + 5adC) (n = 3). (C) mRNA levels of core genes assessed in PCT cells stimulated by chronic HG and 5adC. qRT-PCR data are shown relative to H3F3A (n = 3). (D) Macrophage differentiation from THP-1+ monocytes treated with phorbol-12-myristate-13-acetate (PMA) for 1 day and 15 days. Expression of macrophage-specific markers CD68, CD86, and TNFA (M1 macrophages) and CD163 and ARG1 (M2 macrophages) assessed by qRT-PCR. Data are shown relative to H3F3A (n = 3). (E) Methylation analysis of core genes in M1 macrophages (differentiated THP-1 day 15) exposed to HG and/or 5adC (n = 3). (F) mRNA levels of core genes assessed in M1 macrophages stimulated by chromic HG and 5adC. Data are shown relative to H3F3A. Significance was calculated using 2-tailed Student’s t test by comparing NG vs. HG, NG vs. NG + 5adC, and NG vs. HG + 5adC (B, C, E, and F) or by comparing undifferentiated vs. day 1 and undifferentiated vs. day 15 (D). *P < 0.05, **P < 0.01, ***P < 0.001. Error bars are SEM.
Figure 10
Figure 10. Methylation-mediated gene expression in human vascular endothelial cells.
(A) Model of hyperglycemia using primary human vascular endothelial cells derived from nondiabetic and T1D individuals. (B) MTOR bisulfite sequencing. Data are represented as a single DNA molecule from 1 sample from each group. Open circles, unmethylated CG; solid circles, methylated CG. (C) MTOR methylation analysis using methyl–qPCR. (D) MTOR mRNA levels in human endothelial cells stimulated by chronic HG and 5adC. qRT-PCR data are shown relative to H3F3A. Significance in C and D was calculated by comparing normal glucose (NG) vs. high glucose (HG), NG vs. NG + 5-aza-2′-deoxycytidine (5adC), and NG vs. HG + 5adC (n = 3). (E) Schematic of DMRs validated in the FinnDiane cohort overlapping the CTCF and Pol2B binding motifs proximal to MTOR exon 7. CTCF and Pol2B binding was assessed by ChIP-qPCR and signals were adjusted to an IgG antibody control. Regions of interest amplified are the CTCF binding sites on MTOR. Significance was calculated by comparing to NG control (n = 3). (F) CTCF ChIP assay combined with bisulfite sequencing upstream of exon 7 of the MTOR gene. Open circles, unmethylated CG; solid circles, methylated CG. (G) MTOR exon–specific qRT-PCR assay in human vascular endothelial cells. mRNA levels reported relative to NG (n = 5). (H) MTOR qRT-PCR data from primary human aortic endothelial cells isolated from healthy and T1D individuals (n = 3). (I) MTOR methylation analysis in primary endothelial cells using methyl-qPCR. DNA methylation was further reduced in diabetic cells exposed to HG. (J) CTCF and Pol2B binding was reduced in hyperglycemic conditions. Significance in I and J was calculated by comparing healthy vs. healthy + HG, diabetic vs. diabetic + HG, and healthy vs. diabetic + HG (n = 3). Experiments were performed on cells from passages 4 to 7. *P < 0.05, **P < 0.01 by 2-tailed Student’s t test. Error bars are SEM.
Figure 11
Figure 11. Reduced methylation correlates with diabetic nephropathy risk in type 1 diabetes.
DNA methylation–dependent regulation of genes implicated in pathways that are clinically relevant to the progression of diabetic nephropathy. Erosion of DNA methylation is associated with the loss of protection and the activation of core pathways associated with DN risk in type 1 diabetes.

References

    1. Saran R, et al. US Renal Data System 2016 annual data report: epidemiology of kidney disease in the United States. Am J Kidney Dis. 2017;69(3s1):A7–A8. doi: 10.1053/S0272-6386(17)30043-4. - DOI - PMC - PubMed
    1. de Boer IH, et al. Long-term renal outcomes of patients with type 1 diabetes mellitus and microalbuminuria: an analysis of the Diabetes Control and Complications Trial/Epidemiology of Diabetes Interventions and Complications cohort. Arch Intern Med. 2011;171(5):412–420. doi: 10.1001/archinternmed.2011.16. - DOI - PMC - PubMed
    1. Diabetes C, et al. Modern-day clinical course of type 1 diabetes mellitus after 30 years’ duration: the diabetes control and complications trial/epidemiology of diabetes interventions and complications and Pittsburgh epidemiology of diabetes complications experience (1983-2005) Arch Intern Med. 2009;169(14):1307–1316. doi: 10.1001/archinternmed.2009.193. - DOI - PMC - PubMed
    1. Clustering of long-term complications in families with diabetes in the diabetes controlcomplications trial. The Diabetes Control and Complications Trial Research Group. Diabetes. 1997;46(11):1829–1839. doi: 10.2337/diab.46.11.1829. - DOI - PubMed
    1. Quinn M, et al. Familial factors determine the development of diabetic nephropathy in patients with IDDM. Diabetologia. 1996;39(8):940–945. doi: 10.1007/BF00403913. - DOI - PubMed

Publication types

MeSH terms