. 2023 Jan 13;379(6628):eadd1236.
doi: 10.1126/science.add1236. Epub 2023 Jan 13.

ApoE isoform- and microbiota-dependent progression of neurodegeneration in a mouse model of tauopathy

Affiliations

ApoE isoform- and microbiota-dependent progression of neurodegeneration in a mouse model of tauopathy

Dong-Oh Seo et al. Science. .

Abstract

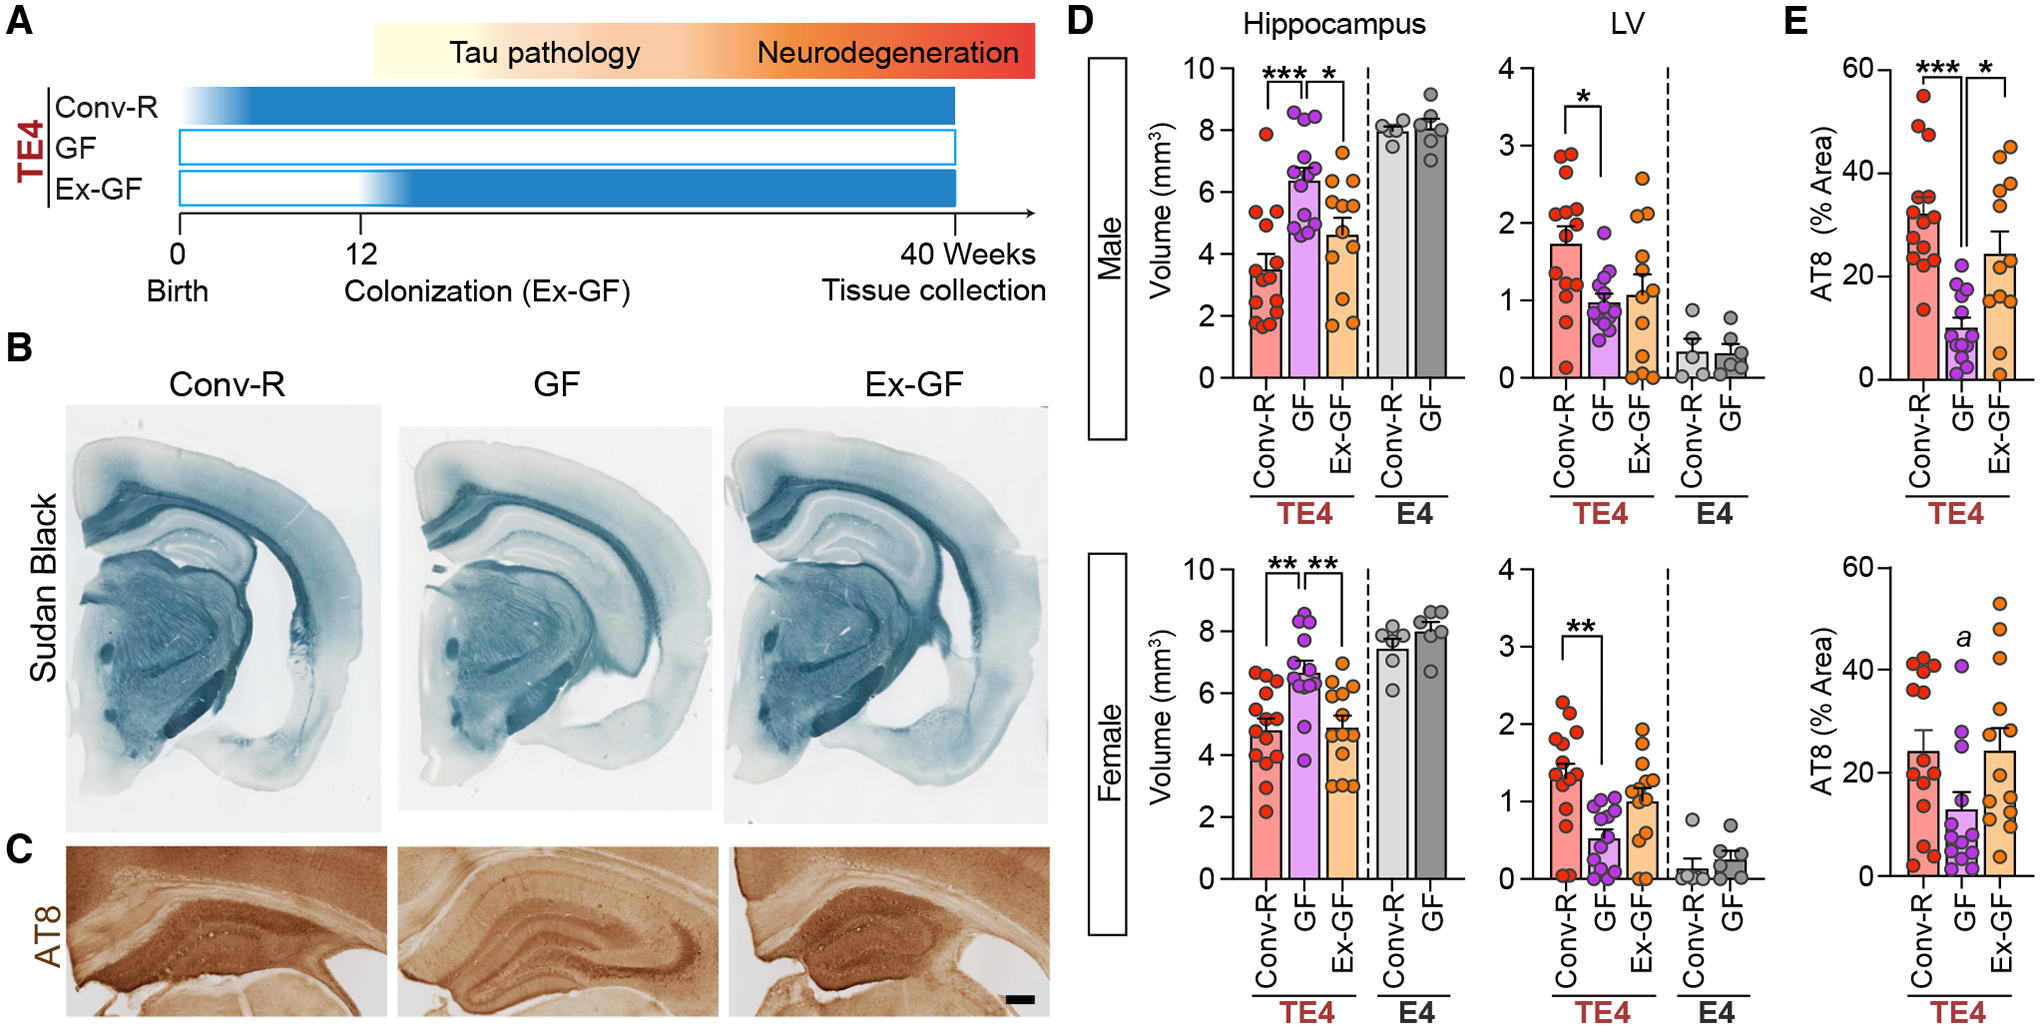
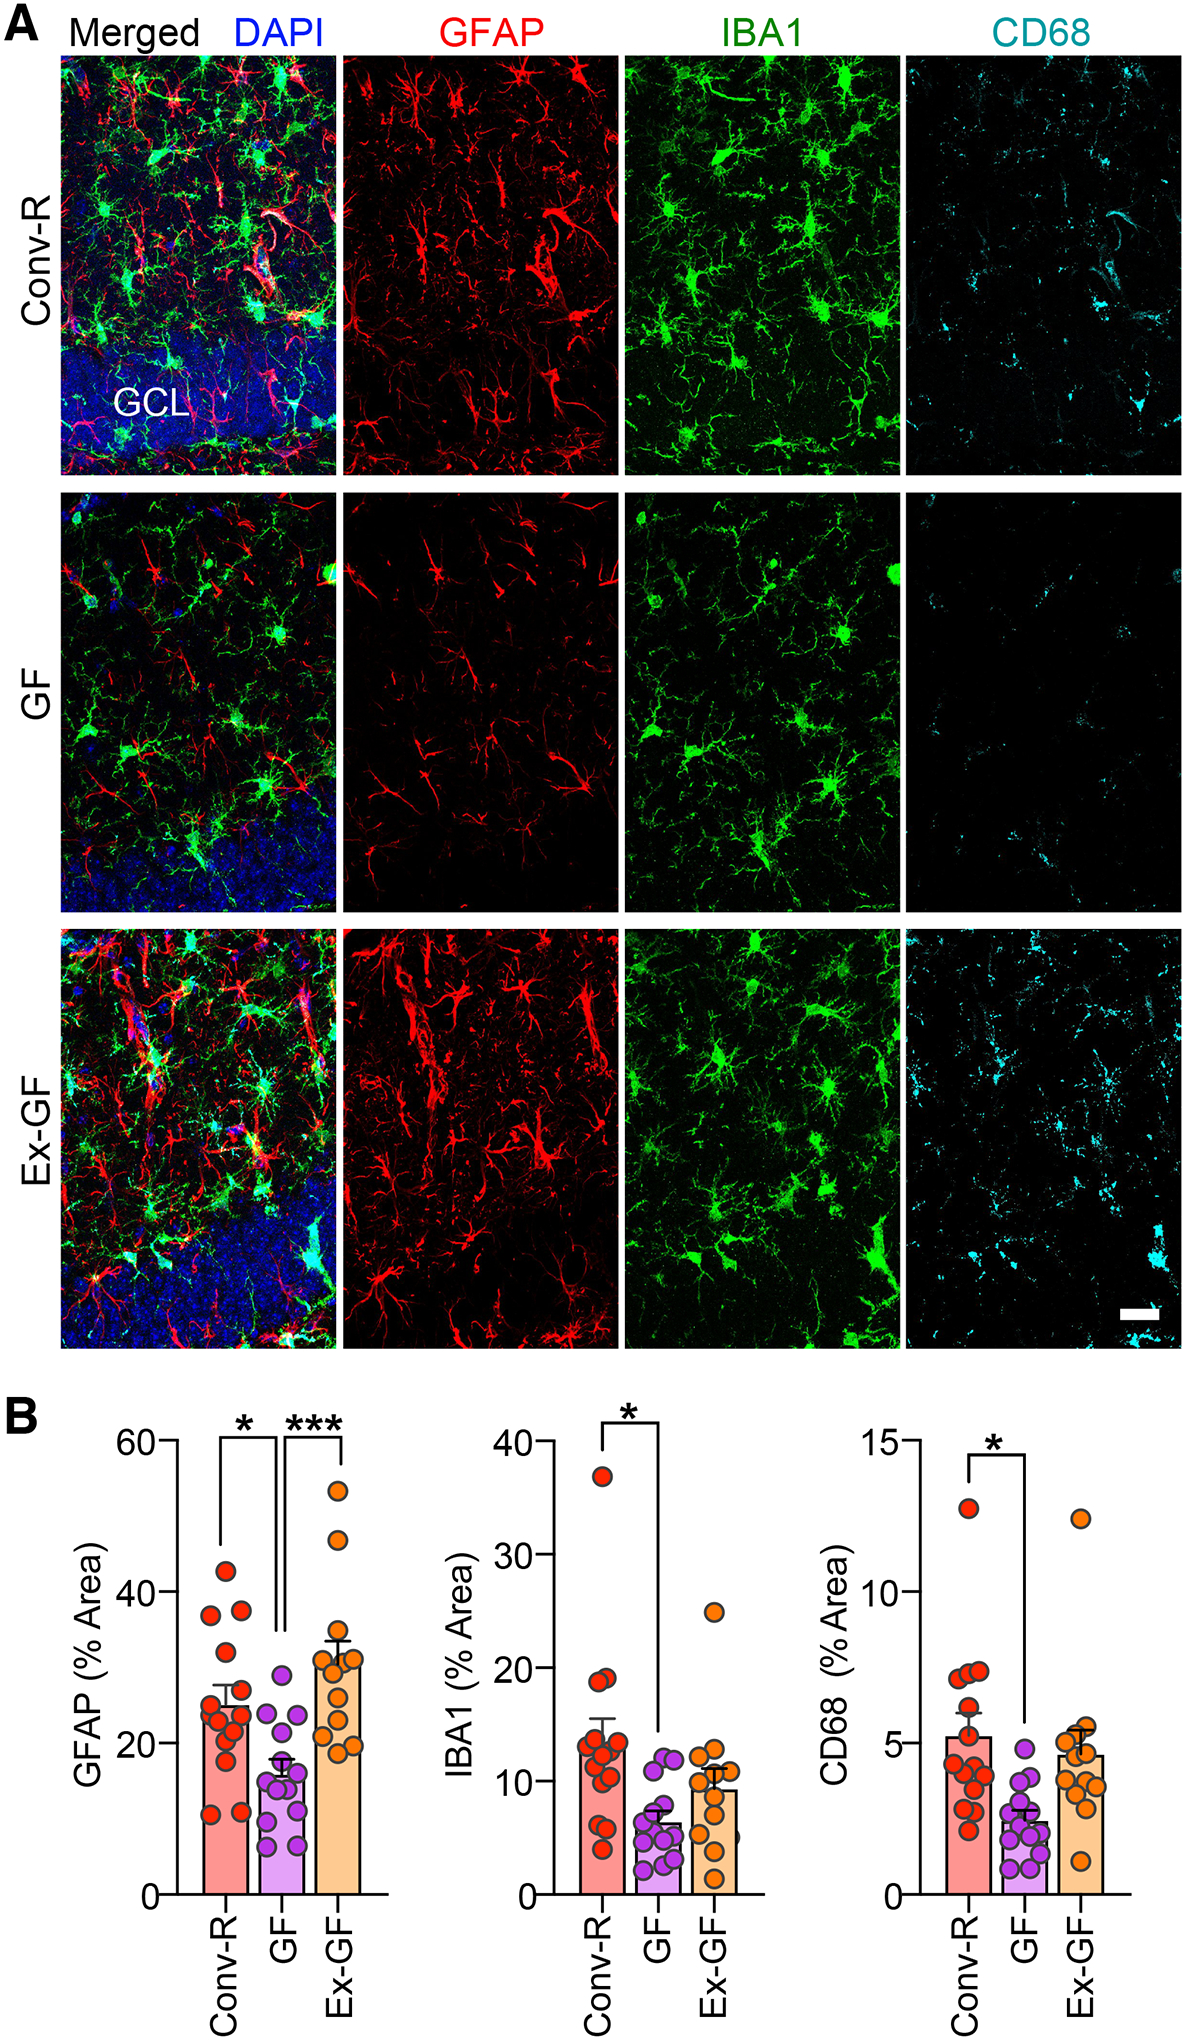
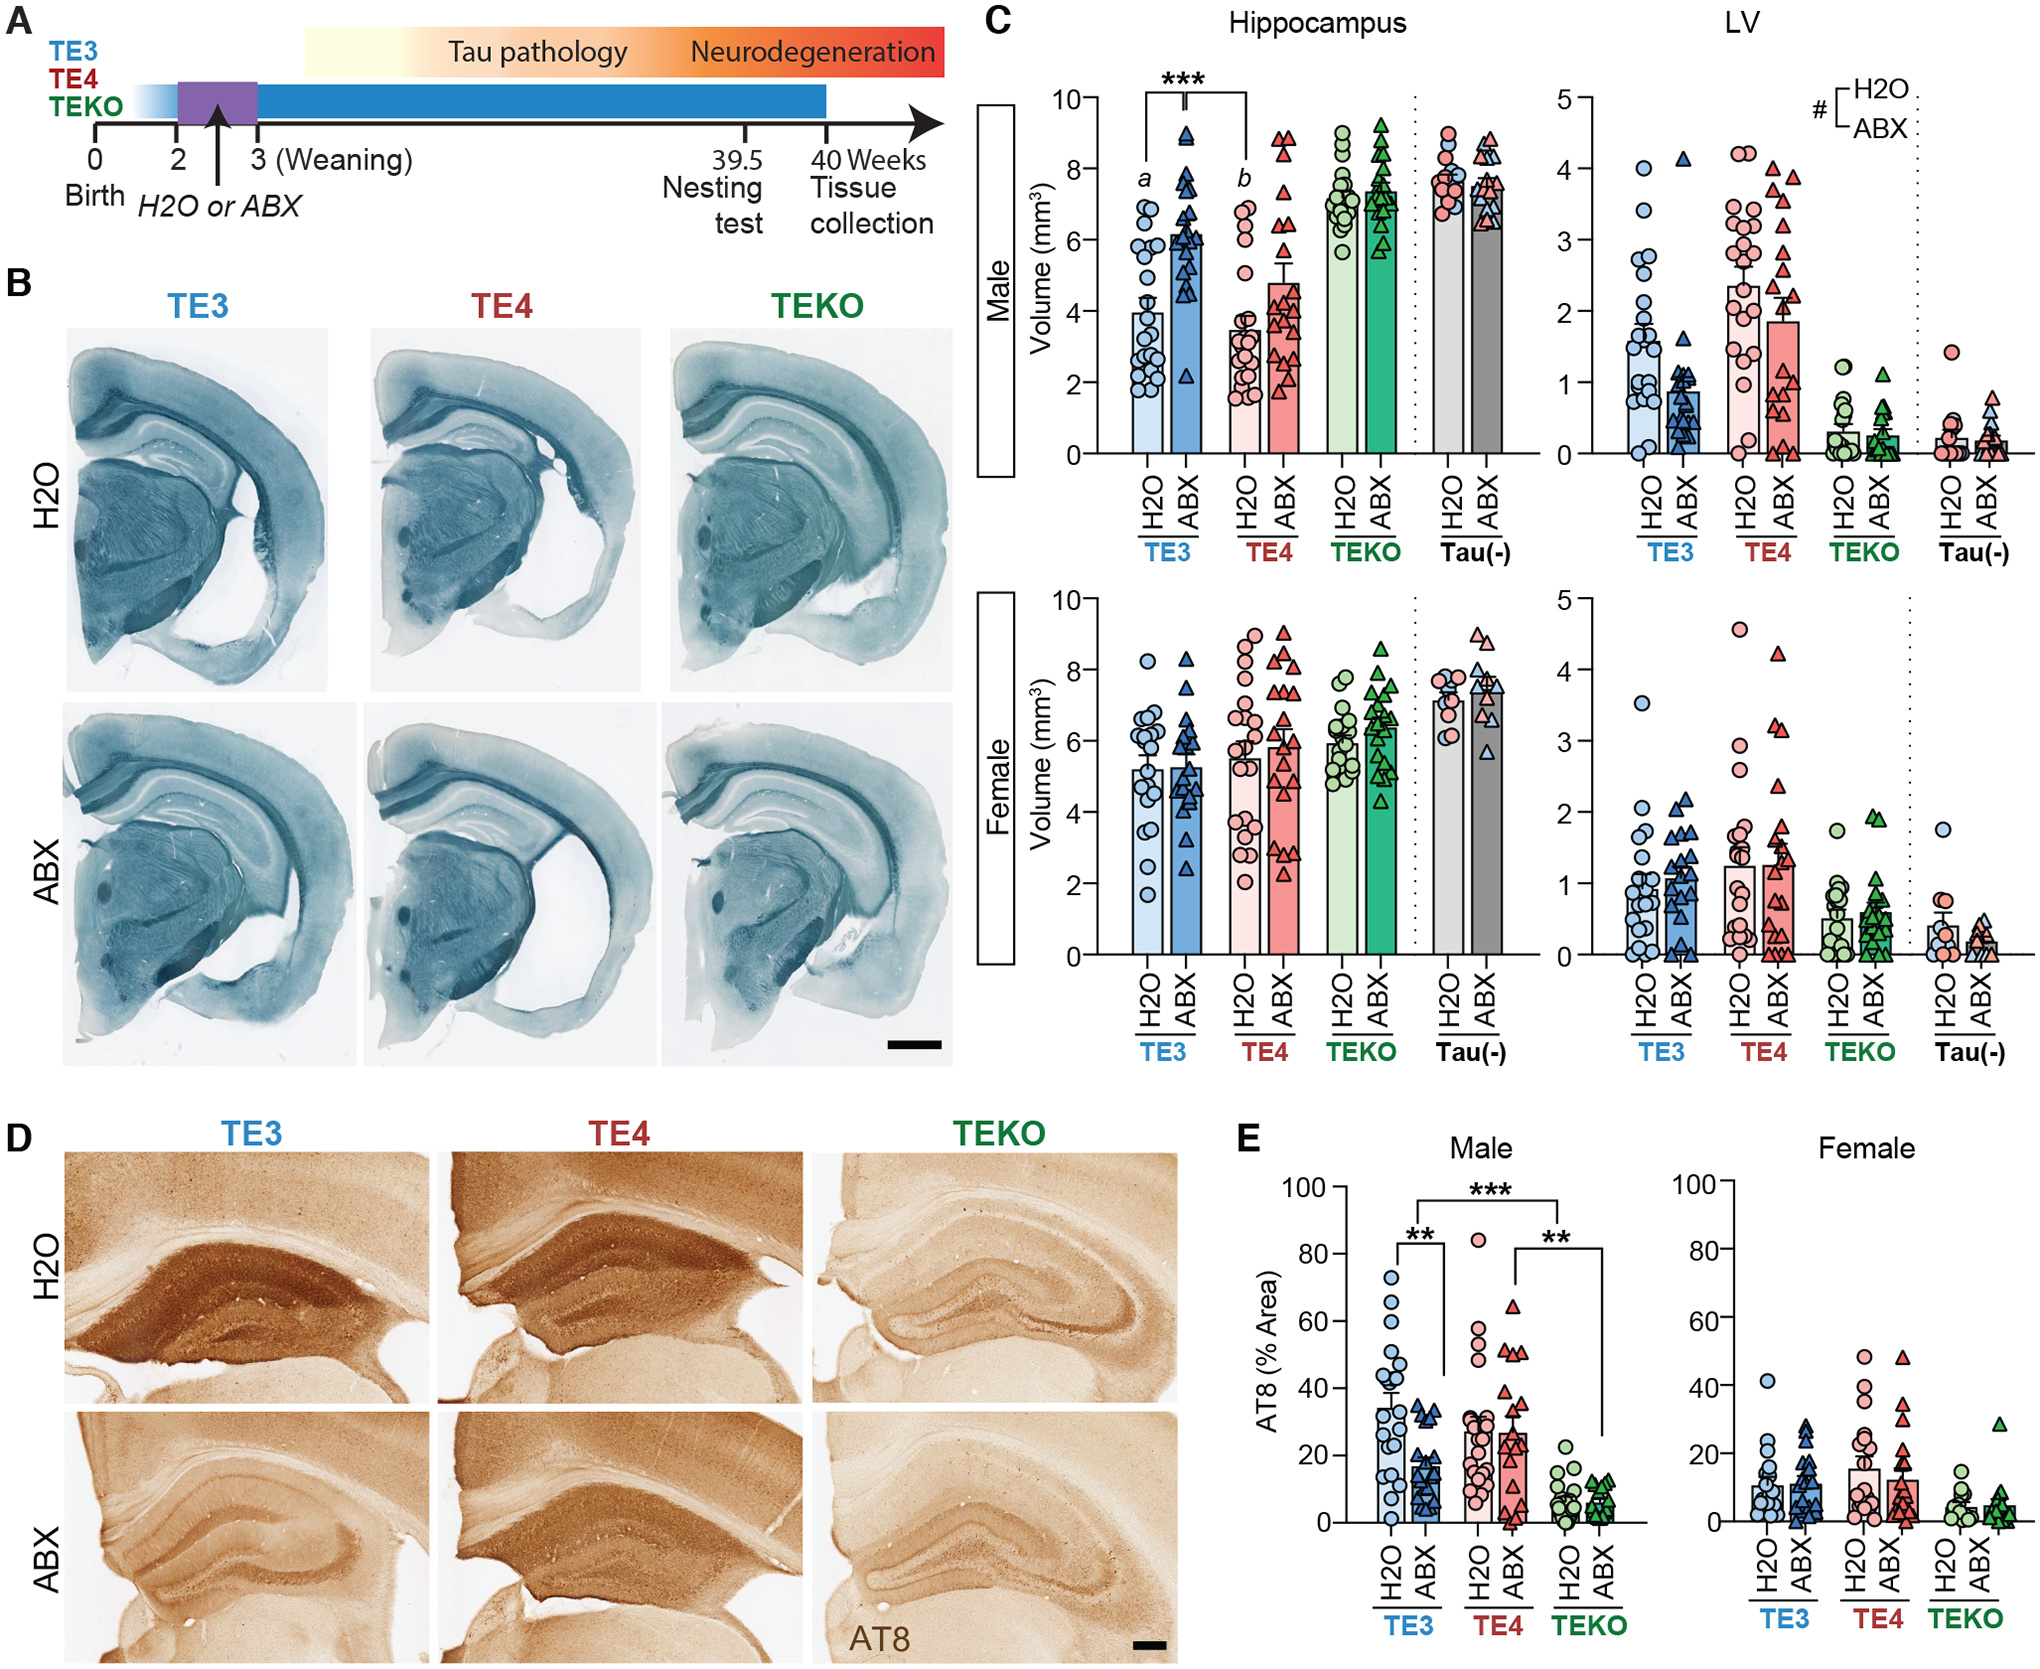
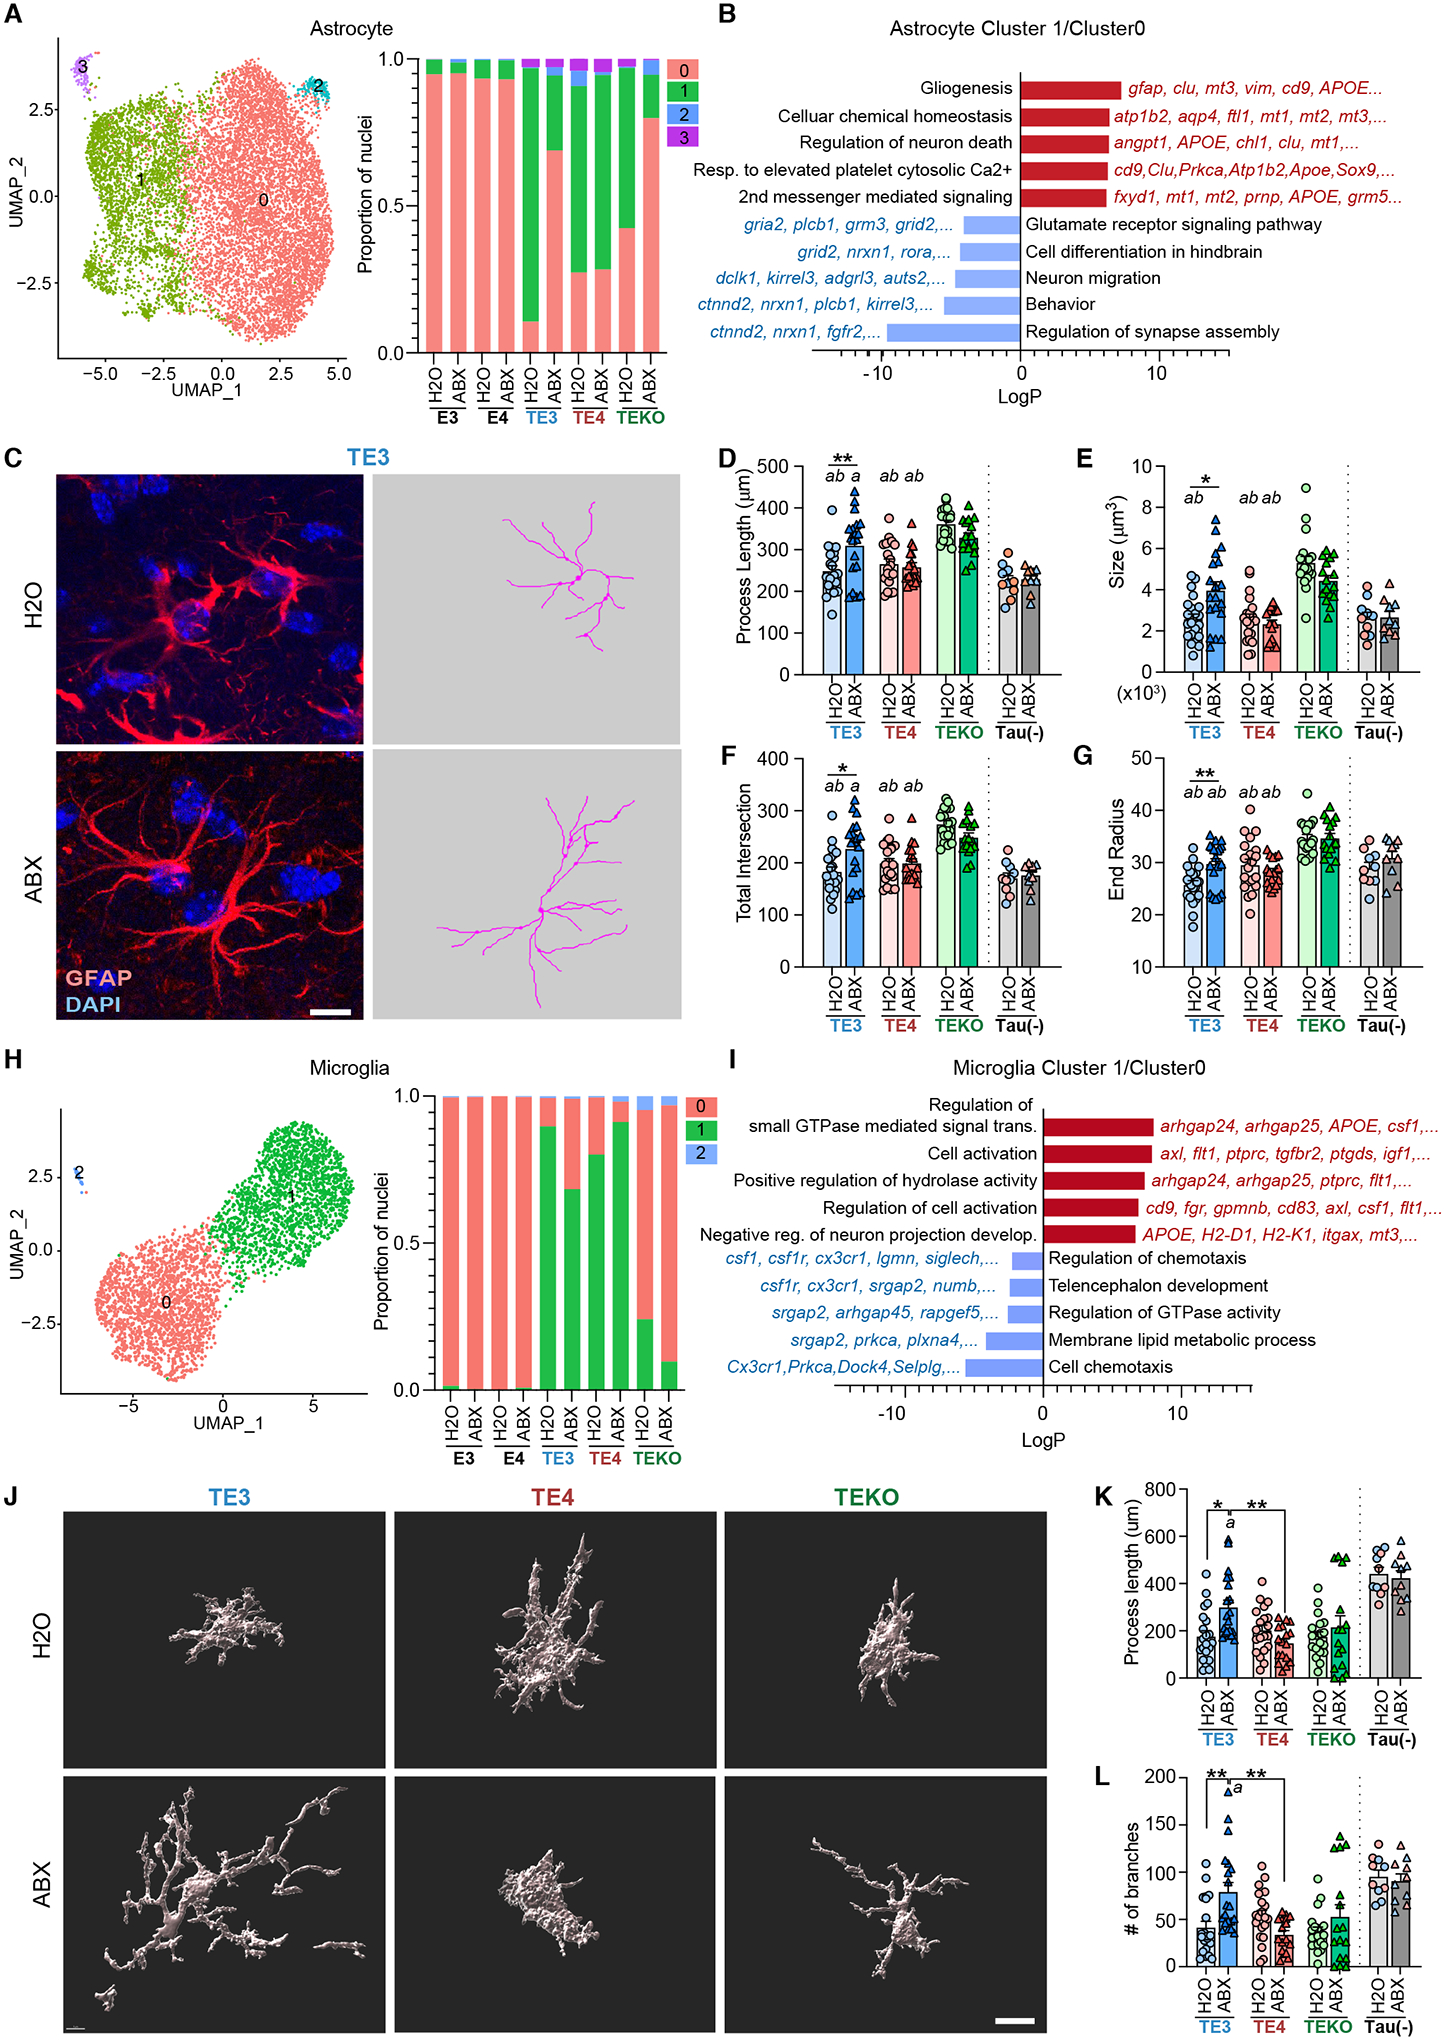
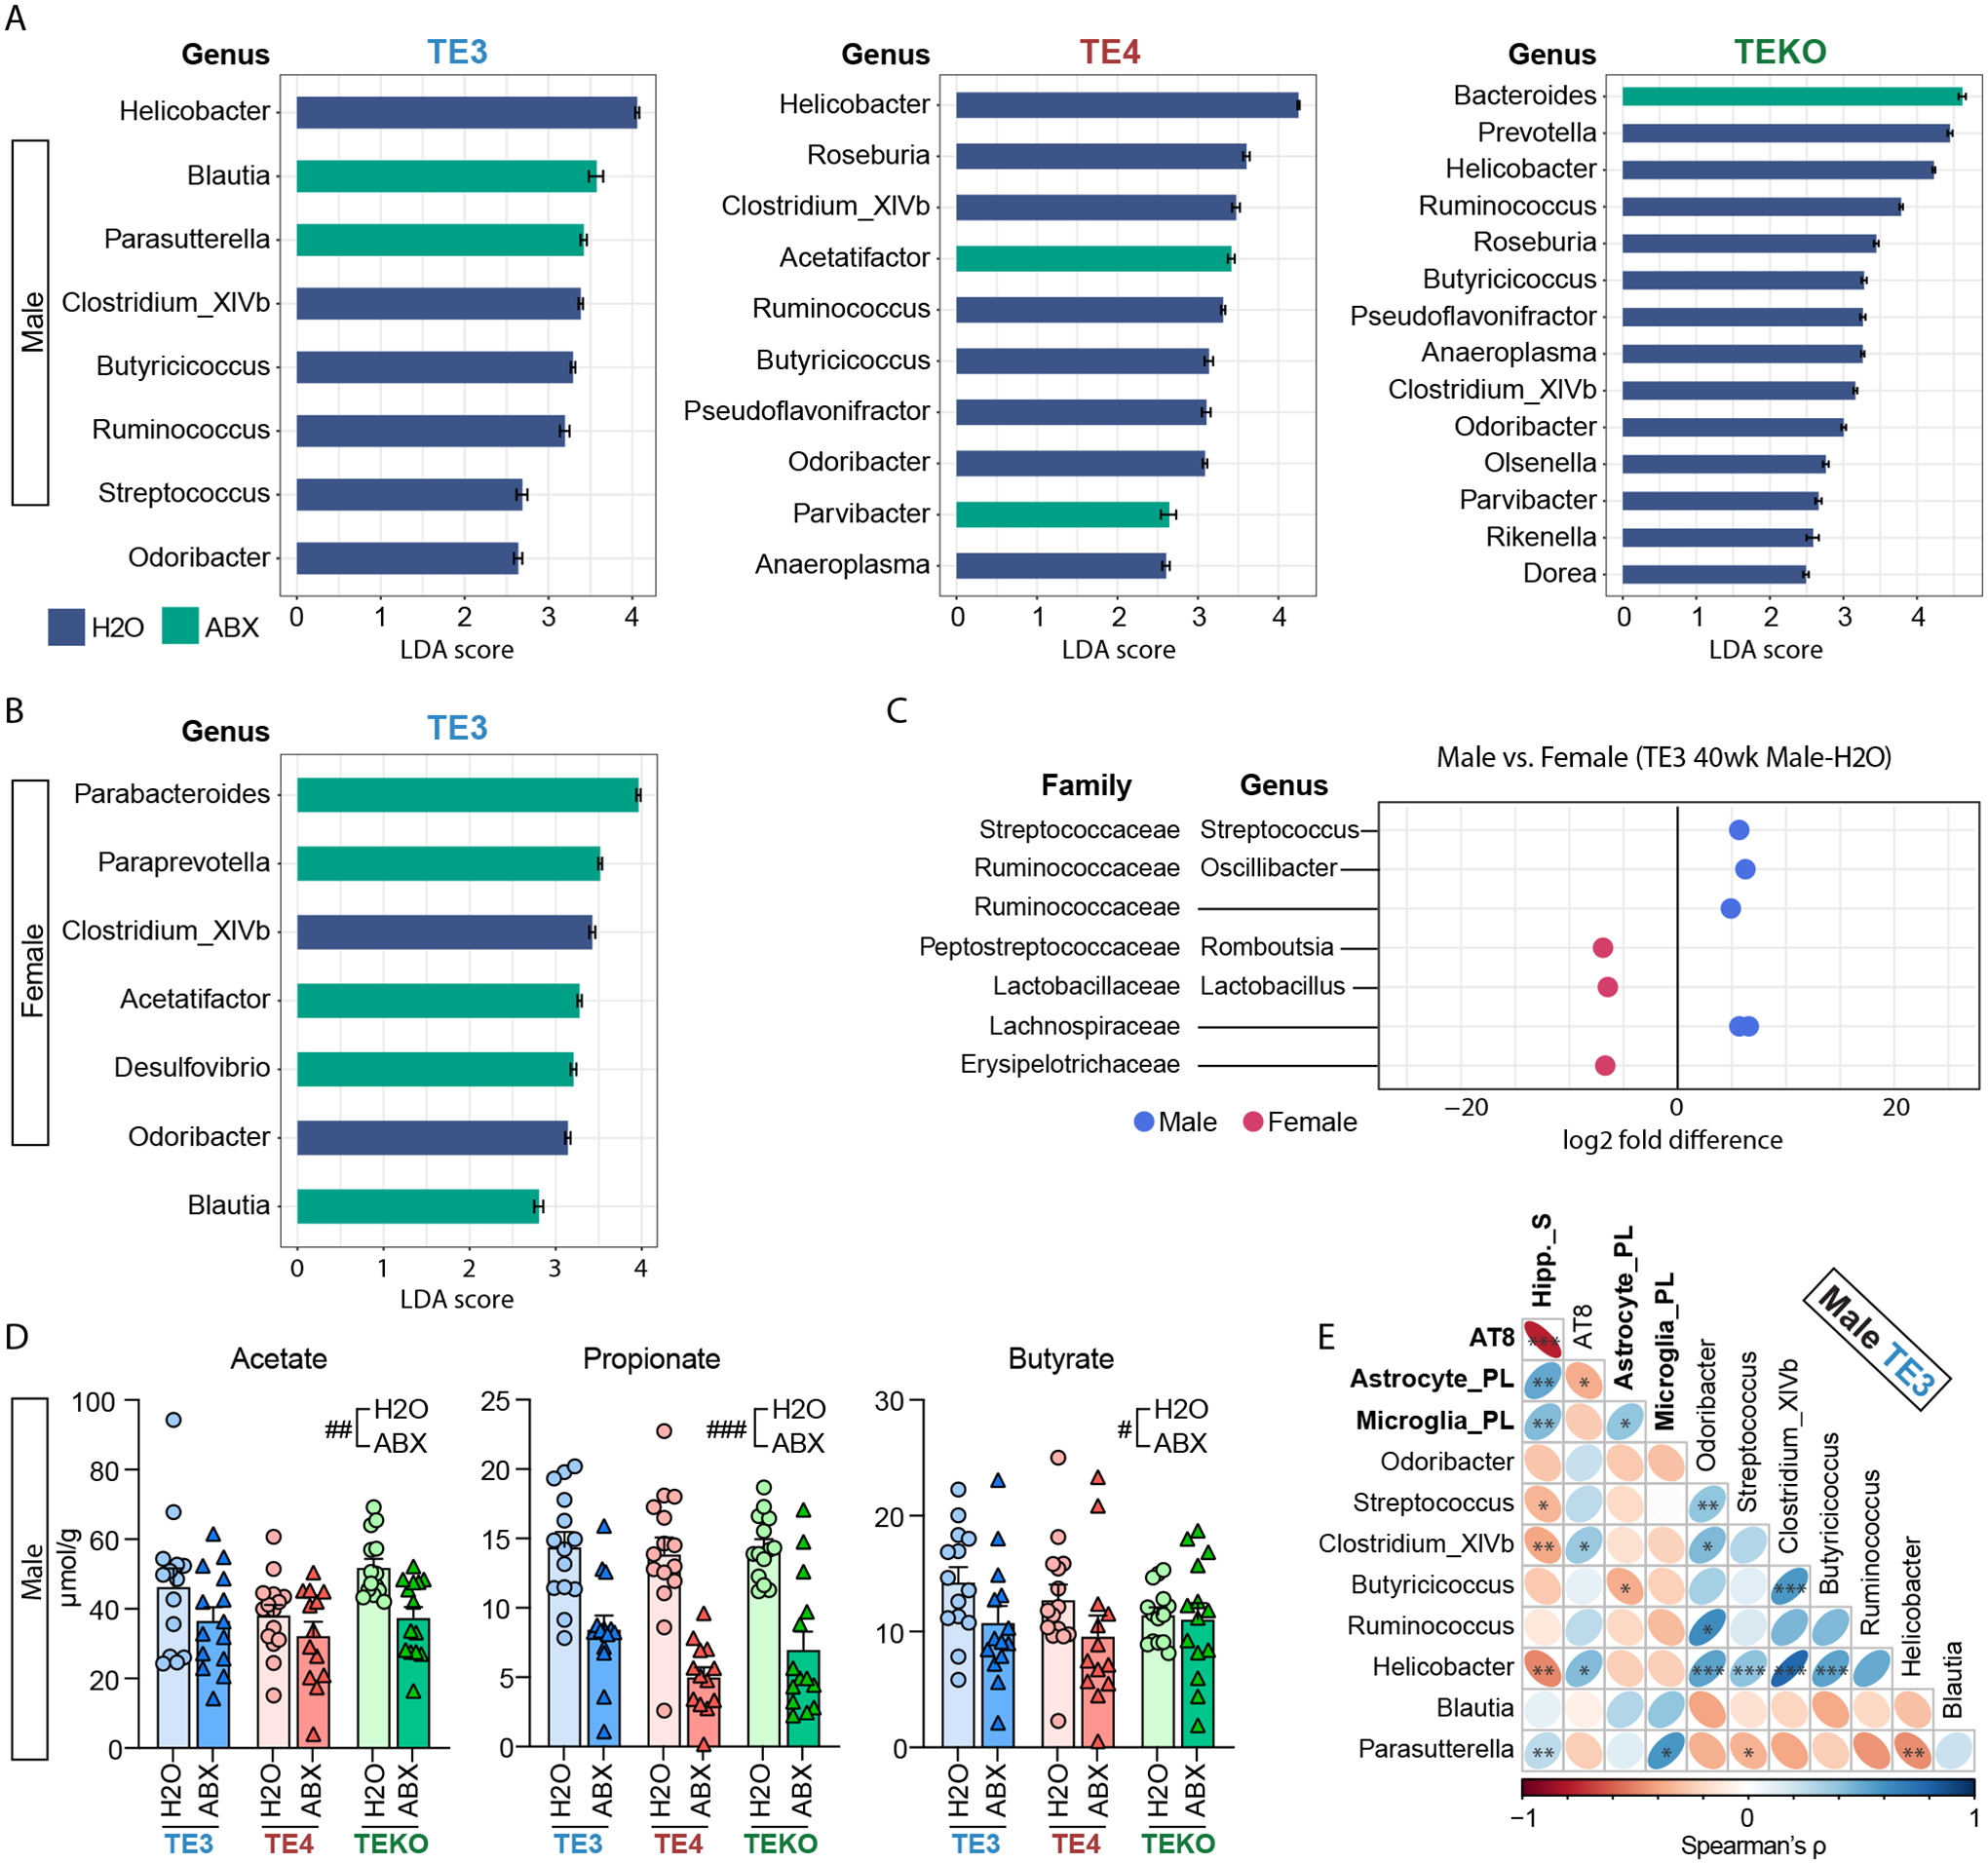
Tau-mediated neurodegeneration is a hallmark of Alzheimer's disease. Primary tauopathies are characterized by pathological tau accumulation and neuronal and synaptic loss. Apolipoprotein E (ApoE)-mediated neuroinflammation is involved in the progression of tau-mediated neurodegeneration, and emerging evidence suggests that the gut microbiota regulates neuroinflammation in an APOE genotype-dependent manner. However, evidence of a causal link between the microbiota and tau-mediated neurodegeneration is lacking. In this study, we characterized a genetically engineered mouse model of tauopathy expressing human ApoE isoforms reared under germ-free conditions or after perturbation of their gut microbiota with antibiotics. Both of these manipulations reduced gliosis, tau pathology, and neurodegeneration in a sex- and ApoE isoform-dependent manner. The findings reveal mechanistic and translationally relevant interrelationships between the microbiota, neuroinflammation, and tau-mediated neurodegeneration.


Figures

Fig. 1.
Fig. 1.. TE4 germ-free (GF) mice are protected against tau-mediated neurodegeneration.
(A) Experimental design. TE4 mice were reared in a vivarium in a specified pathogen-free state (conventionally-raised; Conv-R; n=14/sex) or under germ-free conditions in gnotobiotic isolators (GF; n=13–14/sex) until they were euthanized at 40 weeks of age. A separate group of 12-week-old GF mice were colonized with fecal microbiota harvested from sex-matched 40-week-old conventionally-raised TE4 mice (Ex-GF; n=12/sex). (B) Representative images of 40-week-old male Conv-R, GF, and Ex-GF mouse brain sections stained with Sudan black. Scale bar, 1mm. (C) Representative images of p-tau staining (AT8) in the hippocampus of male mice. Scale bar, 250μm. (D) Volumes of the hippocampus (left) and lateral ventricles (LV; right) in male (top) and female (bottom) mice. E4 represents APOE4 knock-in mice that lack a P301S tau transgene (E) Percentage area covered by AT8 staining in sections prepared from the hippocampus of 40-week-old male (top) and female (bottom) TE4 mice. Data are presented as mean values ± SEM. Statistical significance was defined using a one-way ANOVA with Tukey’s post hoc test. *, p <0.05, **, p < 0.01, ***, p < 0.001. ‘a’ in (E) indicates that, in the post-hoc analysis, Tukey did not reveal significant differences, but LSD showed p < 0.05 (GF vs. Conv-R and Ex-GF). (see Table S1 for full statistical results).
Fig. 2.
Fig. 2.. Germ-free TE4 mice exhibit reduced reactive gliosis.
(A) Representative immunofluorescence images of hippocampal sections from 40-week-old male Conv-R, GF, and Ex-GF mice stained with antibodies to GFAP (red), Iba-1 (green), and CD68 (cyan), as well as DAPI (blue). Scale bar, 25 μm. GCL, granule cell layer. (B) Percent of the area of sections taken from the hippocampus covered by GFAP (left), Iba-1 (middle), CD68 (right) staining. Mean values ± SEM are shown. (n=12–14/group). Statistical significance was defined by one-way ANOVA with Tukey’s post-hoc test. *, p < 0.05, ***, p < 0.001. (See Table S1 for full statistical results).
Fig. 3.
Fig. 3.. Antibiotic-treatment and perturbation of the gut microbiota markedly protects against tau-mediated neurodegeneration in a sex- and APOE isoform-dependent manner.
(A) Male and female TE3, TE4, and TEKO transgenic mice (n = 18–21/group) received a gastric gavage of a combination of antibiotics (ABX) from postnatal days 16–22. Controls were gavaged with water (H2O). Mice were euthanized at 40 weeks of age. (B) Representative images of male TE3/TE4/TEKO mouse brain sections stained with Sudan black. Scale bar, 1mm. (C) Volumes of the hippocampus (left) and lateral ventricles (right) in male (top) and female (bottom) animals. Tau (-) represents APOE3 (blue) or APOE4 (red) knock-in mice that lack a P301S tau transgene. (D) Representative images of p-tau staining (AT8) of hippocampal sections prepared from male mice. Scale bar, 250μm. (E) Percentage of the area covered by AT8 staining of hippocampal sections prepared from male (left) and female (right) mice. Mean values ± SEM are shown; Statistical significance defined by two-way ANOVA with Tukey’s post hoc test. *, p < 0.05, **, p < 0.01, ***, p < 0.001. Statistical significance of the main effects of treatments (H2O vs. ABX) were indicated as #, p < 0.05. In Fig. 2C (male hippocampus), ‘a’ indicates statistical significance compared to TEKO- H2O and ABX groups (p < 0.001). ‘b’ indicates statistical significance compared to TE3-ABX, TEKO-H2O and ABX (p < 0.001). (see Table S1 for full statistical results).
Fig. 4.
Fig. 4.. Glial transcriptional and morphological responses to tau pathology are regulated by ABX-treatment.
(A) The left panel shows UMAP plot of a re-clustered astrocyte population that identifies four distinguishable clusters (astrocyte cluster 0–3). The right panel shows relative frequency of all astrocyte clusters per genotype and treatment. (B) GO ‘Biological Process’ terms significantly enriched among differentially expressed genes (DEGs) (astrocyte cluster 1 vs.0). (C) Left side of panel; representative images of male TE3 mouse brain sections stained GFAP/DAPI. Right side of panel; traces of GFAP expression, generated using Simple Neurite Tracer (S7.), corresponding to the images on the left. Scale bar 10μm. (D-G) Morphometric analysis of astrocyte process lengths (D), size of GFAP+ astrocytes (from Convex Hull analysis) (E), total number of process intersections (F), and the end radius (from Sholl analysis) (G). (H) Left side of panel; UMAP plot of the re-clustered microglial population showing three distinguishable clusters (microglia clusters 0, 1, 2). Right side of panel; relative frequency (proportion of nuclei) of all microglia clusters per genotype and treatment group. (I) GO terms enriched in up-regulated and down-regulated DEGs (microglia cluster 1 vs. 0). (J) Imaris-based automatic reconstruction image of Iba1+ microglia. Scale bar 10μm. (K,L) Morphometric analysis of process lengths (K) and the number of branches (L) of Iba1+ microglial cells in male TE3, TE4, and TEKO mice. Tau(-) represents APOE3 (blue) or APOE4 (red) knock-in mice that lack a P301S transgene. Mean values ± SEM are presented with statistical significance defined by two-way ANOVA with Tukey’s post hoc test. *, p < 0.05, **, p < 0.01, ***, p < 0.001. ‘a’ and ‘b’ indicate statistical significance compared to TEKO-H2O (a) and TEKO-ABX (b, p <0.05). (see Table S1 for full statistical results).
Fig. 5.
Fig. 5.. Effects of ABX treatment on fecal microbiota composition and cecal levels of short chain fatty acids.
(A-B) Linear Discriminant Analysis (LDA) scores. Horizontal bars represent the LDA scores for each genus-level taxon in (A), male TE3, TE4, TEKO, and (B), female TE3 mice. Indigo and green bars represent taxon features with significantly higher representation in mice belonging to the control H2O and versus ABX treatment groups, respectively (LDA scores > 2). (C) Comparison of relative abundance of genera between 40-week-old male and female TE3-H2O mice. Family and genus assignments are shown. (D) Targeted GC-MS analysis of cecal short chain fatty acids in male 40-week-old TE3, TE4, and TEKO mice treated with ABX or H2O (n=14/group), tested by two-way ANOVA. Statistical significance of the main effects of treatments (H2O vs. ABX) were indicated as #, p < 0.05, ##, p < 0.01, ###, p < 0.001. (E) Correlogram showing the relationship between (i) eight genera identified as having differences in their relative abundance in male 40-week-old TE3 H2O vs ABX treated mice and (ii) biomarkers of tauopathy. These biomarkers (bold) include hippocampus size (Hipp._S; smaller value reflecting greater neurodegeneration), coverage of AT8 staining, process length of astrocytes (astrocyte_PL), and process length of microglial cells (microglia_PL). *, p < 0.05, **, p < 0.01, ***, p < 0.001. (see Table S1 for full statistical results).

Comment in

References

    1. Long J, Holtzman DM, Alzheimer Disease: An Update on Pathobiology and Treatment Strategies, Cell, (2019). - PMC - PubMed
    1. Seo DO, Holtzman DM, Gut Microbiota: From the Forgotten Organ to a Potential Key Player in the Pathology of Alzheimer’s Disease., J Gerontol A Biol Sci Med Sci, 75, 1232 (2020). - PMC - PubMed
    1. Harach T et al., Reduction of Abeta amyloid pathology in APPPS1 transgenic mice in the absence of gut microbiota., Sci Rep, 7, 41802 (2017). - PMC - PubMed
    1. Dodiya HB et al., Sex-specific effects of microbiome perturbations on cerebral Aβ amyloidosis and microglia phenotypes., J Exp Med, 216, 1542 (2019). - PMC - PubMed
    1. Parikh IJ et al., Murine Gut Microbiome Association With APOE Alleles, Front Immunol, 11, 200 (2020). - PMC - PubMed

MeSH terms

LinkOut - more resources