. 2023 Jan 13;379(6628):eabl3837.
doi: 10.1126/science.abl3837. Epub 2023 Jan 13.

Dome1-JAK-STAT signaling between parasite and host integrates vector immunity and development

Affiliations

Dome1-JAK-STAT signaling between parasite and host integrates vector immunity and development

Vipin S Rana et al. Science. .

Abstract

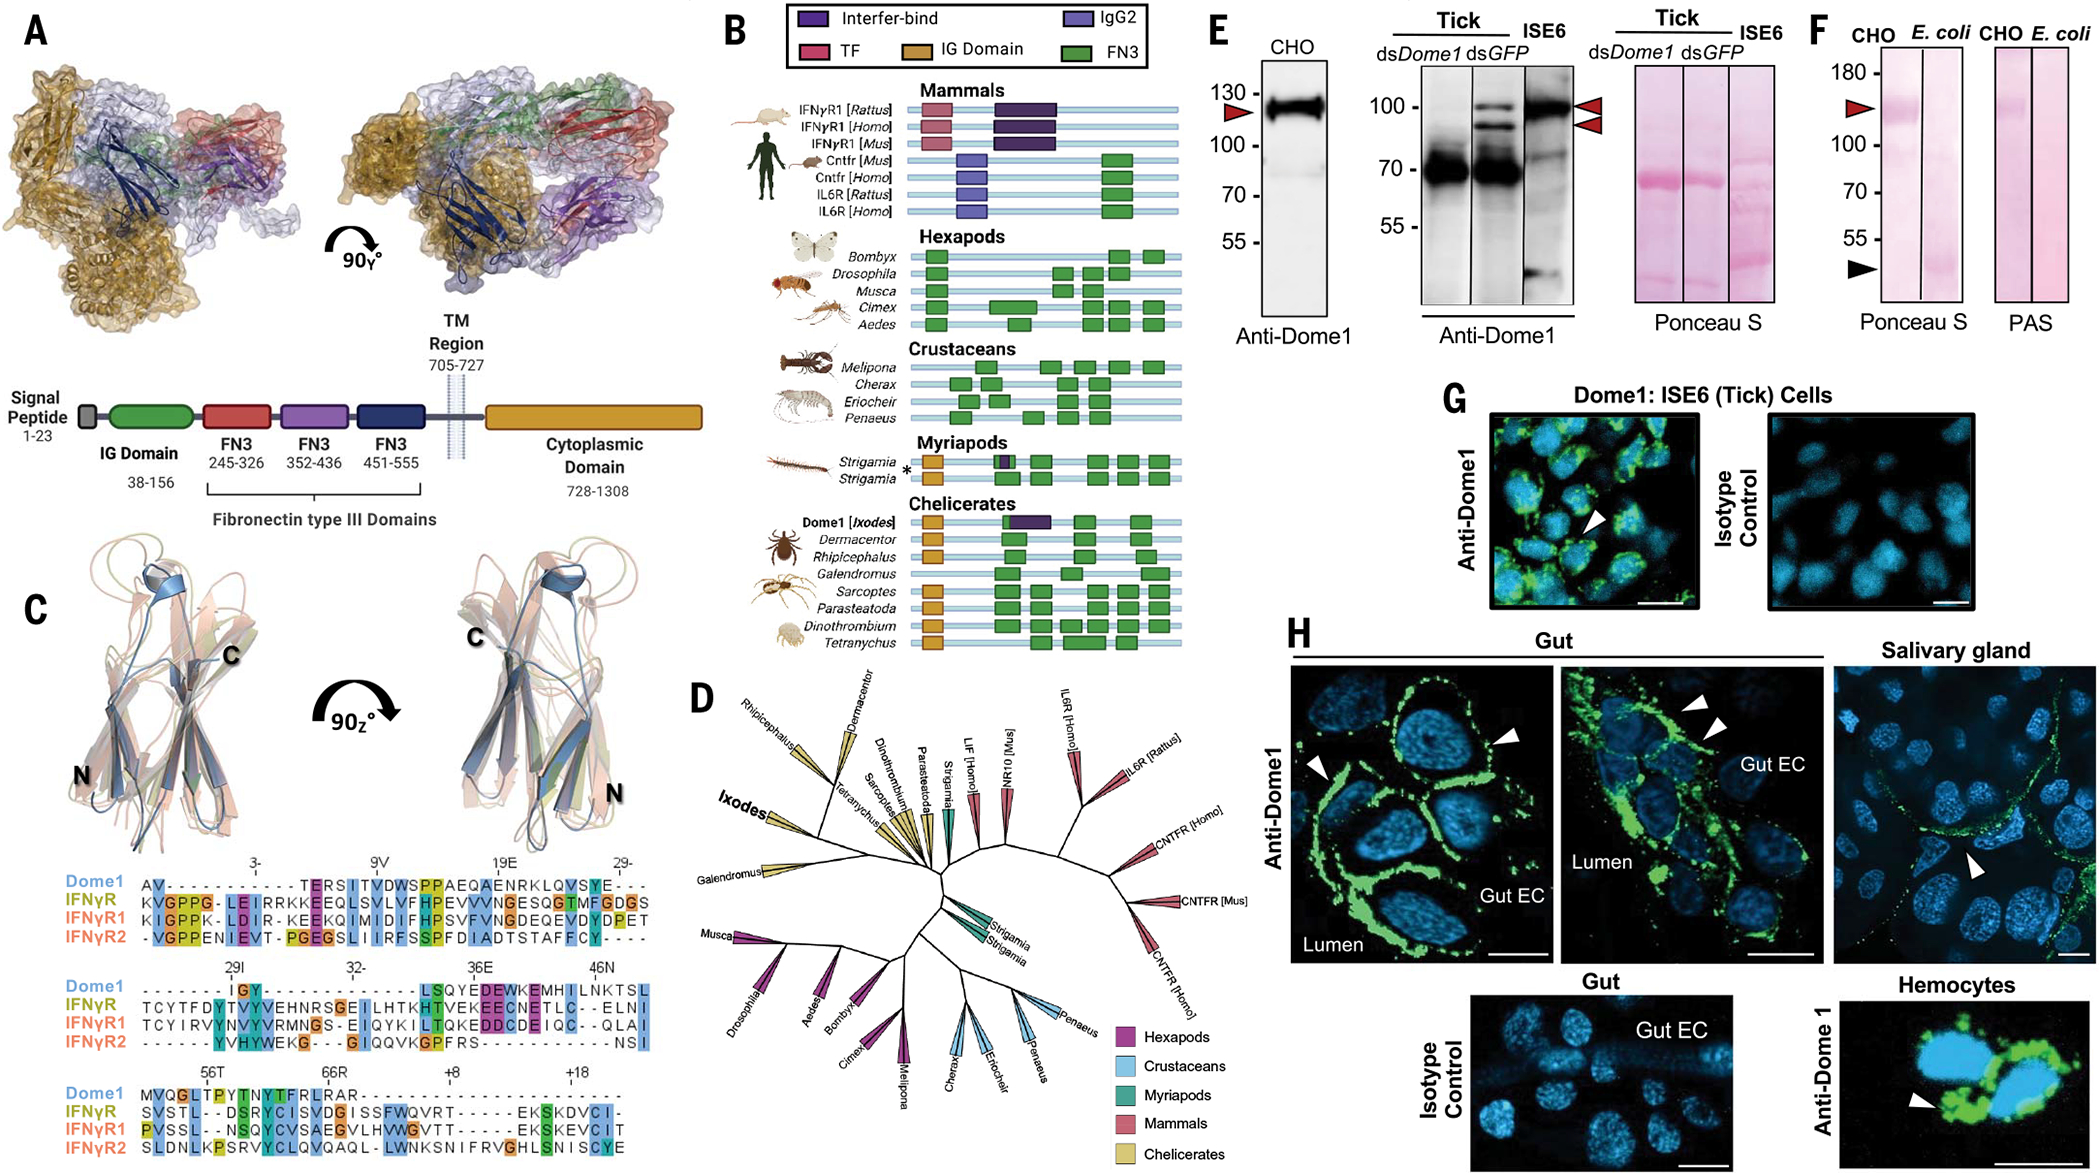
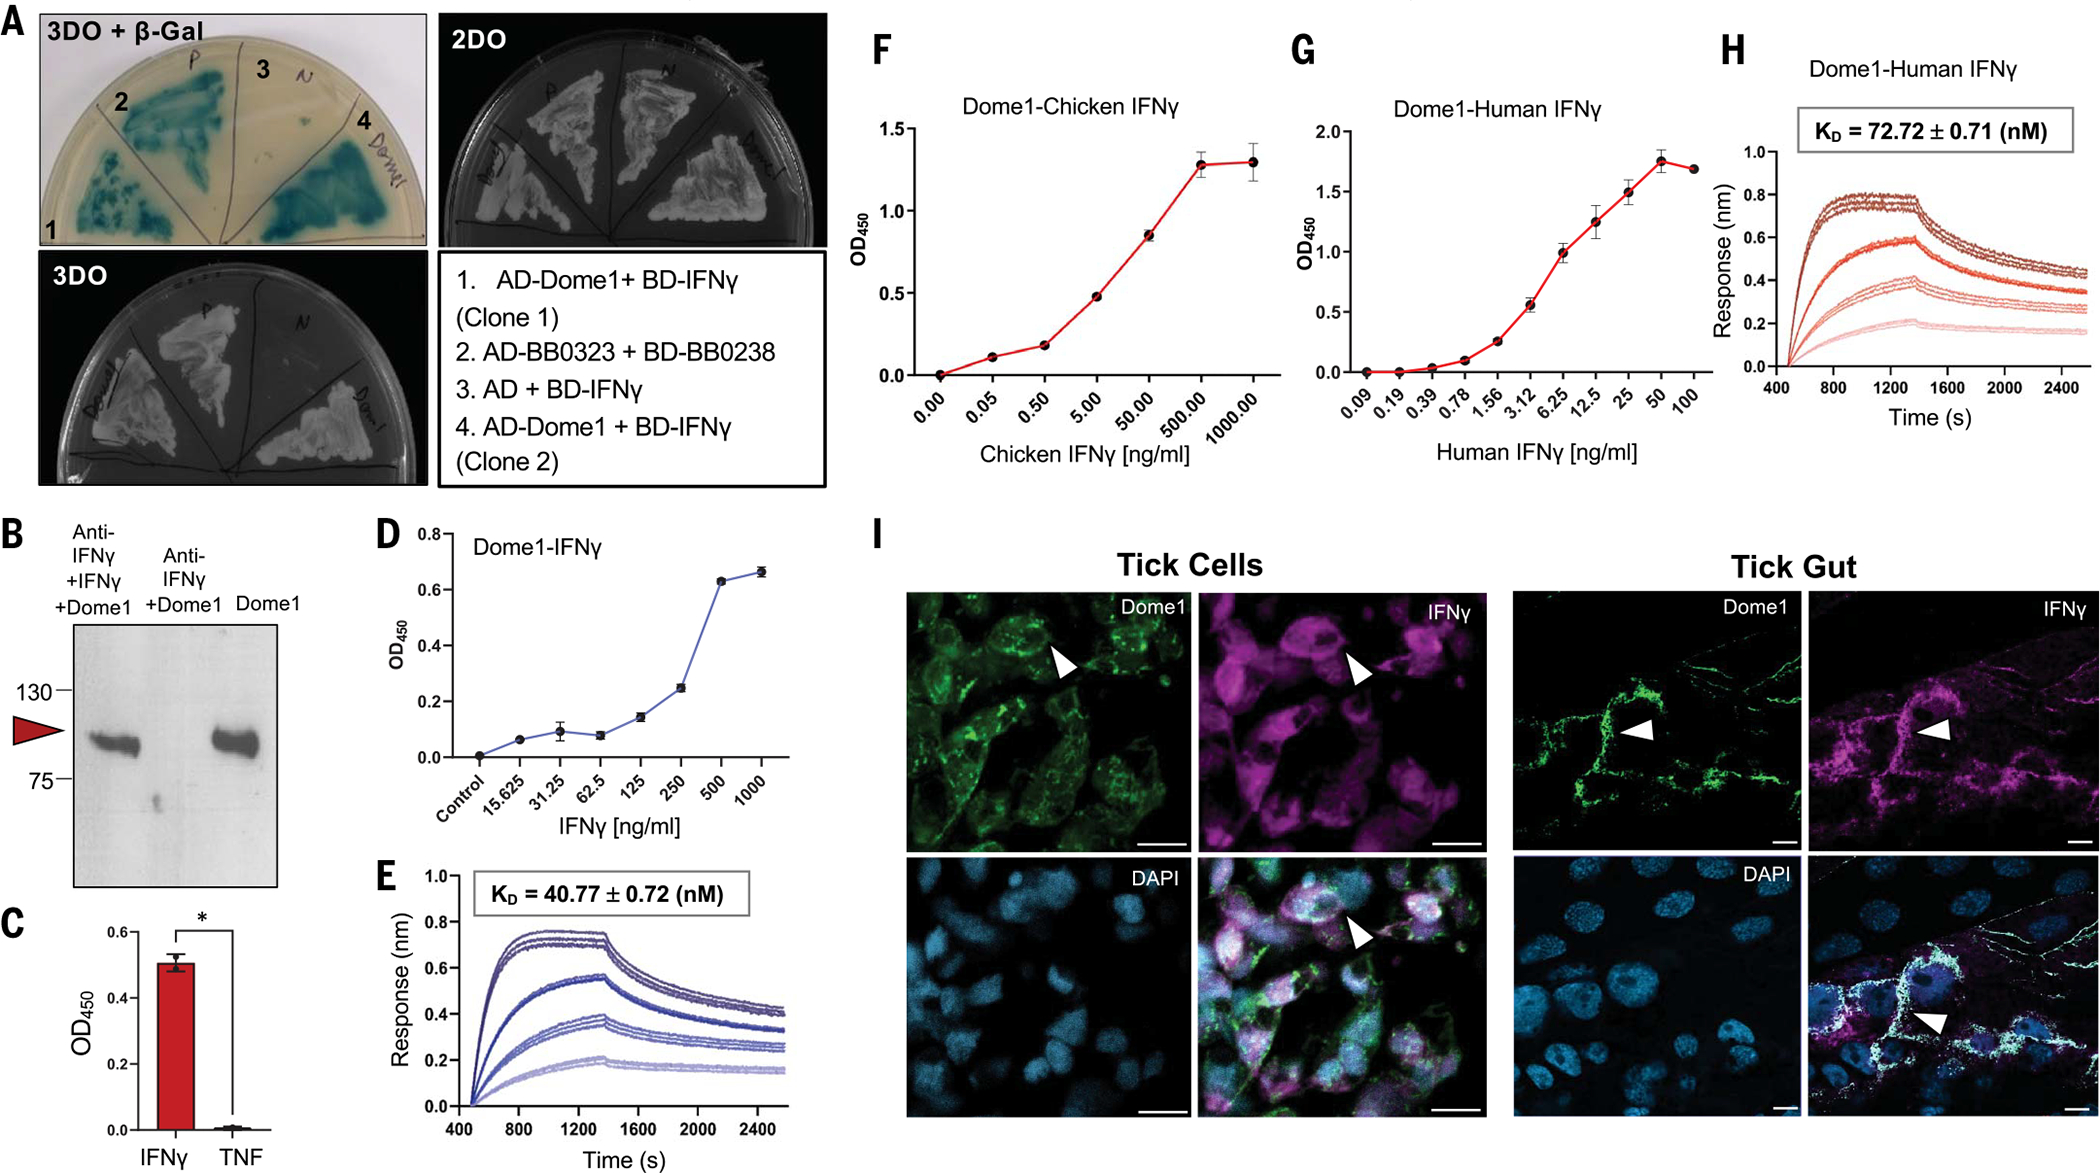
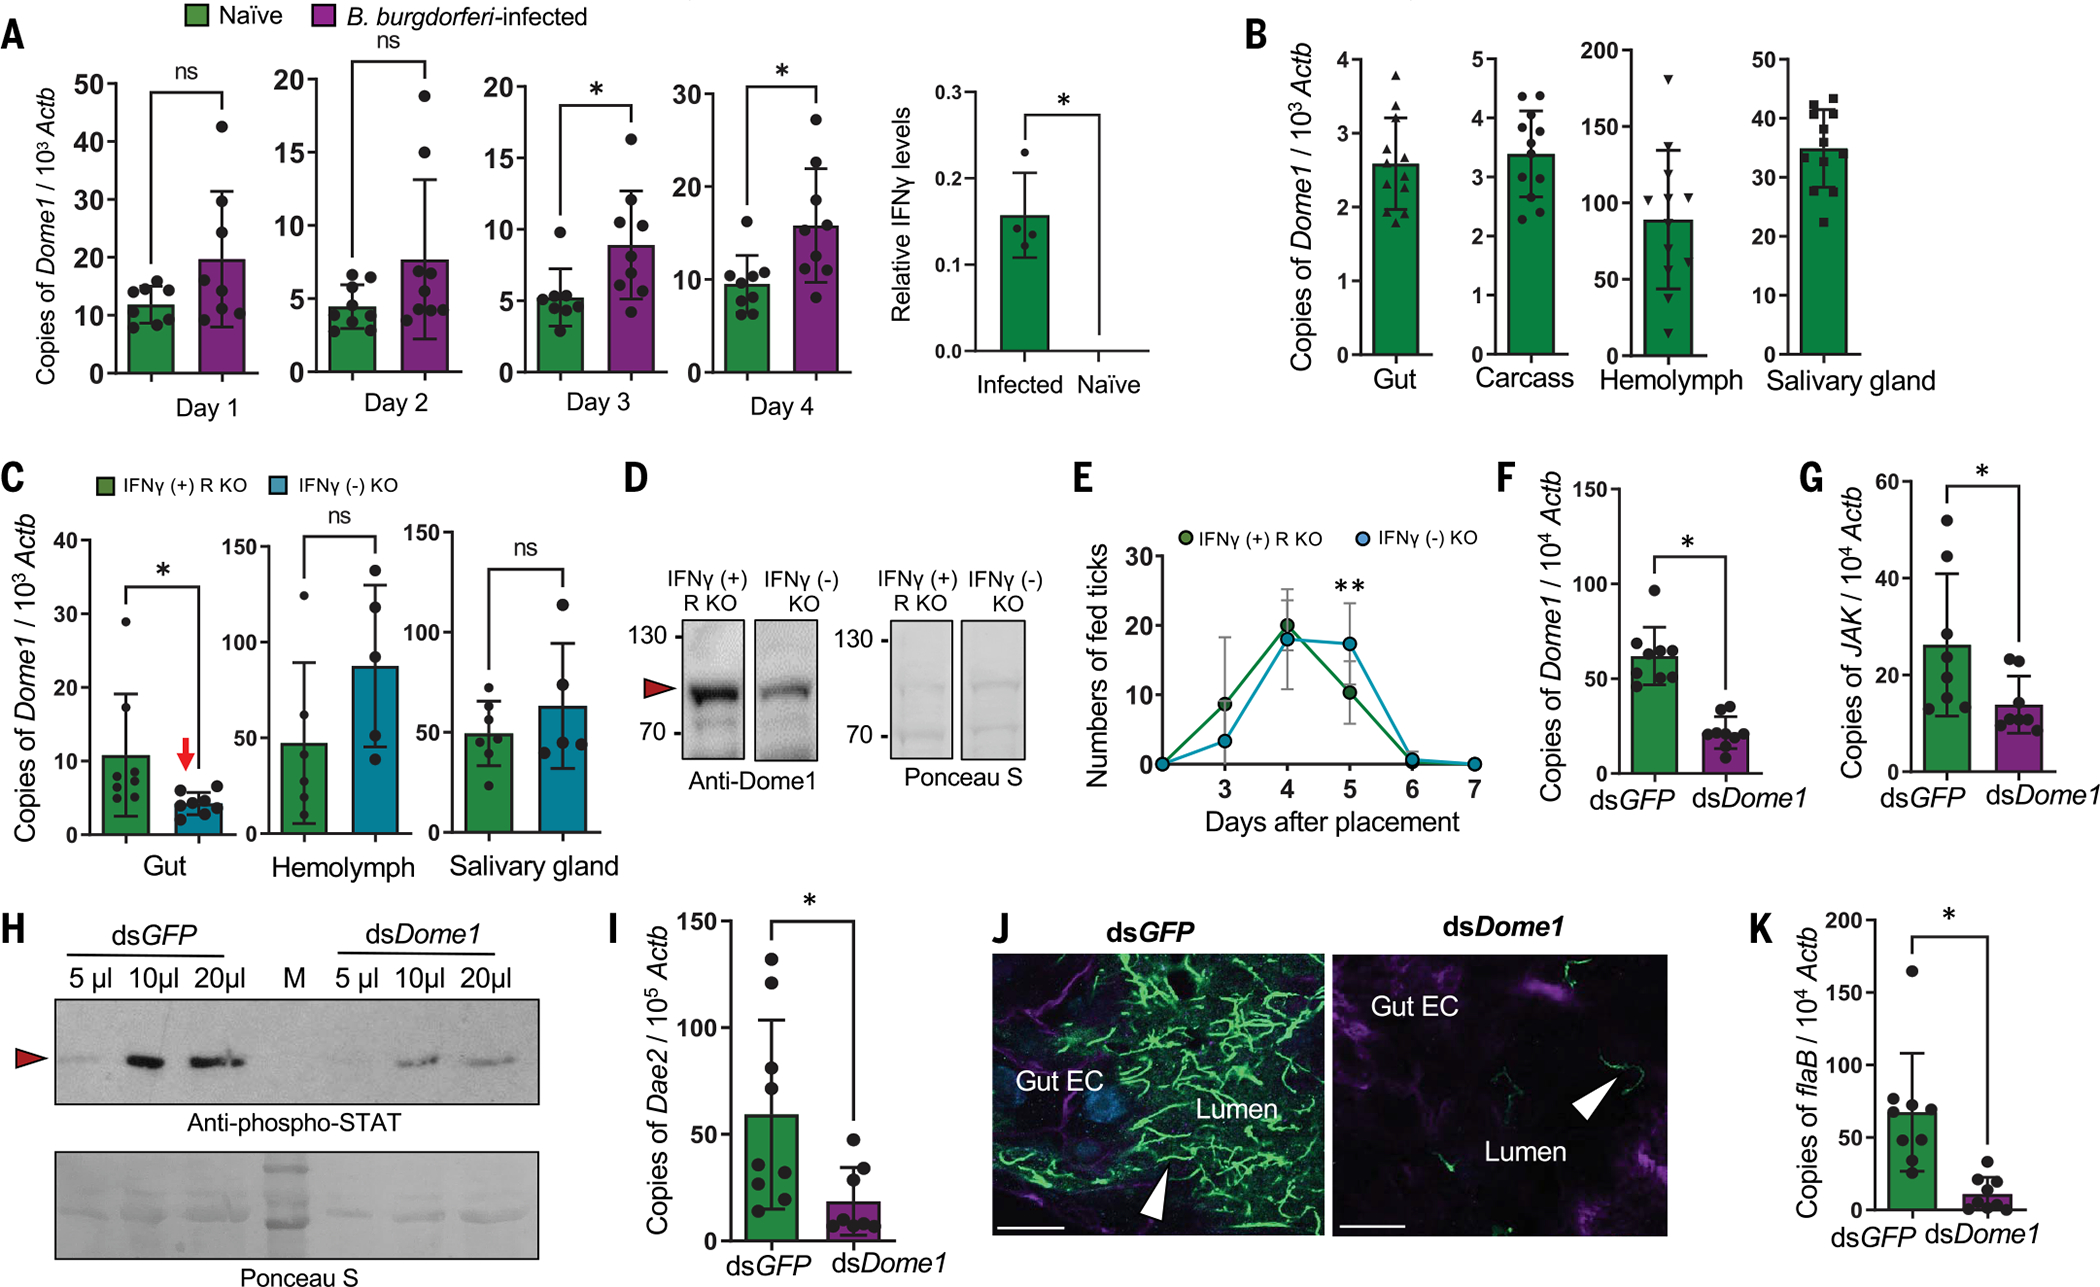
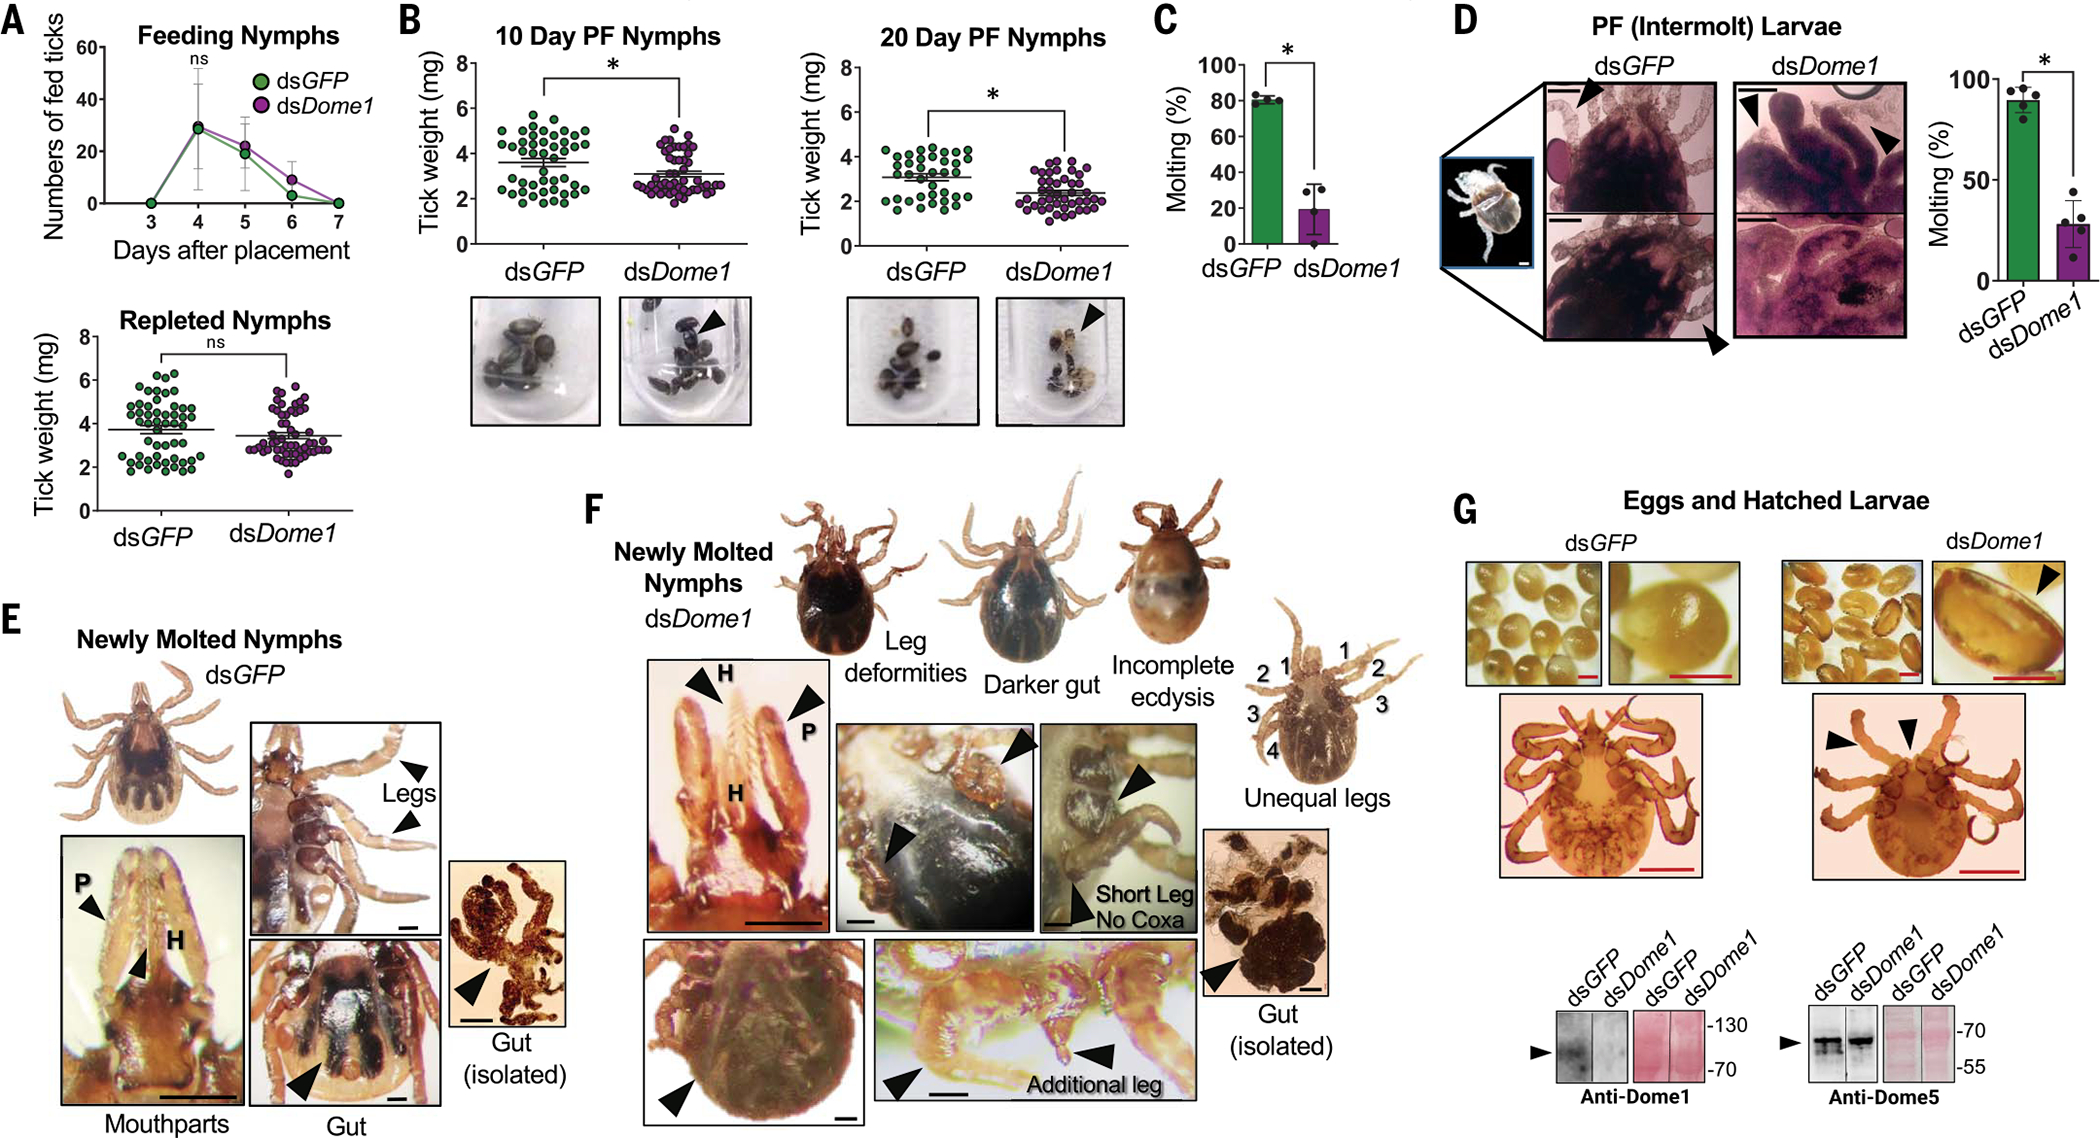
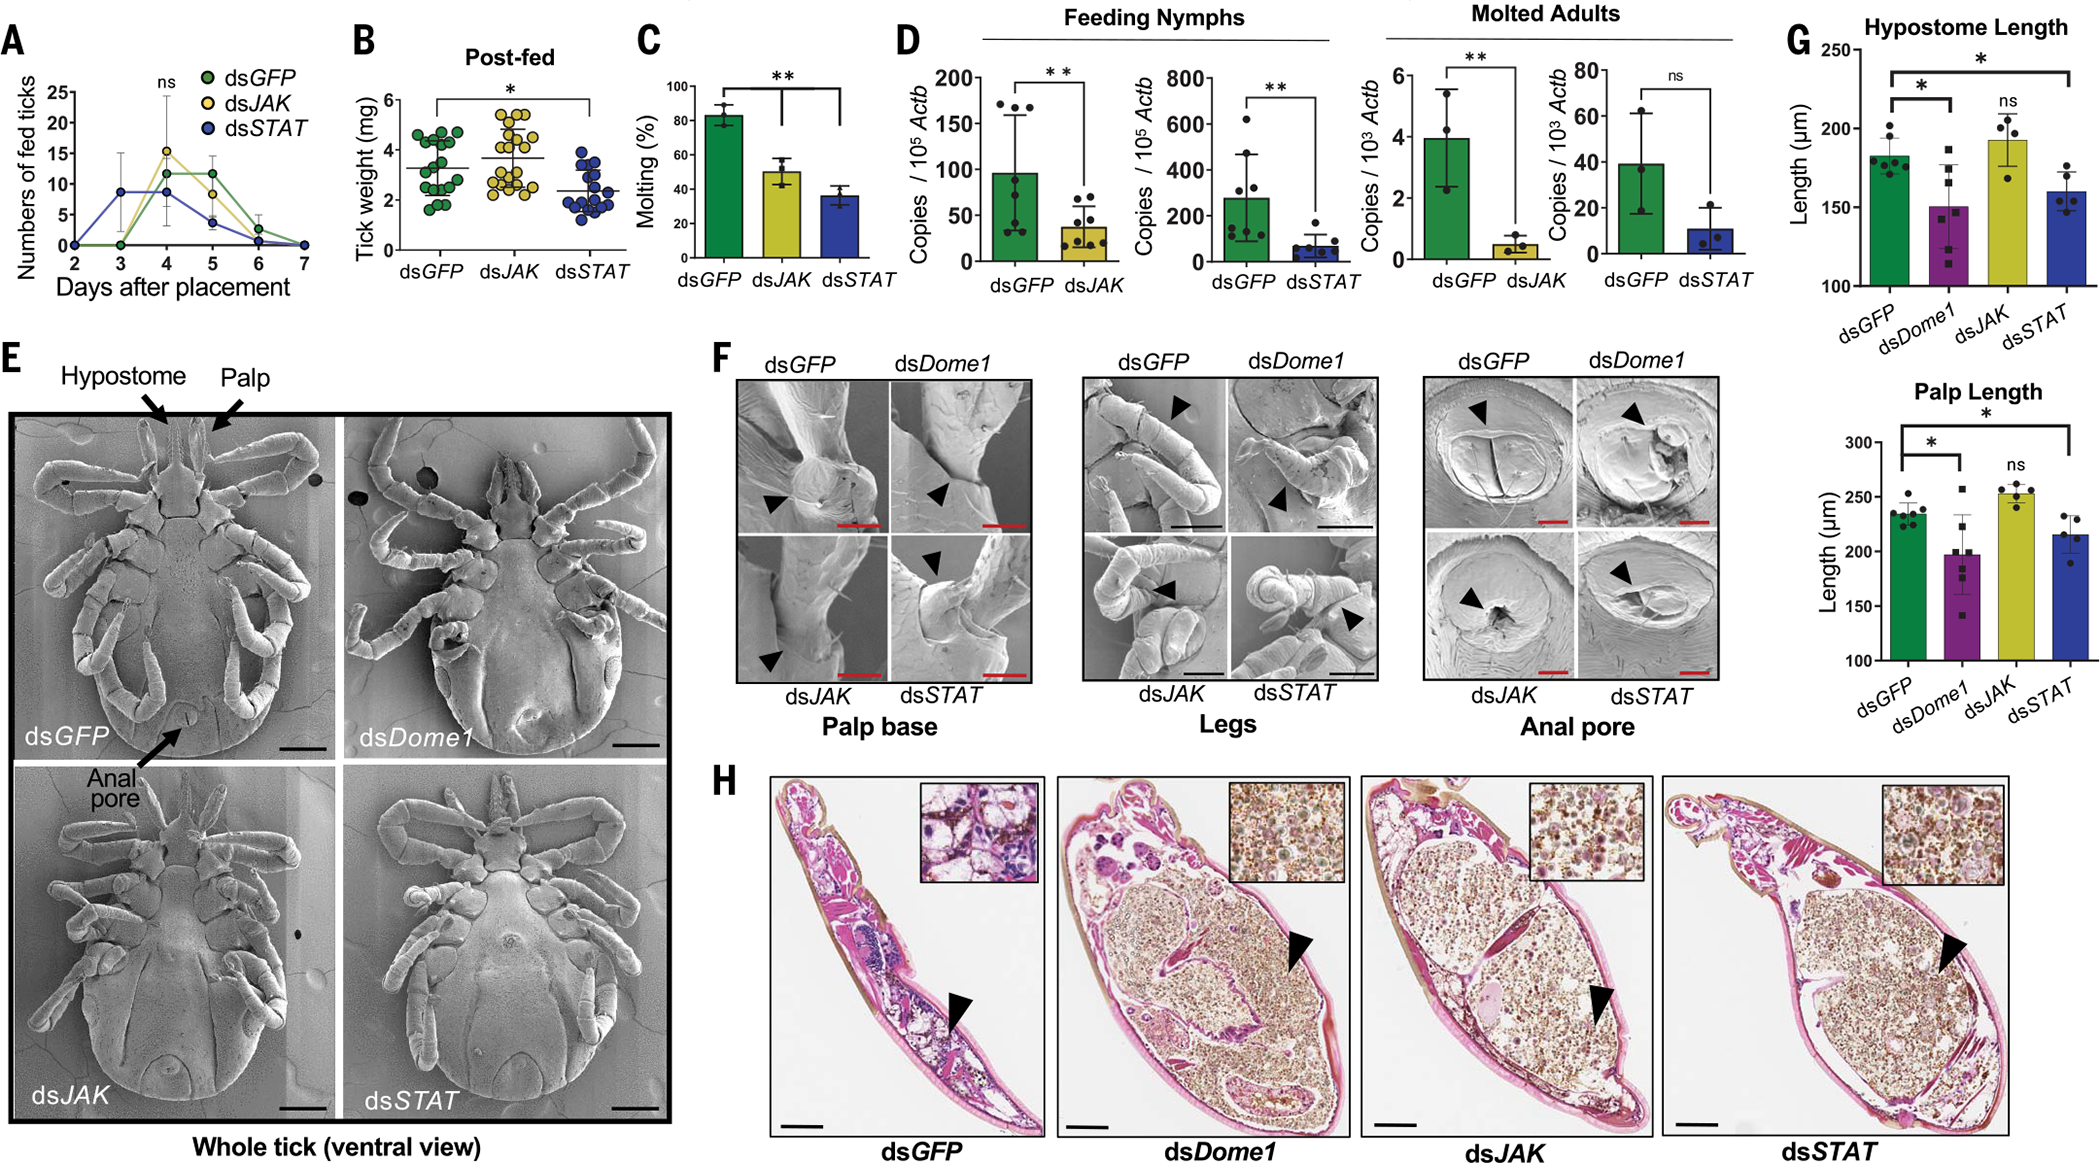
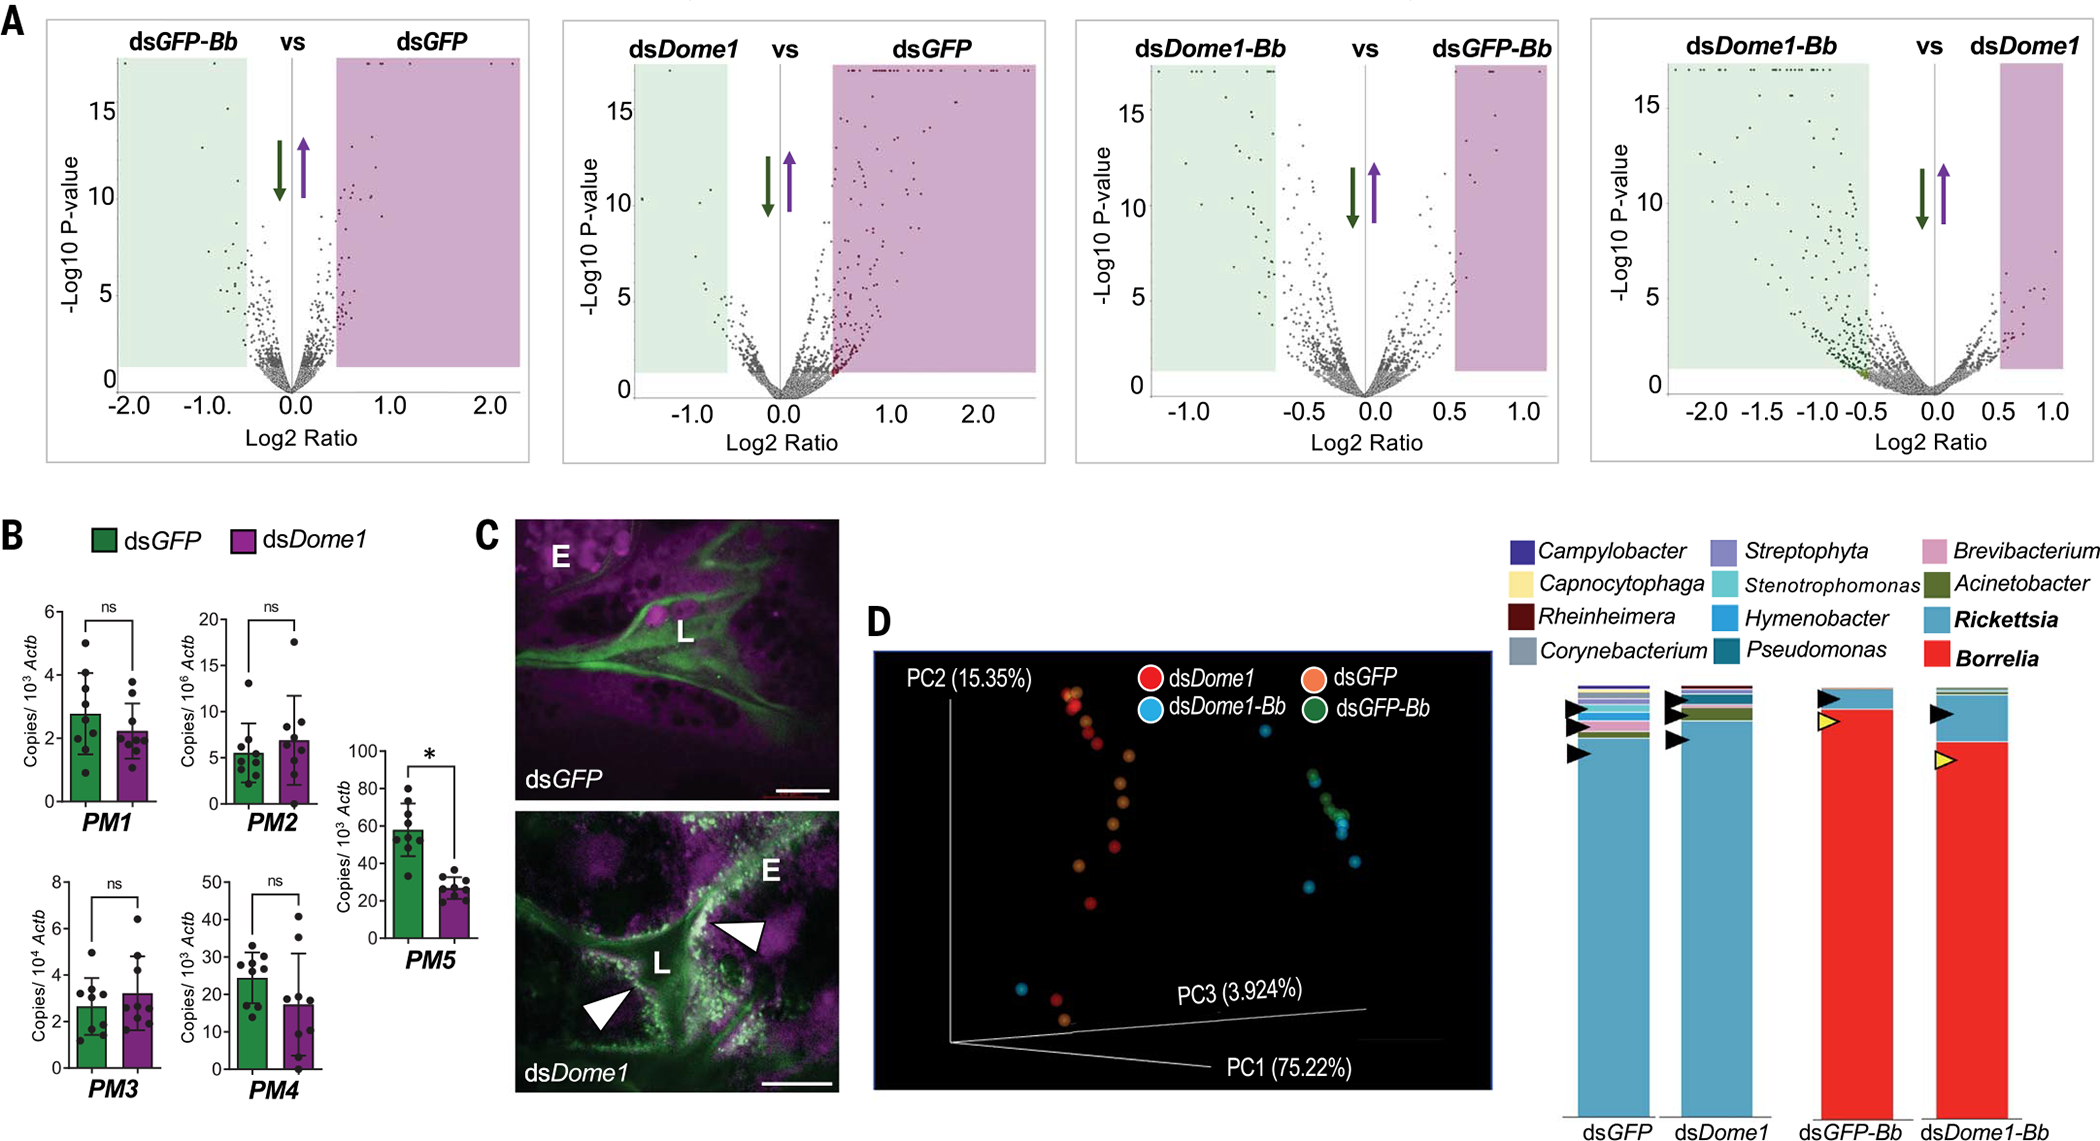
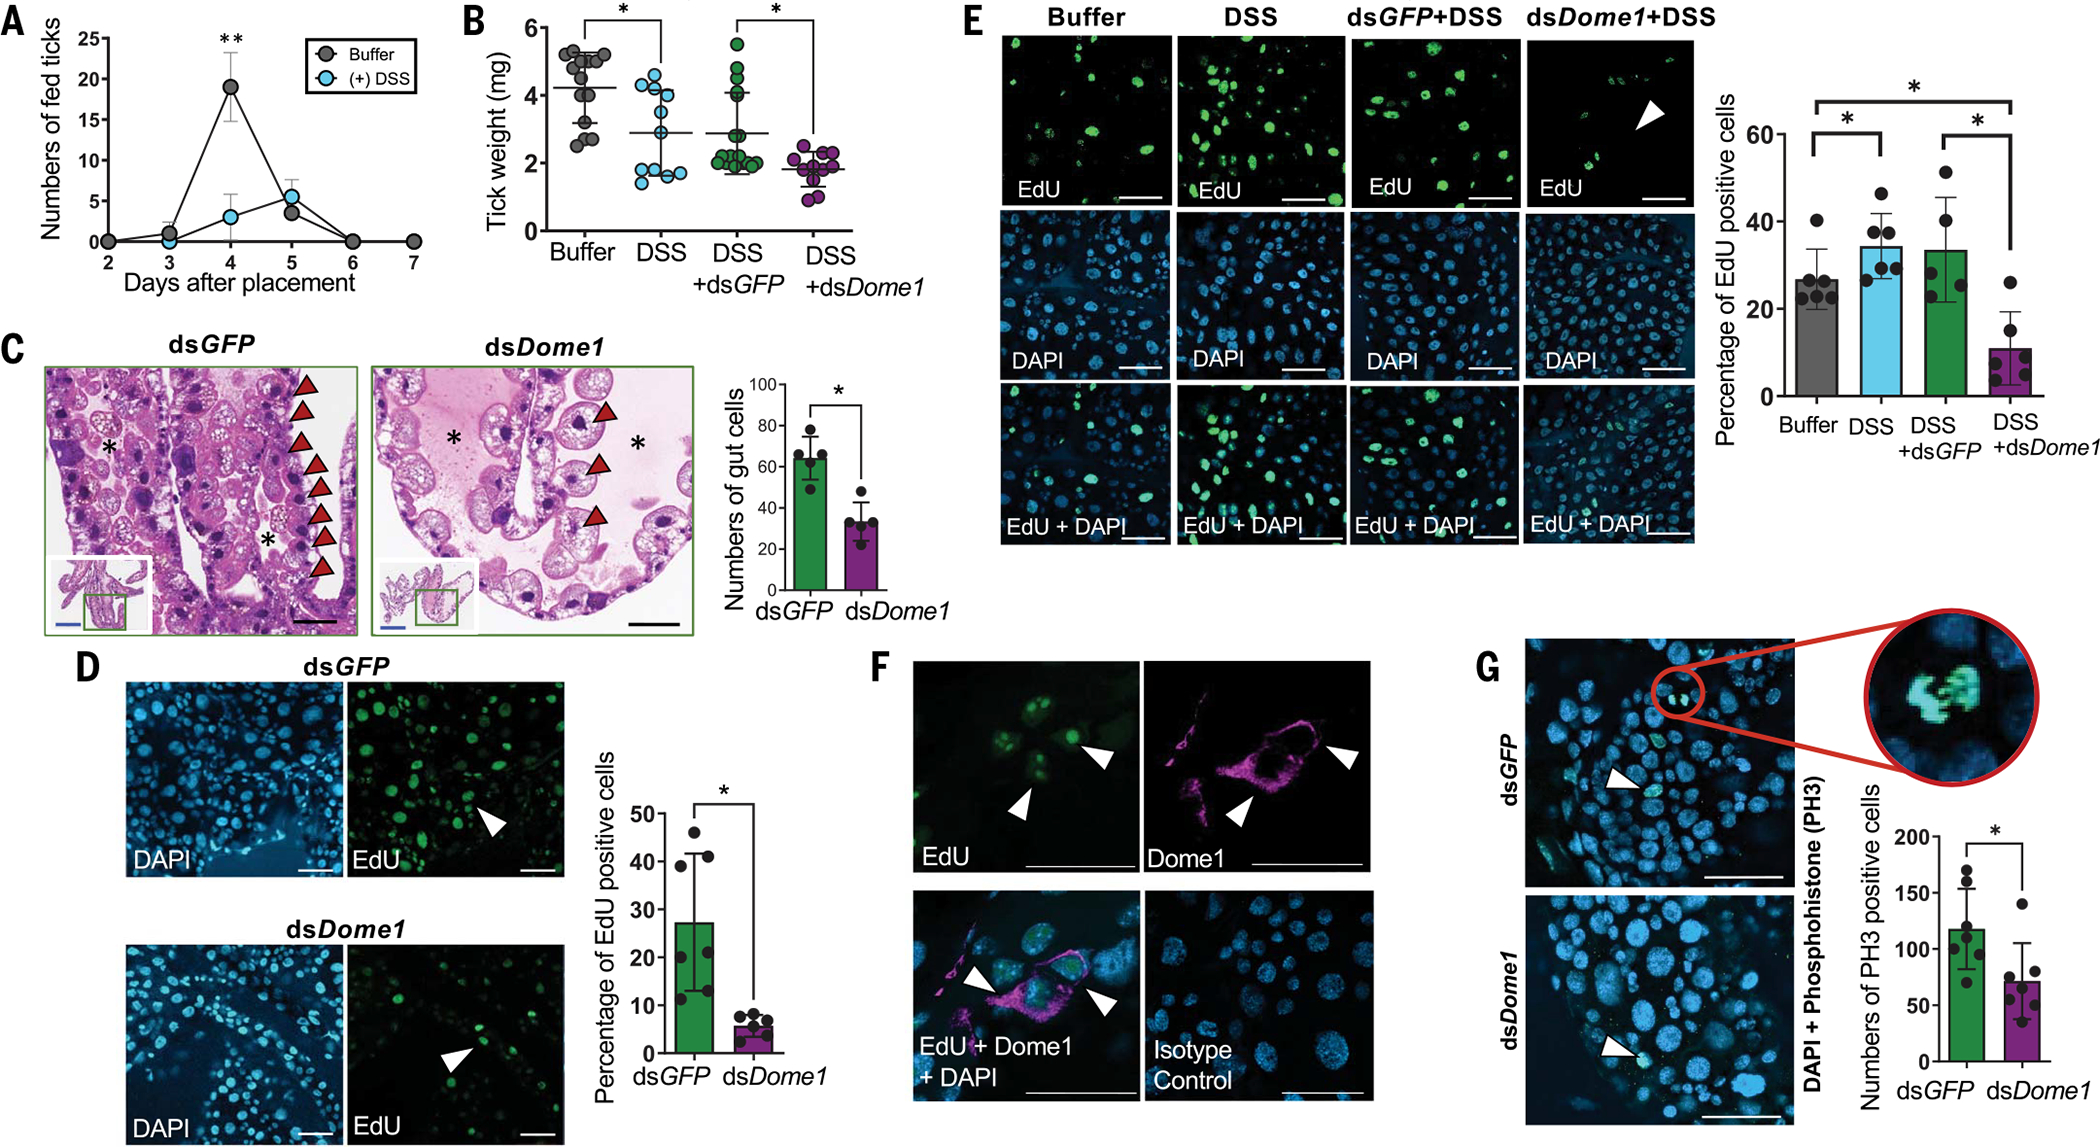
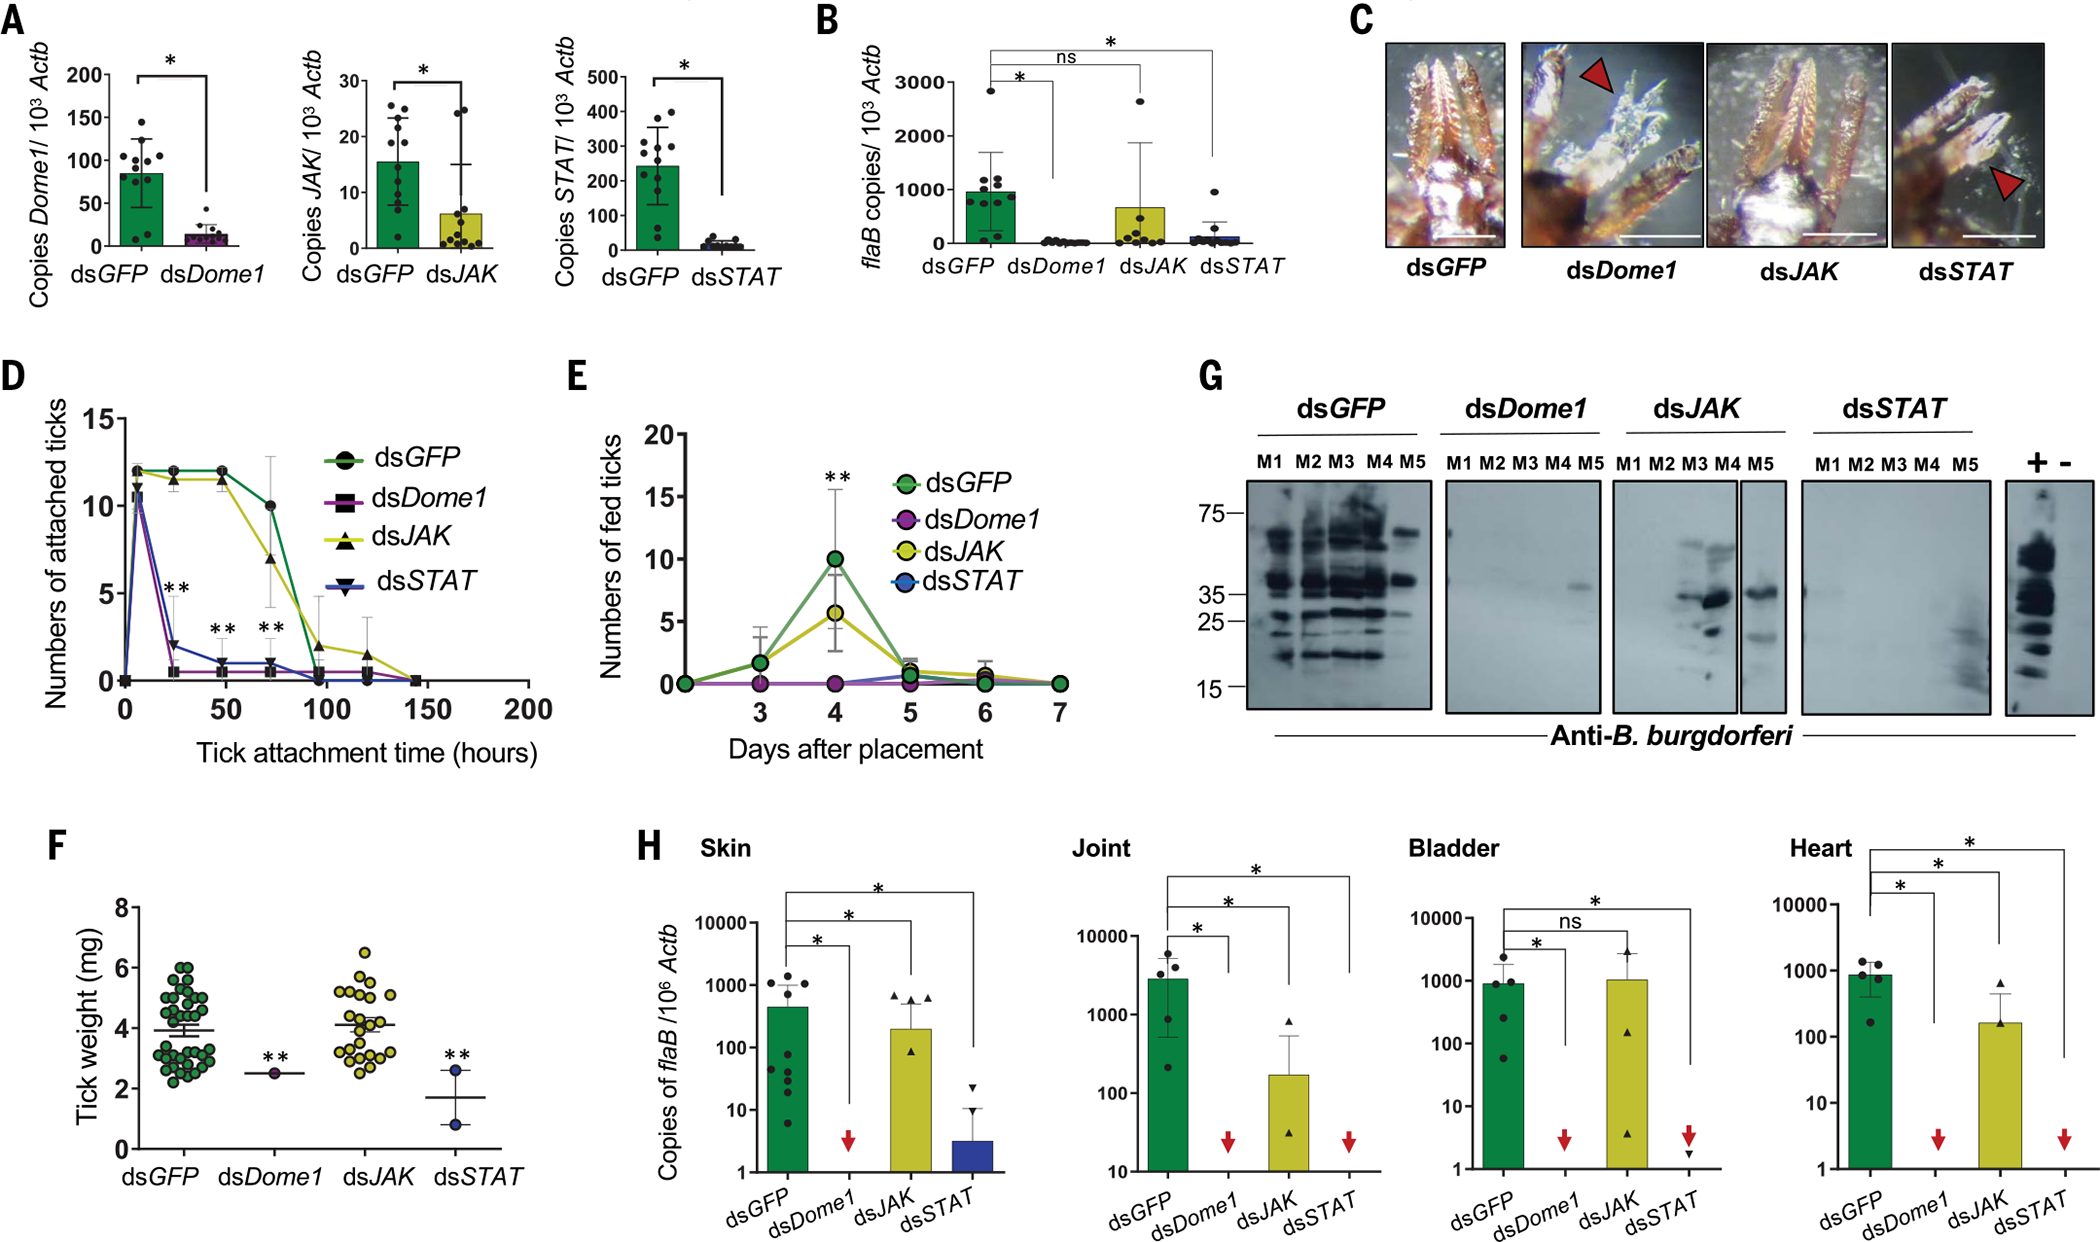
Ancestral signaling pathways serve critical roles in metazoan development, physiology, and immunity. We report an evolutionary interspecies communication pathway involving a central Ixodes scapularis tick receptor termed Dome1, which acquired a mammalian cytokine receptor motif exhibiting high affinity for interferon-gamma (IFN-γ). Host-derived IFN-γ facilitates Dome1-mediated activation of the Ixodes JAK-STAT pathway. This accelerates tick blood meal acquisition and development while upregulating antimicrobial components. The Dome1-JAK-STAT pathway, which exists in most Ixodid tick genomes, regulates the regeneration and proliferation of gut cells-including stem cells-and dictates metamorphosis through the Hedgehog and Notch-Delta networks, ultimately affecting Ixodes vectorial competence. We highlight the evolutionary dependence of I. scapularis on mammalian hosts through cross-species signaling mechanisms that dually influence arthropod immunity and development.


Conflict of interest statement

Competing interests: The authors declare no competing interests.

Figures

Fig. 1.
Fig. 1.. Identification and characterization of Ixodes scapularis Dome1.
(A) A homology-guided model of Dome1 and a diagram showing its features and domains. The domains [IG, three fibronectin type-III (FN3), transmembrane (TM), and cytoplasmic] are color-coded in the 3D structure (top) and schematic diagram (bottom). (B) Acquisition of mammalian interfer-bind motif in Dome1. Sequence comparison of identifiable domains in mammalian cytokine receptors and Dome proteins from selected species of arthropod subphyla are shown (asterisk: two orthologs in the same species). (C) Predicted structure and sequence alignment of the cytokine (interfer-bind)–binding motifs from Dome1 (dark-colored helices) and IFN-γ receptors (IFNGR) from mice and humans (light-colored helices). IFNGR (Mus musculus) and IFNGR1 and IFNGR2 (Homo sapiens) are superimposed to show alignment. (D) Phylogenetic tree of basal eukaryotic lineage highlighting conservation of Dome1 through arthropod subphyla and selected mammals. (E) Dome1 in a mammalian cell line (CHO), I. scapularis cell line (ISE6), and nymphal tick lysates from partially (24 hour) fed ticks. Lysates from control (dsGFP-injected) and Dome1-knockdown (dsDome1-injected) ticks were used. Unlike Dome1 in CHO or ISE6 cells, native Dome1 in whole tick lysates appeared as multiple proteins (arrowheads). Protein loading is shown by Ponceau S staining. (F) Dome1 is a glycoprotein. Electrophoresed full or truncated ectodomains (red and black arrowheads, respectively) were visualized by periodic acid–Schiff (PAS) staining. Protein loading is indicated by Ponceau S. (G) Dome1 localization (arrowhead) in tick cells. Nuclei were labeled with DAPI. (H) Detection of Dome1 in nymphal guts, salivary glands, and hemocytes by confocal immunofluorescence microscopy. More Dome1 immunoreactivity (arrowheads) was detectable on the surface of gut epithelial cells facing the lumen (upper left and middle panels) and the surface of hemocytes (lower right panel). Results are representative of three independent biological replicates. For [(G) and (H)], IgG from normal mouse sera served as isotype controls; Dome1: green; DAPI: blue; scale bar: 10 μm.
Fig. 2.
Fig. 2.. Dome1 specifically interacts with IFN-γ.
(A) Yeast two-hybrid assay demonstrates specific interaction between Dome1 and IFN-γ. Although all yeast cells grew on the double-dropout (2DO) media, only those with reporter gene activation grew on triple-dropout (3DO) media and expressed γ-Gal (blue color), confirming interactions between Dome1-IFN-γ or positive controls. (B) Anti-IFN-γ antibody pulls down soluble flag-tagged Dome1 in the presence of IFN-γ (left lane), but not in its absence (middle lane), confirming a Dome1–IFN-γ interaction. The pulled-down Dome1 was detected by immunoblot using anti-flag antibodies (right lane). (C) A microtiter well-based assay demonstrates a specific Dome1–mouse IFN-γ interaction. By contrast, no interaction was observed between mouse TNF and Dome1. Each data point shows the average of duplicate wells from one of three independent biological replicates, with similar results. (D) Dose-dependent binding of mouse IFN-γ to recombinant Dome1. The assay was performed as in (C), suggesting a dose-dependent increase in Dome1–IFN-γ interaction. (E) Bio-layer interferometry (BLI) sensorgrams of Dome1–IFN-γ interaction. The affinity constant of this interaction is presented above the sensorgram. (F and G) Dose-dependent binding of recombinant chicken IFN-γ (F) or human IFN-γ (G) to recombinant Dome1. These assays were performed as detailed in (C). (H) BLI sensorgrams of Dome1–human IFN-γ interaction, confirming a high-affinity interaction with human IFN-γ, analogous to those highlighted in the mouse BLI data. (I) Dome1 and IFN-γ colocalization on the surface of tick cells (left panel) and in tick gut cells (right panel). Recombinant mouse IFN-γ was incubated with ISE6 cells or dissected tick guts and probed with specific antibodies against Dome1 and IFN-γ, followed by FITC- or Alexa Fluor 568-labeled secondary antibodies. In both tick cells and gut tissues, IFN-γ colocalized with endogenous Dome1 protein (arrows). Error bars denote mean ± standard deviation (SD). Results are representative of 2 to 4 independent experiments. White bar: 10 μm. *P < 0.05, Student’s t test.
Fig. 3.
Fig. 3.. Dome1, induced by host-derived IFN-γ, regulates tick borreliacidal responses through the JAK–STAT pathway.
(A) Dome1 is induced during tick engorgement and B. burgdorferi infection. The reverse transcription-quantitative polymerase chain reaction (RT-qPCR) analysis of Dome1 transcripts in nymphs fed on naïve or infected mice (left panel). The right panel shows IFN-γ levels in murine blood. (B) Expression of Dome1 in various tick tissues. Nymphs parasitized mice for 48 hours, and tissues were processed for Dome1 transcripts and normalized against tick Actb levels. (C) Ifng deficiency down-regulates Dome1 in tick guts (arrow). Groups of three Ifngr1-knockout mice, which produce the cytokine (IFN-γ + R KO) or Ifng-knockout mice (IFN-γ −KO) were parasitized by nymphs (30 ticks per group) for 48 hours. Dome1 transcripts were analyzed in tick tissues. (D) IFN-γ deficiency downregulates Dome1 in fed tick gut. Protein loading is indicated by Ponceau S staining. (E) Influence of host IFN-γ on blood meal acquisition by ticks. In the absence of IFN-γ, engorgement time is delayed at day 5, when nymphs ingest the major portion of the blood meal. **P < 0.05, determined using two-tailed Student’s t test. (F) RNAi-mediated Dome1 knockdown by microinjection of unfed nymphs (20 ticks per group), which then fed on Borrelia-infected mice for 48 hours. Dome1 mRNA levels were measured by RT-qPCR. (G to I) Dome1 knockdown reduces levels of JAK transcripts (G); STAT phosphorylation (“M” and arrowhead denote molecular weight markers and phosphorylated STAT protein, respectively) (H); and Dae2 transcripts (I) in 48-hour-fed ticks. (J) Dome1 knockdown affects colonization of B. burgdorferi (green, arrowhead) in the tick gut; nuclei and actin are labeled with DAPI (blue) and rhodamine phalloidin (violet). The image represents one of three biological replicates with similar results. (K) RT-qPCR analysis of B. burgdorferi, assessed by measuring flaB transcripts normalized to Actb levels. Results represent two to five independent experiments, where quantitative data are shown as individual data points; error bars show the means ± SDs (n = 9 to 30). White bar: 10 μm. *P < 0.05, determined using two-tailed Mann-Whitney U test; n.s., not significant.
Fig. 4.
Fig. 4.. Dome1 is essential for optimal tick metamorphosis.
(A) Host blood meal acquisition in Dome1-knockdown ticks. Number of fed ticks (left panel) and tick engorgement weights (right panel) are shown. (B) Intermolt ticks. Compared with controls, Dome1-knockdown post-fed (PF) ticks displayed lower weights (upper panels) and different body colors with exposed exuviae or even death (lower panels, arrowheads). (C) Impairment of molting success in Dome1-knockdown nymphal ticks, as assessed by the percentage of molted ticks. (D) Dome1 silencing in fed larvae impairs development and molting. The control intermolt ticks (left panels) at 20 days post-fed (PF) reveal newly formed legs (arrowheads) which were absent or malformed in Dome1-knockdown groups (right panels, arrows). The percentage of molted ticks is shown in the rightmost panel. (E and F) Compared with controls (E), transstadial Dome1-knockdown ticks (F) showed deformities (arrows), including in hypostome (H) and palps (P), uneven legs with unequal lengths, stunted legs without coxa, and darker abdomens with incomprehensible gut diverticula. (G) Dome1 is essential for fecundity and larval development. The data represent an experiment where 80 adult ticks were microinjected with dsDome1 or dsGFP (control) RNA and allowed to engorge on groups of rabbits. Dome1 deficiency resulted in abnormal egg and larval development (top right panels), compared with the controls (top left panels). Dome1 knockdown was sustained in the mature eggs, which were analyzed for Dome1 (bottom left panels) or Dome5 (bottom right panels) protein levels by immunoblot. See additional results for hatched larvae in fig. S11. Results are representative of two to five independent experiments where quantitative data are shown as individual data points; error bars show the means ± SDs (n = 6 to 50). Black or white bar: 100 μm; red bar: 50 μm. *P < 0.05, determined using two-tailed Mann-Whitney U test; n.s., not significant.
Fig. 5.
Fig. 5.. The Ixodes JAK–STAT pathway contributes to Dome1-mediated tick metamorphosis.
(A) Knockdown of STAT, but not JAK, impairs tick attachment. Ticks (25 nymphs per group) were microinjected with target dsRNA and placed on naïve mice. Detached fed ticks were enumerated. (B) STAT knockdown impairs tick weight. Ticks were weighed after feeding to repletion. (C) Molting success of knockdown ticks. Compared with controls, a reduction in molting was evident in JAK- and STAT-knockdown ticks. **P < 0.05, determined using two-tailed Student’s t test. (D) RNAi-mediated JAK and STAT knockdown effects are maintained transstadially. The ticks were analyzed as 48-hour-fed nymphs and as molted adults. **P < 0.05, determined using two-tailed Student’s t test. (E) Scanning electron micrographs of knockdown ticks. Unlike normal structures in control nymphs (arrows), Dome1-, JAK-, and STAT-knockdown ticks presented abnormal appearances, most noticeably in their malformed mouthparts, legs, and anal pores. (F) Close-up view of the morphological defects highlighted in (E), indicating defective palp bases, legs, and anal pores. (G) Quantitative assessment of morphological defects highlighted in (E), denoting shorter hypostome and palps in Dome1- and STAT-knockdown ticks. Additional results are presented in figs. S10 and S12. (H) Histological analysis of ticks. Engorged larvae were subjected to standard H&E staining. Enlarged and abnormally developed bodies surrounding a large bolus of improperly digested blood meal were seen in Dome1-, JAK-, or STAT-deficient ticks. The inset shows a magnified view of the gut contents (arrow), revealing the presence of the remnants of blood cells and microbes, which are predominant in all groups except for the control (dsGFP) ticks. Results are representative of two to three independent experiments where quantitative data are shown as individual data points; error bars show the means ± SDs (n = 3 to 30). Black bar: 100 μm; red bar: 20 mm. *P < 0.05, determined using two-tailed Mann-Whitney U test; n.s., not significant.
Fig. 6.
Fig. 6.. Dome1 supports gut homeostasis in feeding ticks.
(A) Differential production of gut proteins in Dome1-knockdown ticks, in the presence or absence of B. burgdorferi, analyzed as follows: (i) B. burgdorferi-infected versus naïve control (dsGFP-Bb versus dsGFP), (ii) naïve Dome1-knockdown versus naïve control (dsDome1 versus dsGFP), (iii) B. burgdorferi-infected Dome1-knockdown versus B. burgdorferi-infected naïve control (dsDome1-Bb versus dsGFP-Bb), and (iv) B. burgdorferi-infected Dome1-knockdown versus naïve Dome1-knockdown (dsDome1-Bb versus dsDome1). The down- and up-regulated proteins are indicated by green or purple areas, respectively (see tables S1 to S4). (B) RT-qPCR assays show the down-regulation of a peritrophin gene, PM5, in Dome1-knockdown ticks. (C) Alteration of PM permeability in Dome1-knockdown ticks. Confocal microscopy showed the guts of 48-hour-fed nymphs, which had been microinjected with either dsDome1 or dsGFP RNA and were then capillary fed with fluorescein-conjugated 500,000 (green) or rhodamine red-conjugated 10,000 (violet) MW dextran molecules. The fluorescent beads are marked by arrowheads. L, lumen; E, epithelial cells. (D) 16S rRNA amplicon analysis of gut microbiota in Dome1-knockdown (dsDome1) and control (dsGFP) ticks, in the presence or absence of B. burgdorferi (32 nymphs per group), indicates alterations in microbial composition. The left panel denotes the principal coordinate analysis of weighted UniFrac distances of microbial communities; the right panel shows the genus-specific total bacterial abundance of Dome1-knockdown and control ticks in naïve (dsGFP versus dsDome1) or infected (dsGFP-Bb versus dsDome1-Bb) conditions. In naïve ticks, Dome1 deficiency altered the abundance of selected microbes (black arrowheads). In infected ticks, Dome1 knockdown decreased the abundance of Borrelia and enhanced the level of Rickettsia (yellow and black arrowheads, respectively). Results are representative of two to three independent experiments where quantitative data are shown as individual data points; error bars show the means ± SDs (n = 9 to 20). White bar: 20 μm. *P < 0.05, determined using two-tailed Mann-Whitney U test; n.s., not significant.
Fig. 7.
Fig. 7.. Dome1 maintains gut homeostasis through tissue regeneration and stem cell proliferation.
(A) Incomplete blood meal engorgement after induction of experimental colitis in DSS-treated ticks. **P < 0.05, determined using two-tailed Student’s t test. (B) Dome1 assists in tissue regeneration after injury. Ticks injected with DSS and coinoculated with dsDome1 RNA showed reductions in weight compared with the DSS-injected controls (dsGFP). (C) Dome1 maintains optimal gut cell population, as assessed by histology. The middle panel denotes the altered distribution of gut cells in Dome1-knockdown nymphs, showing cellular reduction (arrowheads) and an enlarged lumen (asterisk), compared with controls (left panel). The insets show the whole gut diverticula, with green boxes denoting the areas of magnified images. The right panel shows the microscopic enumeration of gut cells. (D) Cell proliferation in nymphal guts. Dome1-knockdown and control (dsGFP) nymphs fed on naïve mice for 72 hours to initiate gut cell proliferation. Proliferative EdU+ cells are marked by arrows (middle panels). The right panel shows the quantification of EdU+ cells. (E) Dome1 is essential for cell proliferation after gut injury. Nymphs were microinjected with buffer or DSS, in the presence or absence of dsRNA (dsDome1 or dsGFP). DSS-triggered gut cell proliferation activity was impaired by Dome1 deficiency (left panel, arrow), also shown by a reduction in cell counts (right panel). (F) Dome1 is expressed in proliferative cells. EdU+ cells were positive for Dome1 expression (violet). (G) Dome1 regulation of proliferative cells includes gut stem cells. Dome1-knockdown or control ticks fed on mice for 48 hours and were stained with anti-phospho-histone H3 (PH3) antibody (left panels, arrow), and enumerated (right panel). The circle represents a dividing stem cell nucleus in the control tick. Results are representative of two to three independent experiments where quantitative data are shown as individual data points; error bars show the means ± SDs (n = 6 to 25). For [(D) to (G)], nuclei are labeled with DAPI (blue) or EdU (green); white or black bars: 50 μm; blue bar: 300 μm. *P < 0.05, determined using two-tailed Mann-Whitney U test.
Fig. 8.
Fig. 8.. Ixodes Dome1 and JAK–STAT signaling pathway is required for optimal blood meal engorgement of B. burgdorferi-infected ticks and spirochete transmission to mice.
(A) Transstadial knockdown of Dome1, JAK, and STAT in infected unfed nymphs. Larvae that had engorged on B. burgdorferi-infected mice were microinjected with target dsRNA and allowed to molt. Transcripts in the infected nymphs were analyzed by RT-qPCR. (B) B. burgdorferi levels in unfed nymphs, as measured by the RT-qPCR assessment of flaB transcripts normalized against tick Actb levels. (C) Damaged tick mouthparts. Unlike the control or JAK-knockdown ticks, the detached Dome1- or STAT-knockdown ticks displayed distorted mouthparts (arrowheads). (D to F) The feeding parameters for the various groups are presented as the tick attachment time (D), number of fed ticks (E), and engorgement weight (F). Asterisks denote significant differences between dsDome1 or dsSTAT to other groups. **P < 0.05, determined using two-tailed Student’s t test. (G and H) Assessment of pathogen transmission to mice. 12 days after tick feeding, infection in individual animals was assessed by sera immunoblotting (G), or RT-qPCR assays (H) using one tissue sample per organ, except for proximal and distant skin samples relative to tick bite sites, by measuring copies of B. burgdorferi flaB transcripts normalized against mouse Actb levels. Arrows indicate murine tissue samples in dsDome1 or dsSTAT groups where flaB transcripts remain undetectable. For immunoblotting, sera from naïve mice and mice that were previously infected with B. burgdorferi were used as negative (−) and positive (+) controls, respectively. Loading controls are presented in fig. S12. Results are representative of three independent experiments where quantitative data are shown as individual data points; error bars show the means ± SDs (n = 9 to 36). White bar: 100μμm. *P < 0.05, determined using two-tailed Mann-Whitney U test; n.s., not significant.

References

    1. Parola P, Raoult D, Ticks and tickborne bacterial diseases in humans: An emerging infectious threat. Clin. Infect. Dis. 32, 897–928 (2001). doi: 10.1086/319347 - DOI - PubMed
    1. Perner J et al., RNA-seq analyses of the midgut from blood- and serum-fed Ixodes ricinus ticks. Sci. Rep. 6, 36695 (2016). doi: 10.1038/srep36695 - DOI - PMC - PubMed
    1. McCoy KD, Léger E, Dietrich M, Host specialization in ticks and transmission of tick-borne diseases: A review. Front. Cell. Infect. Microbiol. 3, 57 (2013). doi: 10.3389/fcimb.2013.00057 - DOI - PMC - PubMed
    1. Kitsou C, Fikrig E, Pal U, Tick host immunity: Vector immunomodulation and acquired tick resistance. Trends Immunol. 42, 554–574 (2021). doi: 10.1016/j.it.2021.05.005 - DOI - PMC - PubMed
    1. WHO, Vector-borne diseases. https://www.who.int/mediacentre/factsheets/fs387/en/, (WHO, 2016).

MeSH terms