. 2023 Feb:138:105657.
doi: 10.1016/j.jmbbm.2023.105657. Epub 2023 Jan 5.

A Bayesian constitutive model selection framework for biaxial mechanical testing of planar soft tissues: Application to porcine aortic valves

Affiliations

A Bayesian constitutive model selection framework for biaxial mechanical testing of planar soft tissues: Application to porcine aortic valves

Ankush Aggarwal et al. J Mech Behav Biomed Mater. 2023 Feb.

Abstract

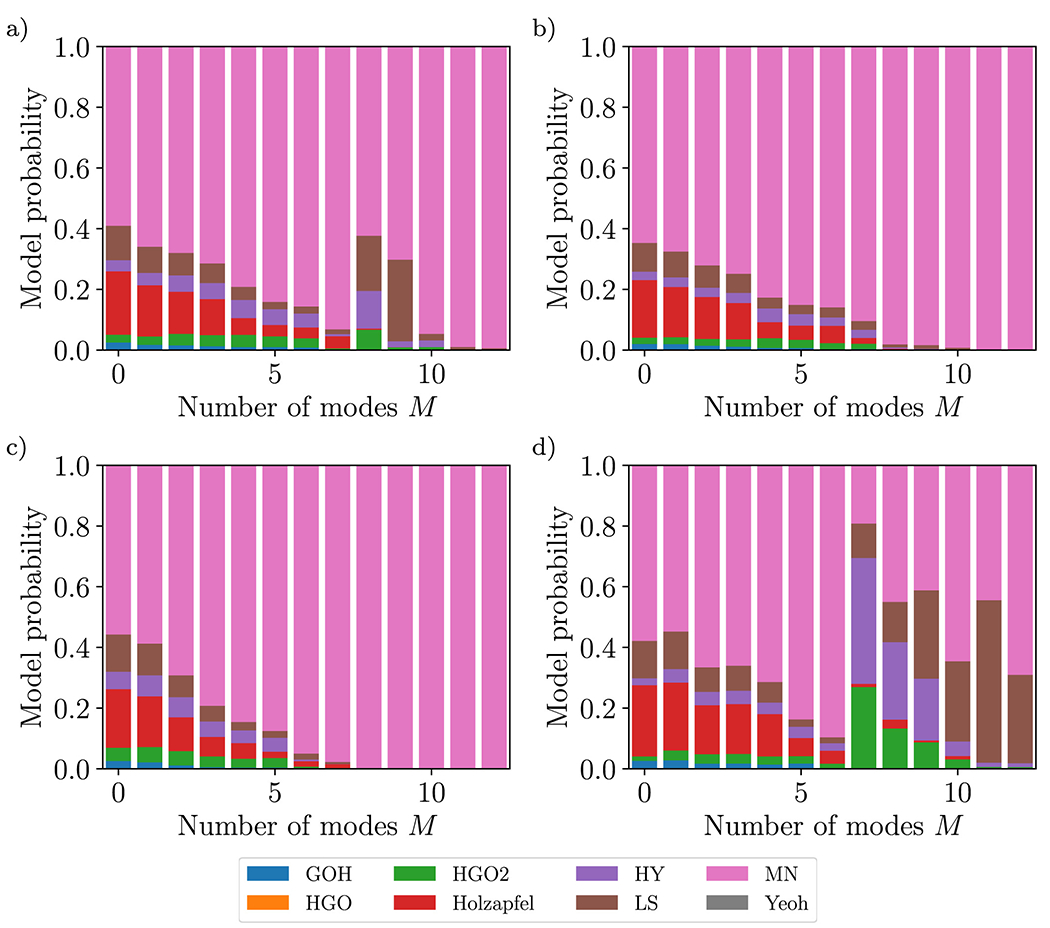
A variety of constitutive models have been developed for soft tissue mechanics. However, there is no established criterion to select a suitable model for a specific application. Although the model that best fits the experimental data can be deemed the most suitable model, this practice often can be insufficient given the inter-sample variability of experimental observations. Herein, we present a Bayesian approach to calculate the relative probabilities of constitutive models based on biaxial mechanical testing of tissue samples. Forty-six samples of porcine aortic valve tissue were tested using a biaxial stretching setup. For each sample, seven ratios of stresses along and perpendicular to the fiber direction were applied. The probabilities of eight invariant-based constitutive models were calculated based on the experimental data using the proposed model selection framework. The calculated probabilities showed that, out of the considered models and based on the information available through the utilized experimental dataset, the May-Newman model was the most probable model for the porcine aortic valve data. When the samples were further grouped into different cusp types, the May-Newman model remained the most probable for the left- and right-coronary cusps, whereas for non-coronary cusps two models were found to be equally probable: the Lee-Sacks model and the May-Newman model. This difference between cusp types was found to be associated with the first principal component analysis (PCA) mode, where this mode's amplitudes of the non-coronary and right-coronary cusps were found to be significantly different. Our results show that a PCA-based statistical model can capture significant variations in the mechanical properties of soft tissues. The presented framework is applicable to other tissue types, and has the potential to provide a structured and rational way of making simulations population-based.

Keywords: Aortic valve; Bayesian; Biomechanics; Constitutive model; Model selection; Soft-tissue.


Conflict of interest statement

Declaration of Competing Interest The authors declare that they have no known competing financial interests or personal relationships that could have appeared to influence the work reported in this paper.

Figures

Figure 1:
Figure 1:
(a) A schematic of the biaxial testing with the circumferential (fiber) direction of the tissue was aligned with the x axis and the radial (cross-fiber) direction of the tissue was aligned with the y axis. (b) The different loading paths in the stress space with seven different loading ratios ϕr{0.25,0.5,0.75,1,1.333,2,4}.
Figure 2:
Figure 2:
The applied stresses (dots) deviated slightly from the target ratio (faint dashed colored lines), where the mean achieved ratio is shown in solid colored lines. The mean magnitude of the maximum applied stress Pmax is plotted as a black dashed circular arc. The target stresses for each protocol are the intersection of the circular arc and solid lines, and are denoted with black *.
Figure 3:
Figure 3:
The experimental data for N=46 samples (dots) and the fitted interpolating function (line) in the (a) fiber and (b) cross-fiber direction; horizontal axes are stretches and vertical axes are stresses in [kPa]. Each color represents a different tissue sample of total N=46 specimens.
Figure 4:
Figure 4:
The interpolated data in the (a) fiber and (b) cross-fiber direction; horizontal axes are stretches and vertical axes are stresses in [kPa]. Each color represents a different tissue sample of total N=46 specimens.
Figure 5:
Figure 5:
The mean stress-stretch response (blue lines) in the (a) fiber and (b) cross-fiber direction; horizontal axes are stretches and vertical axes are stresses in [kPa]. The shaded gray area denotes one standard deviation.
Figure 6:
Figure 6:
A boxplot of the amplitudes of PCA modes in the experimental data, from which a normal distribution is constructed with mean zero and variance equal to sα2 (inset).
Figure 7:
Figure 7:
First five principal modes of stress-stretch response in the (a) fiber and (b) cross-fiber direction; horizontal axes are stretches and vertical axes are stresses in [kPa]. For an animation of the modes, see SI.
Figure 8:
Figure 8:
Ten synthetic samples’ stress-stretch response using Eq. (9) in the (a) fiber and (b) cross-fiber direction; horizontal axes are stretches and vertical axes are stresses in [kPa]. Each color represents one synthetic sample.
Figure 9:
Figure 9:
Relative probabilities of the eight hyperelastic models calculated using the proposed framework with M=11 versus number of Monte Carlo iterations.
Figure 10:
Figure 10:
The probabilities of the eight hyperelastic models versus number of PCA modes retained M for (a) all, (b) LCC, (c) RCC, and (d) NCC types.
Figure 11:
Figure 11:
Posterior response using May–Newmann model with mean (solid line) and variation (shaded region) in blue color compared to the data in red color, in the (a) fiber and (b) cross-fiber direction. For comparison, the classic fit of the MN model is plotted with dashed blue lines. Horizontal axes are stretches and vertical axes are stresses in [kPa].
Figure 12:
Figure 12:
Histogram of the posterior distribution of parameters of the May–Newman model.
Figure 13:
Figure 13:
Independent samples t-tests between the modal amplitudes of different cusp types showed a significant difference in the second principal mode between the NCC (n=16) and the other two cusp types (n=15 each), which is consistent with the finding that the probability of models is different for the NCC.

References

    1. Maurel W, Thalmann D, Wu Y, Thalmann NM, Constitutive Modeling, Springer Berlin Heidelberg, Berlin, Heidelberg, 1998, pp. 79–120.
    1. Fung Y-C, et al. Stress-strain-history relations of soft tissues in simple elongation, Biomechanics: Its foundations and objectives 7 (1972) 181–208.
    1. Gasser TC, Ogden RW, Holzapfel GA, Hyperelastic modelling of arterial layers with distributed collagen fibre orientations, Journal of The Royal Society Interface 3 (2006) 15–35. doi: 10.1098/rsif.2005.0073. - DOI - PMC - PubMed
    1. Lanir Y, Constitutive equations for fibrous connective tissues, Journal of biomechanics 16 (1983) 1–12. doi: 10.1016/0021-9290(83)90041-6. - DOI - PubMed
    1. Billiar KL, Sacks MS, Biaxial mechanical properties of the native and glutaraldehyde-treated aortic valve cusp: part ii–a structural constitutive model, Journal of biomechanical engineering 122 (2000) 327–335. doi: 10.1115/1.1287158. - DOI - PubMed

Publication types