. 2023 Feb 7;35(2):332-344.e7.
doi: 10.1016/j.cmet.2022.12.012. Epub 2023 Jan 11.

Palmitoylation couples insulin hypersecretion with β cell failure in diabetes

Affiliations

Palmitoylation couples insulin hypersecretion with β cell failure in diabetes

Guifang Dong et al. Cell Metab. .

Abstract

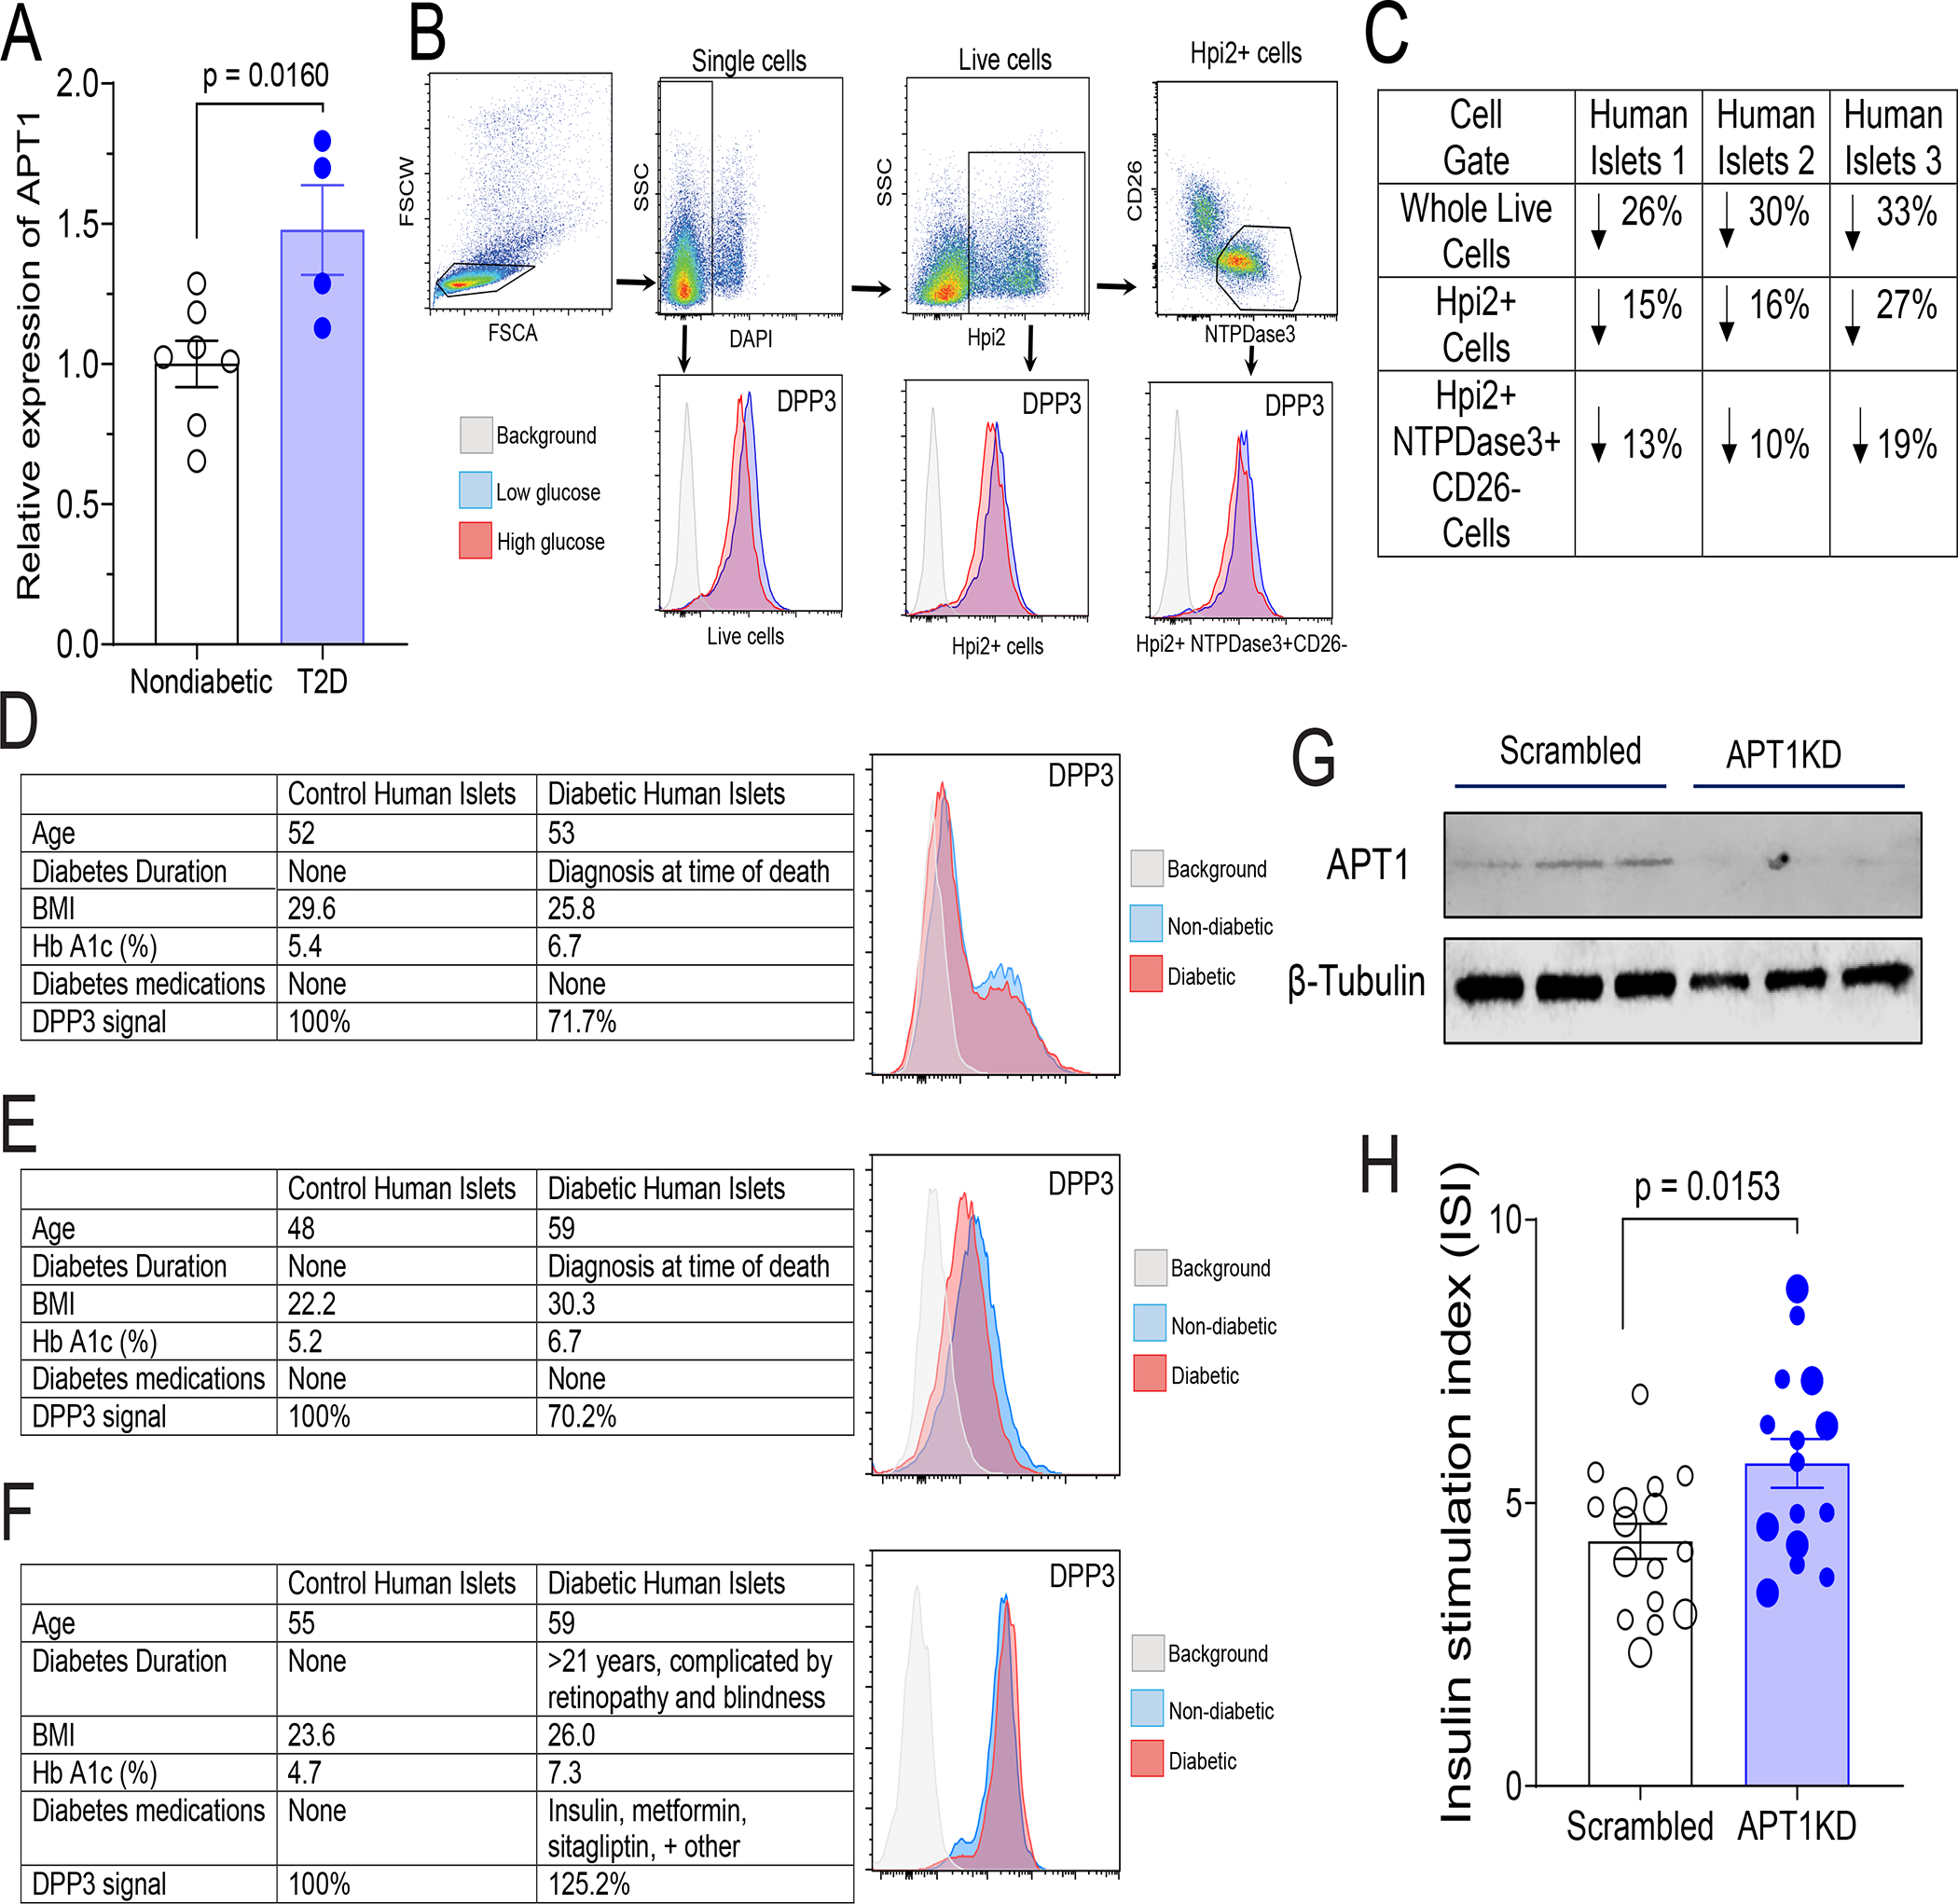
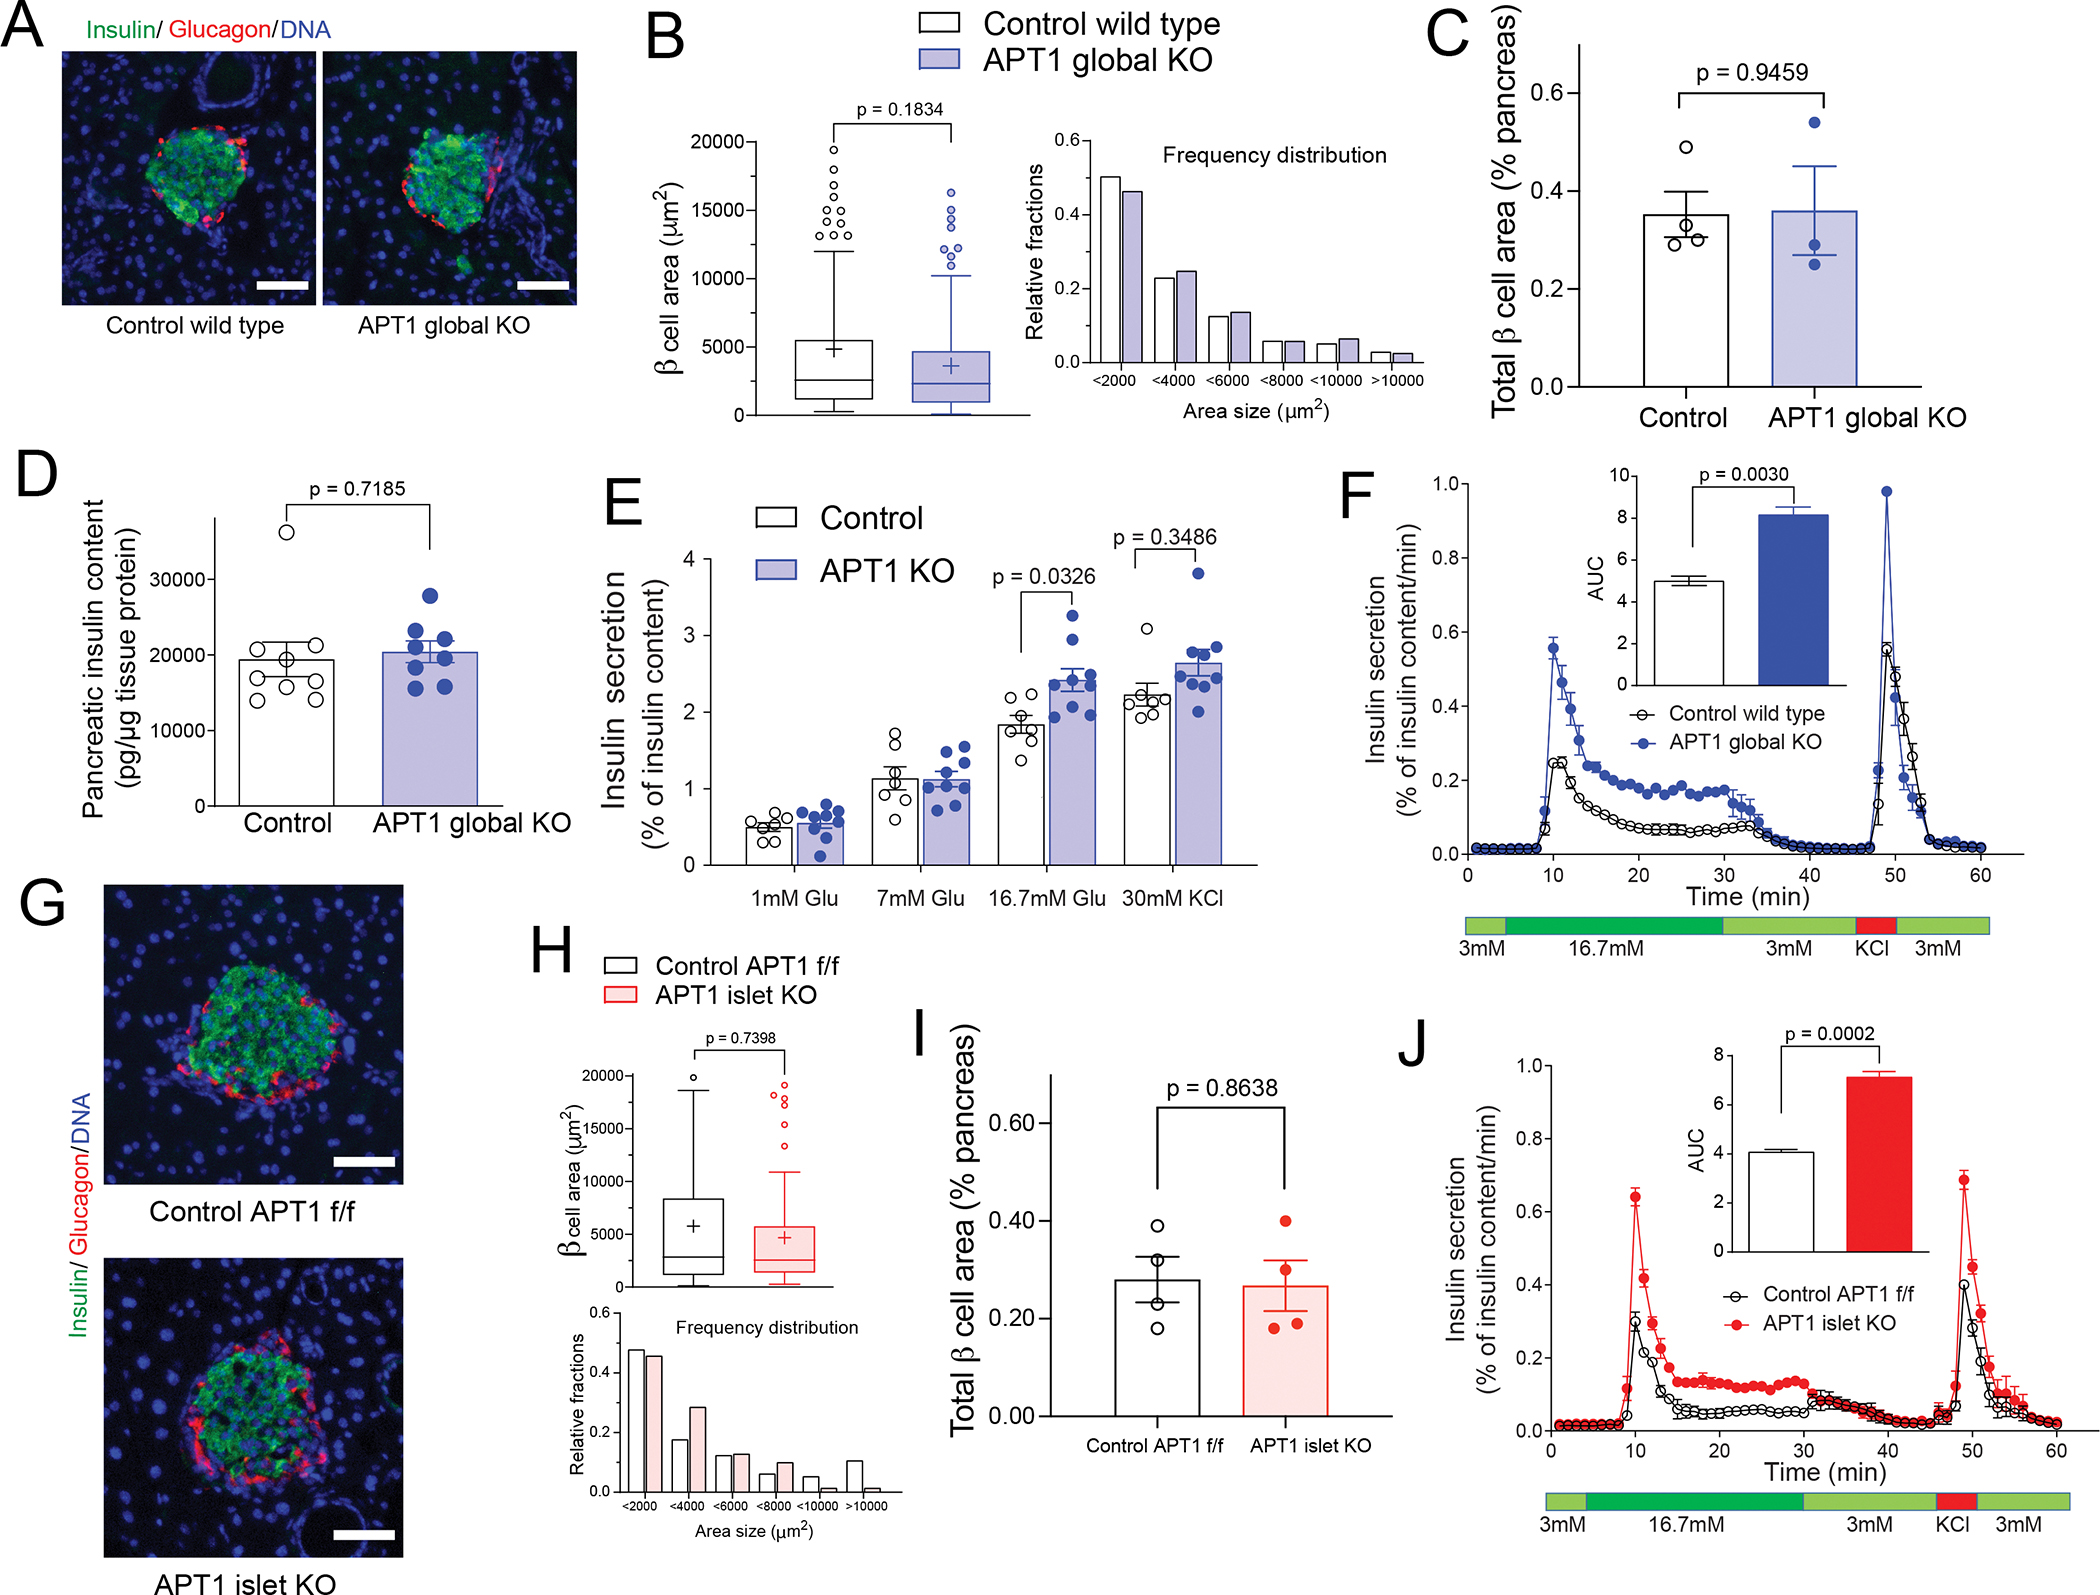
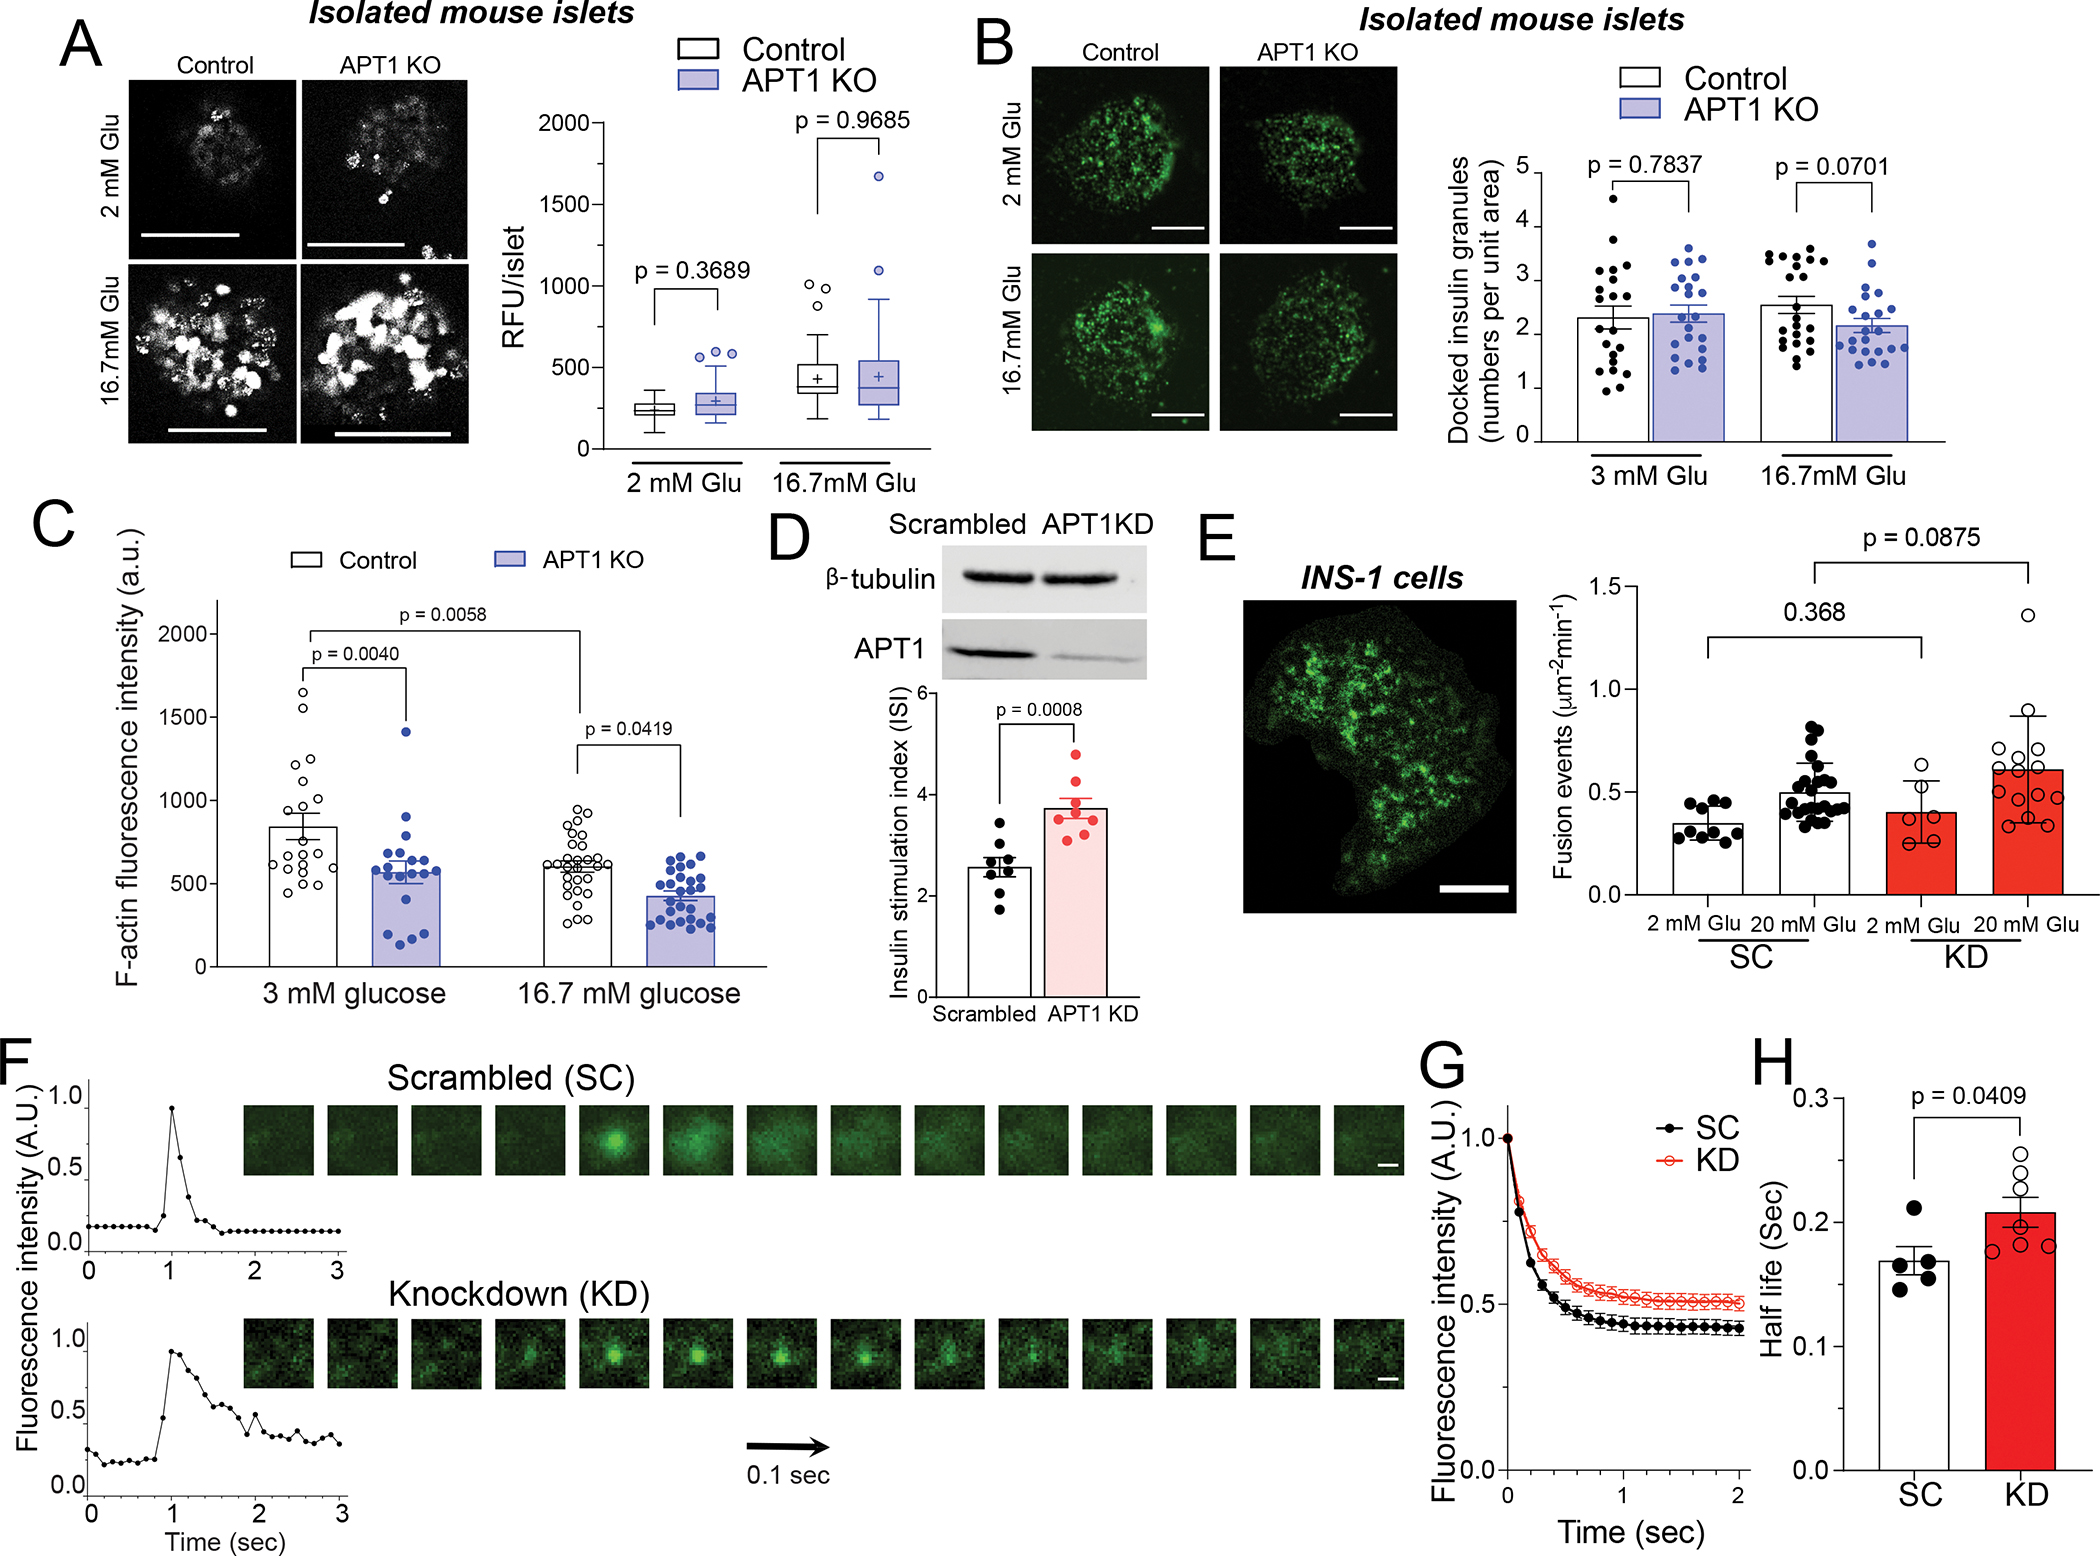
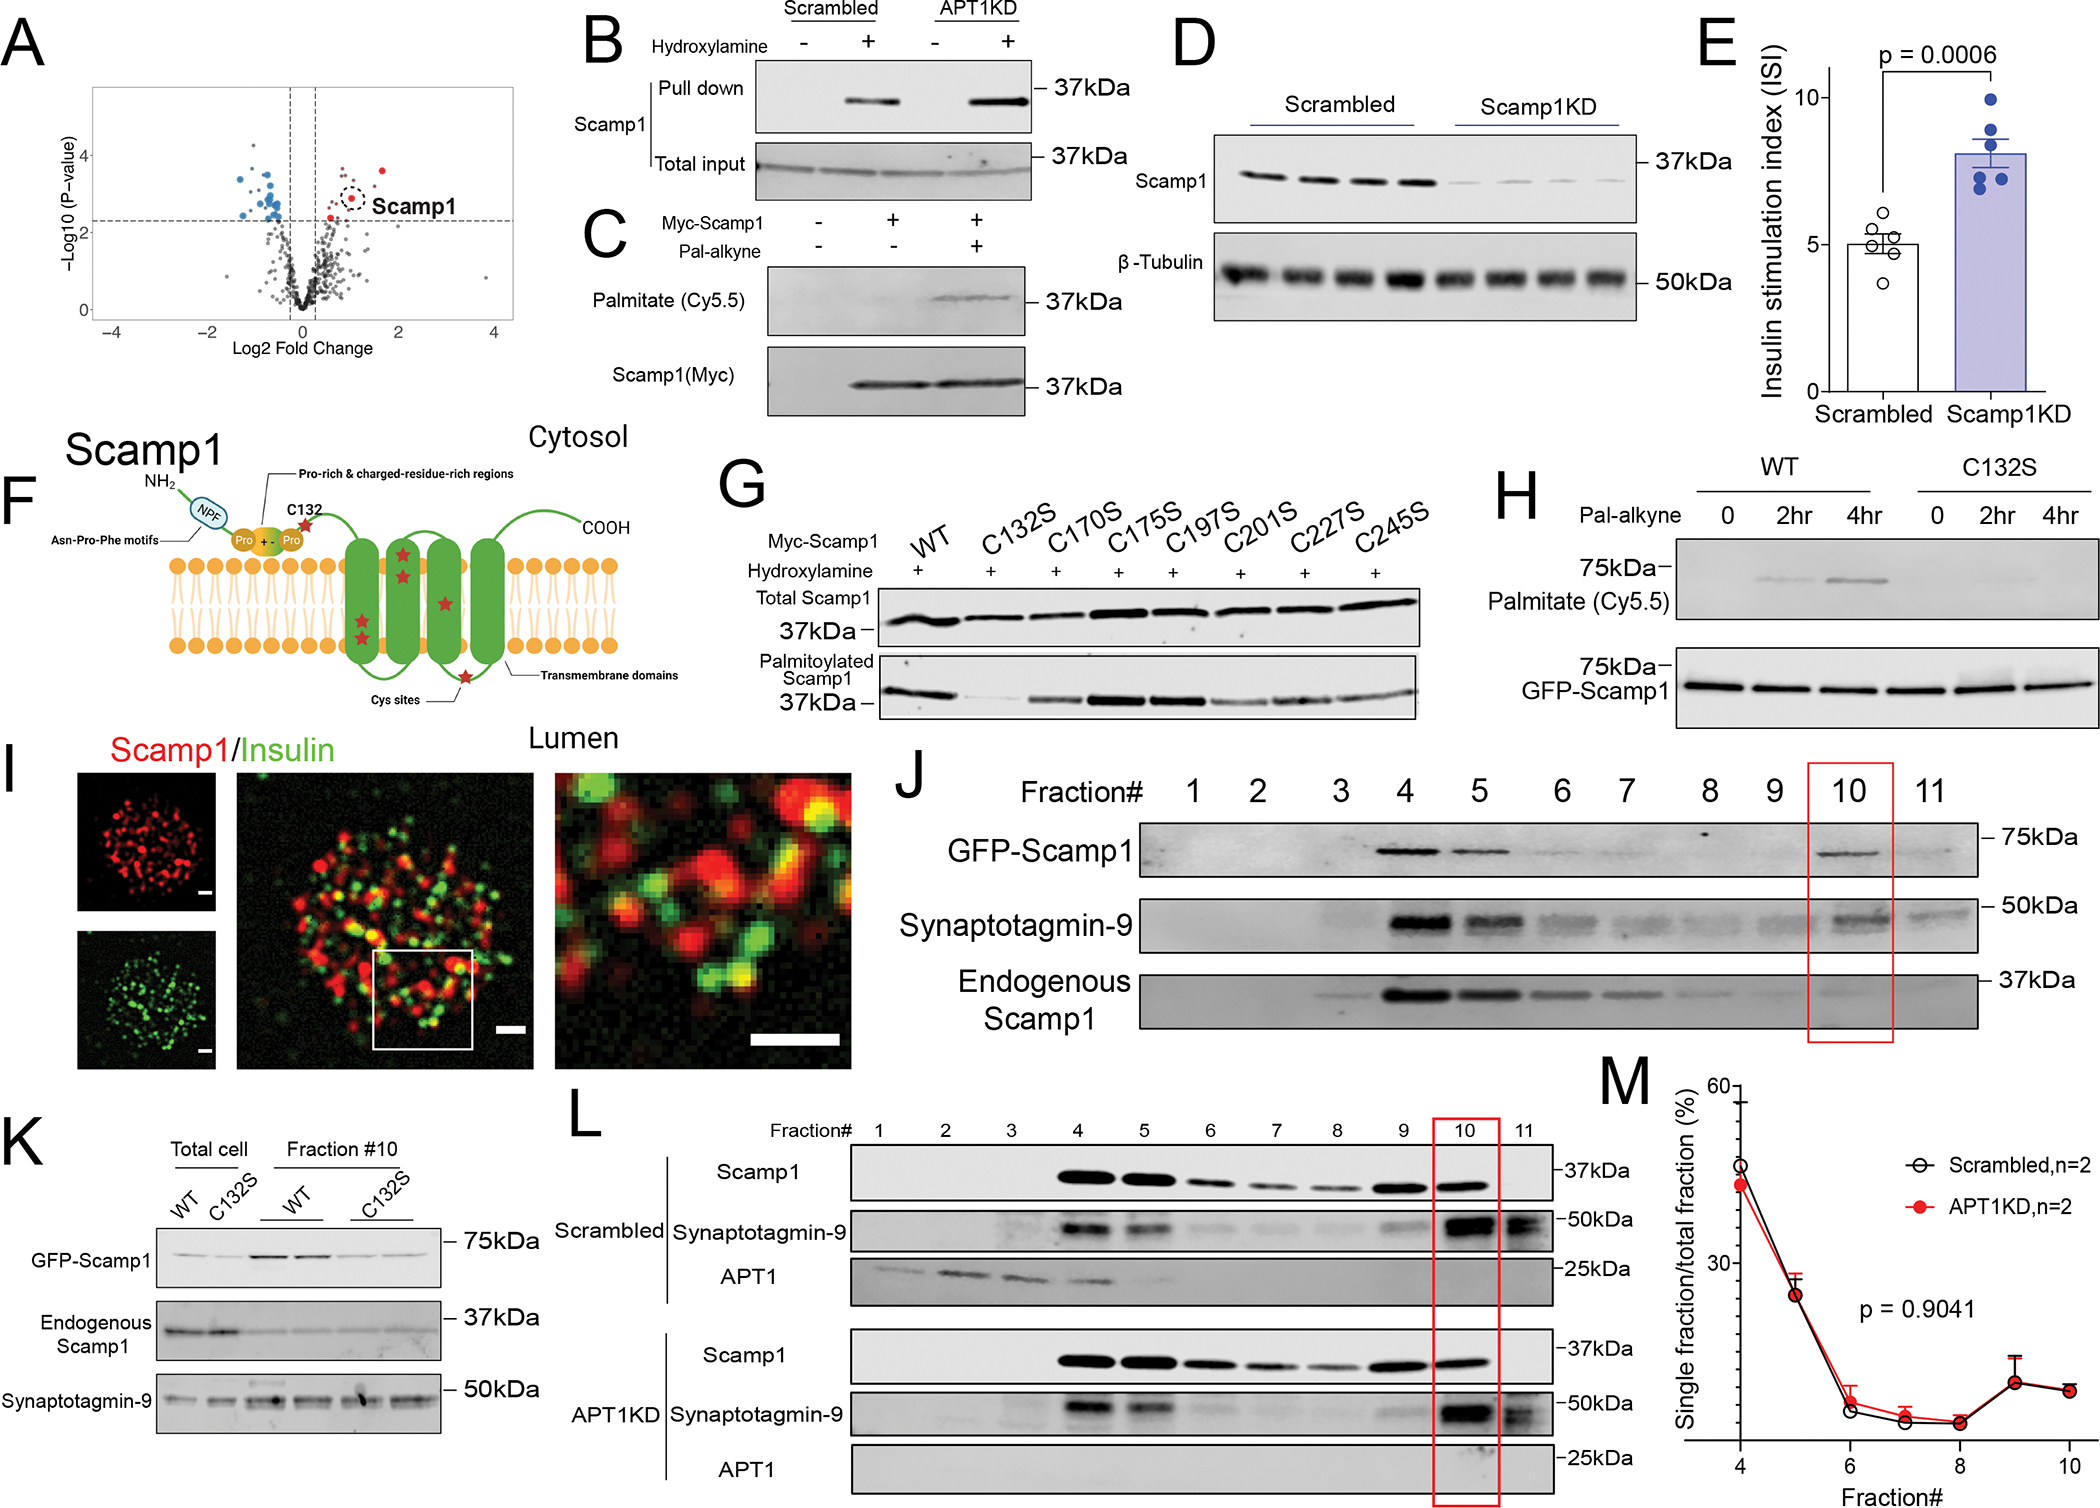
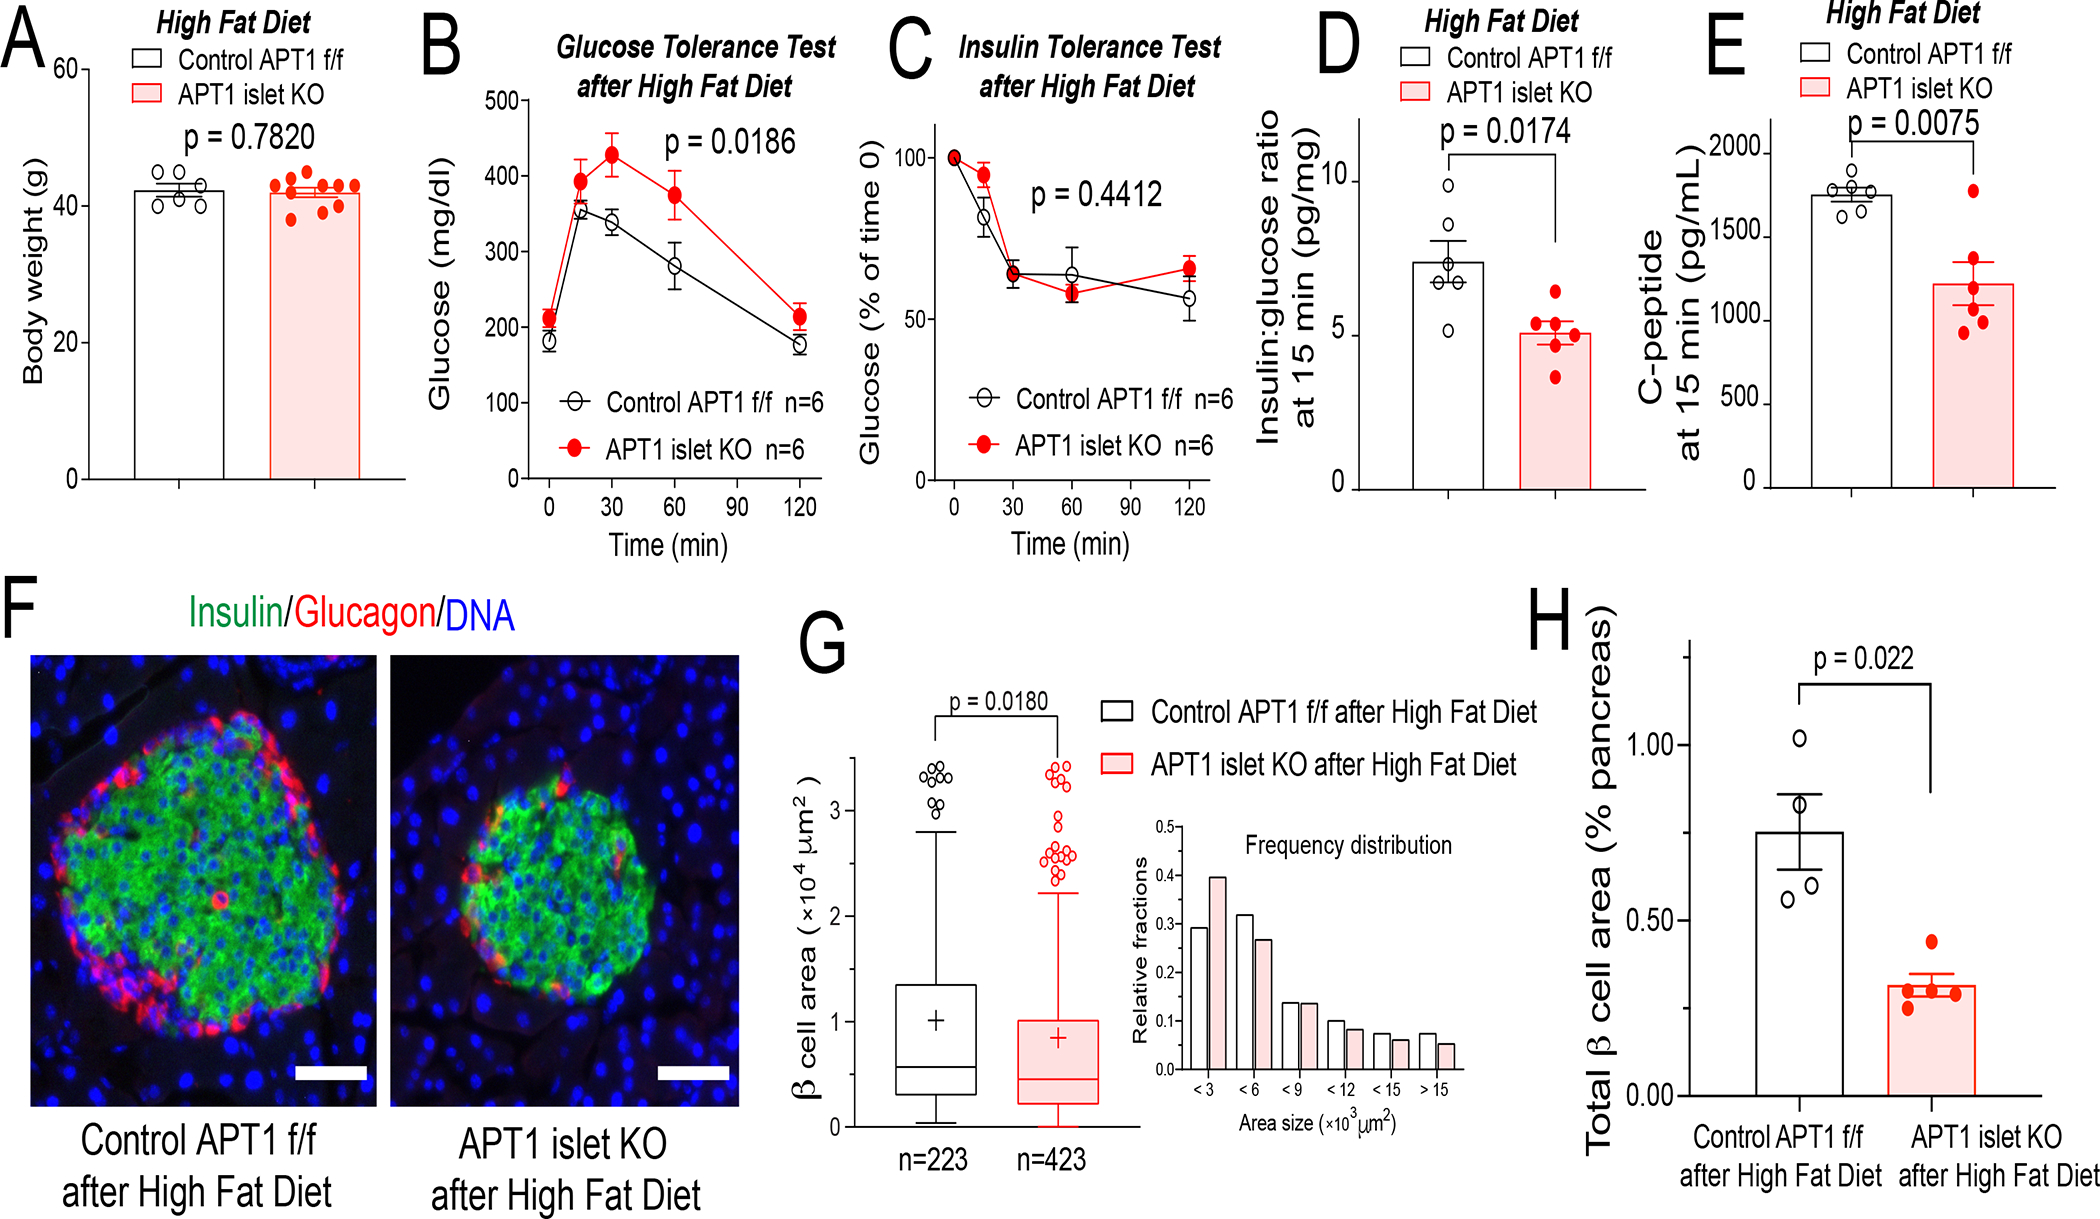
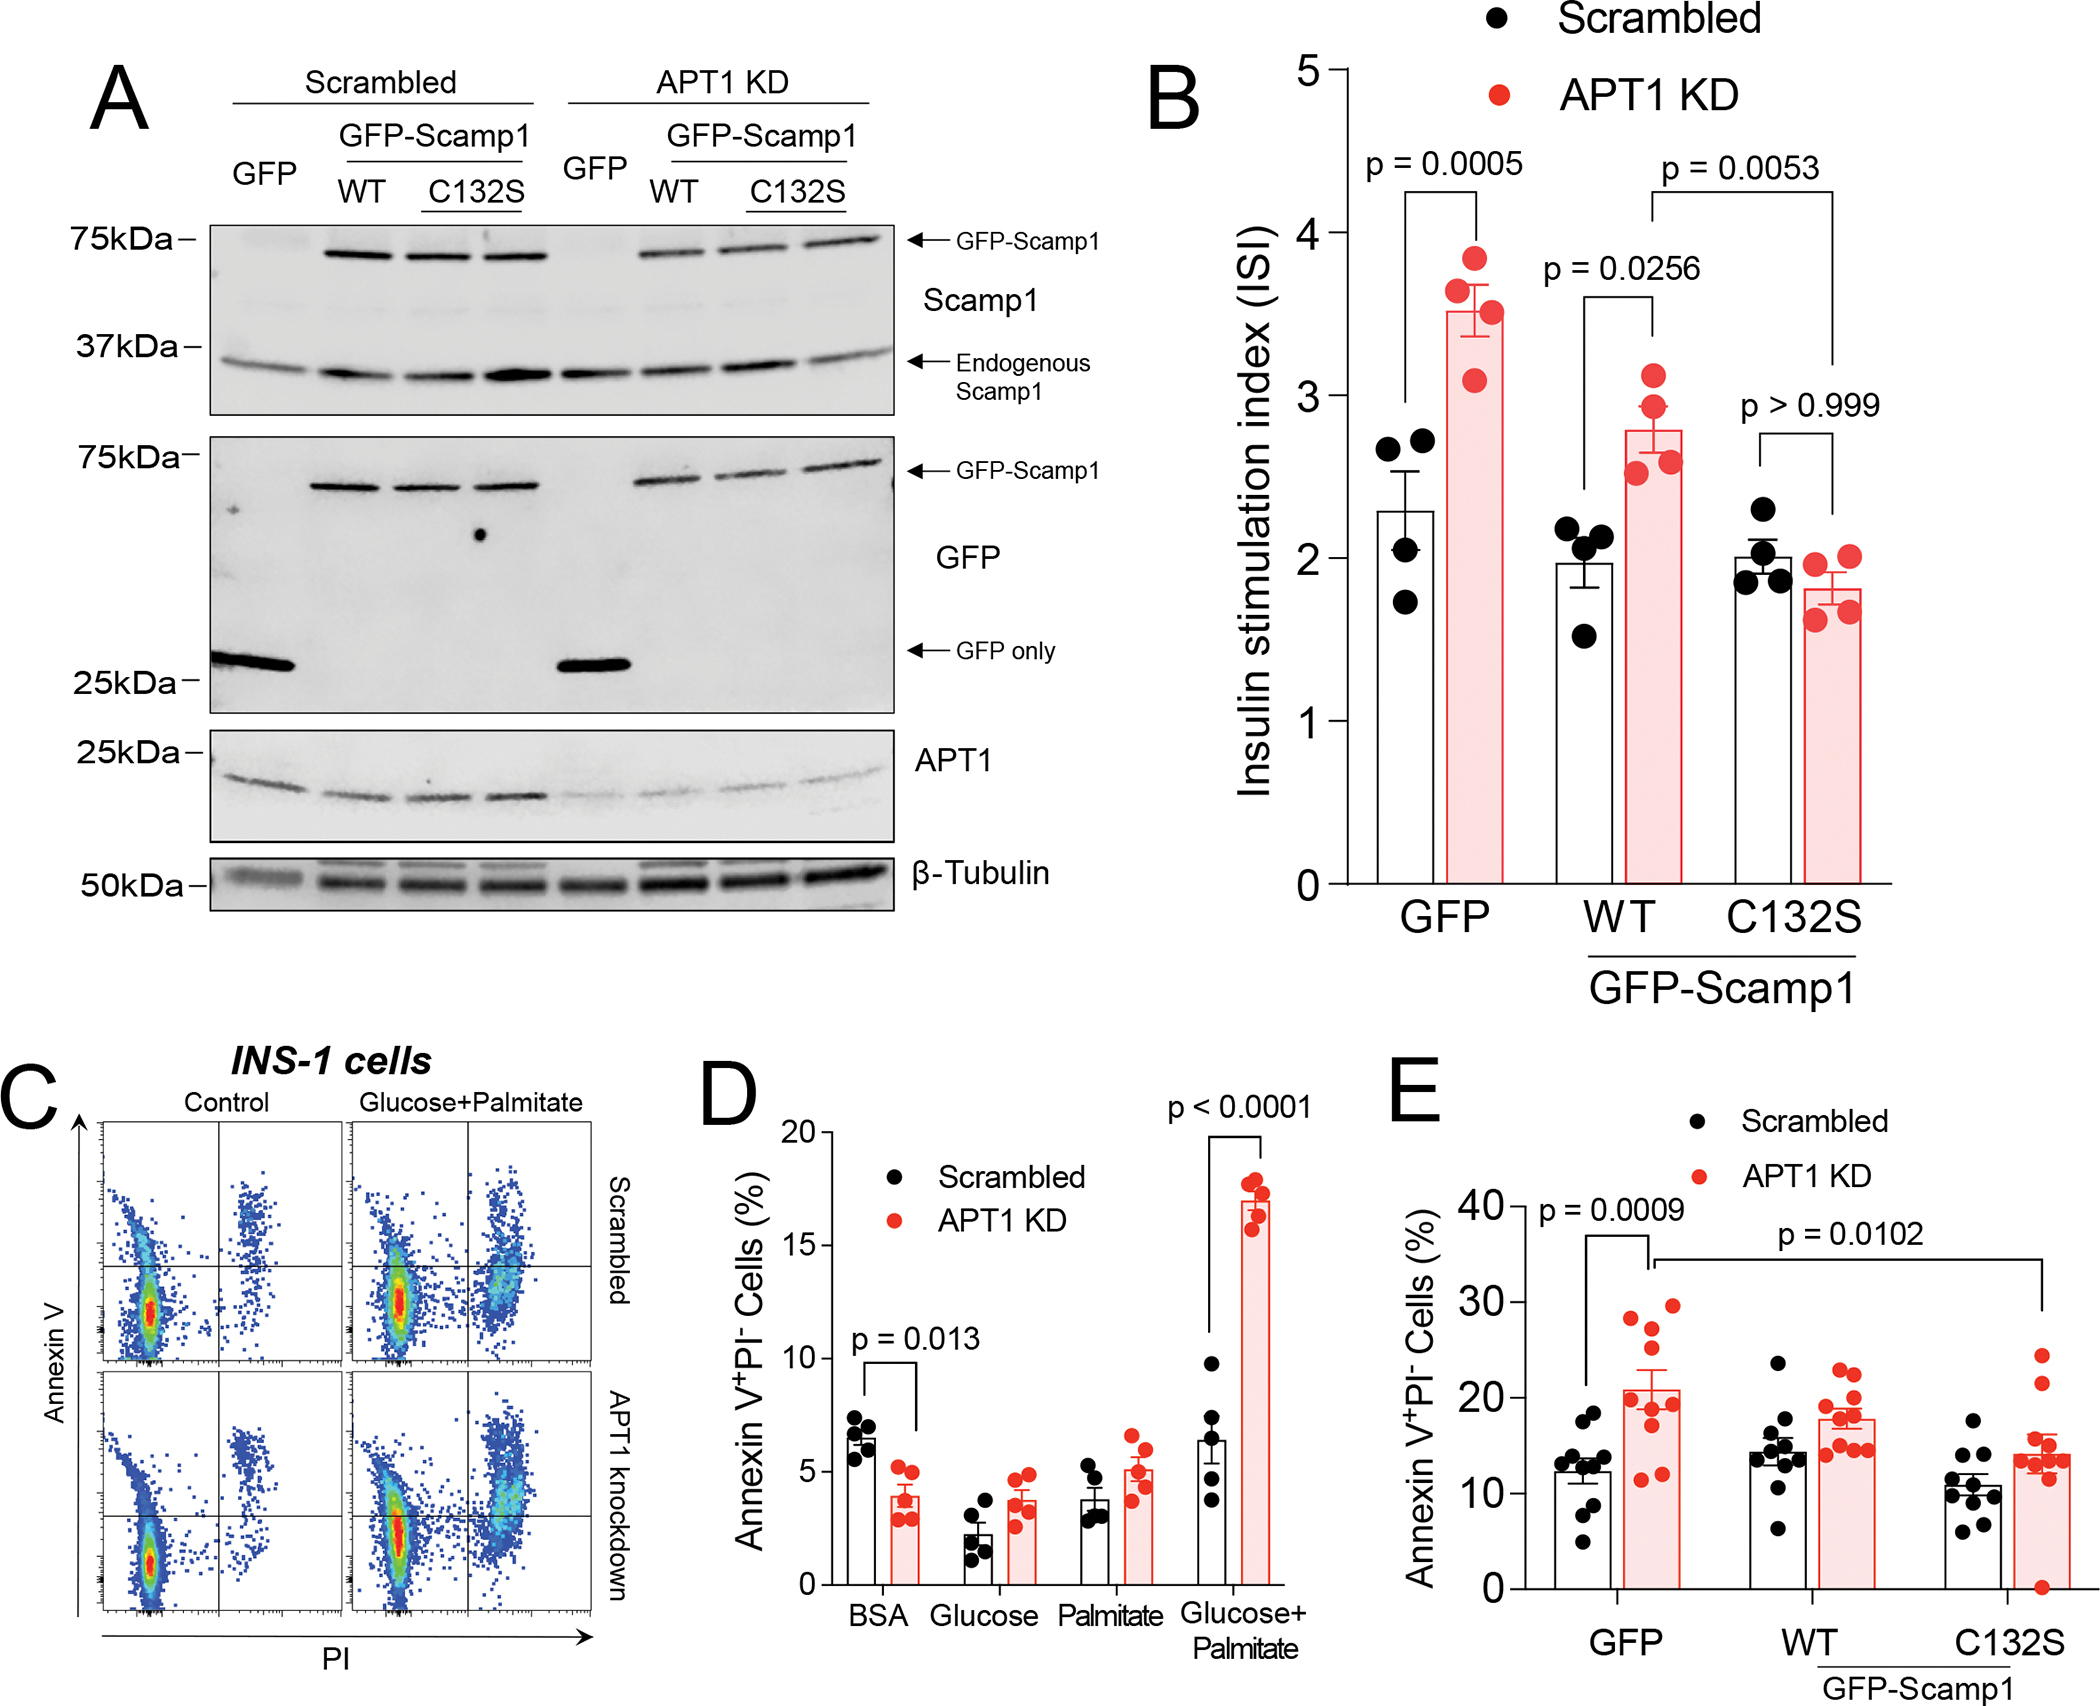
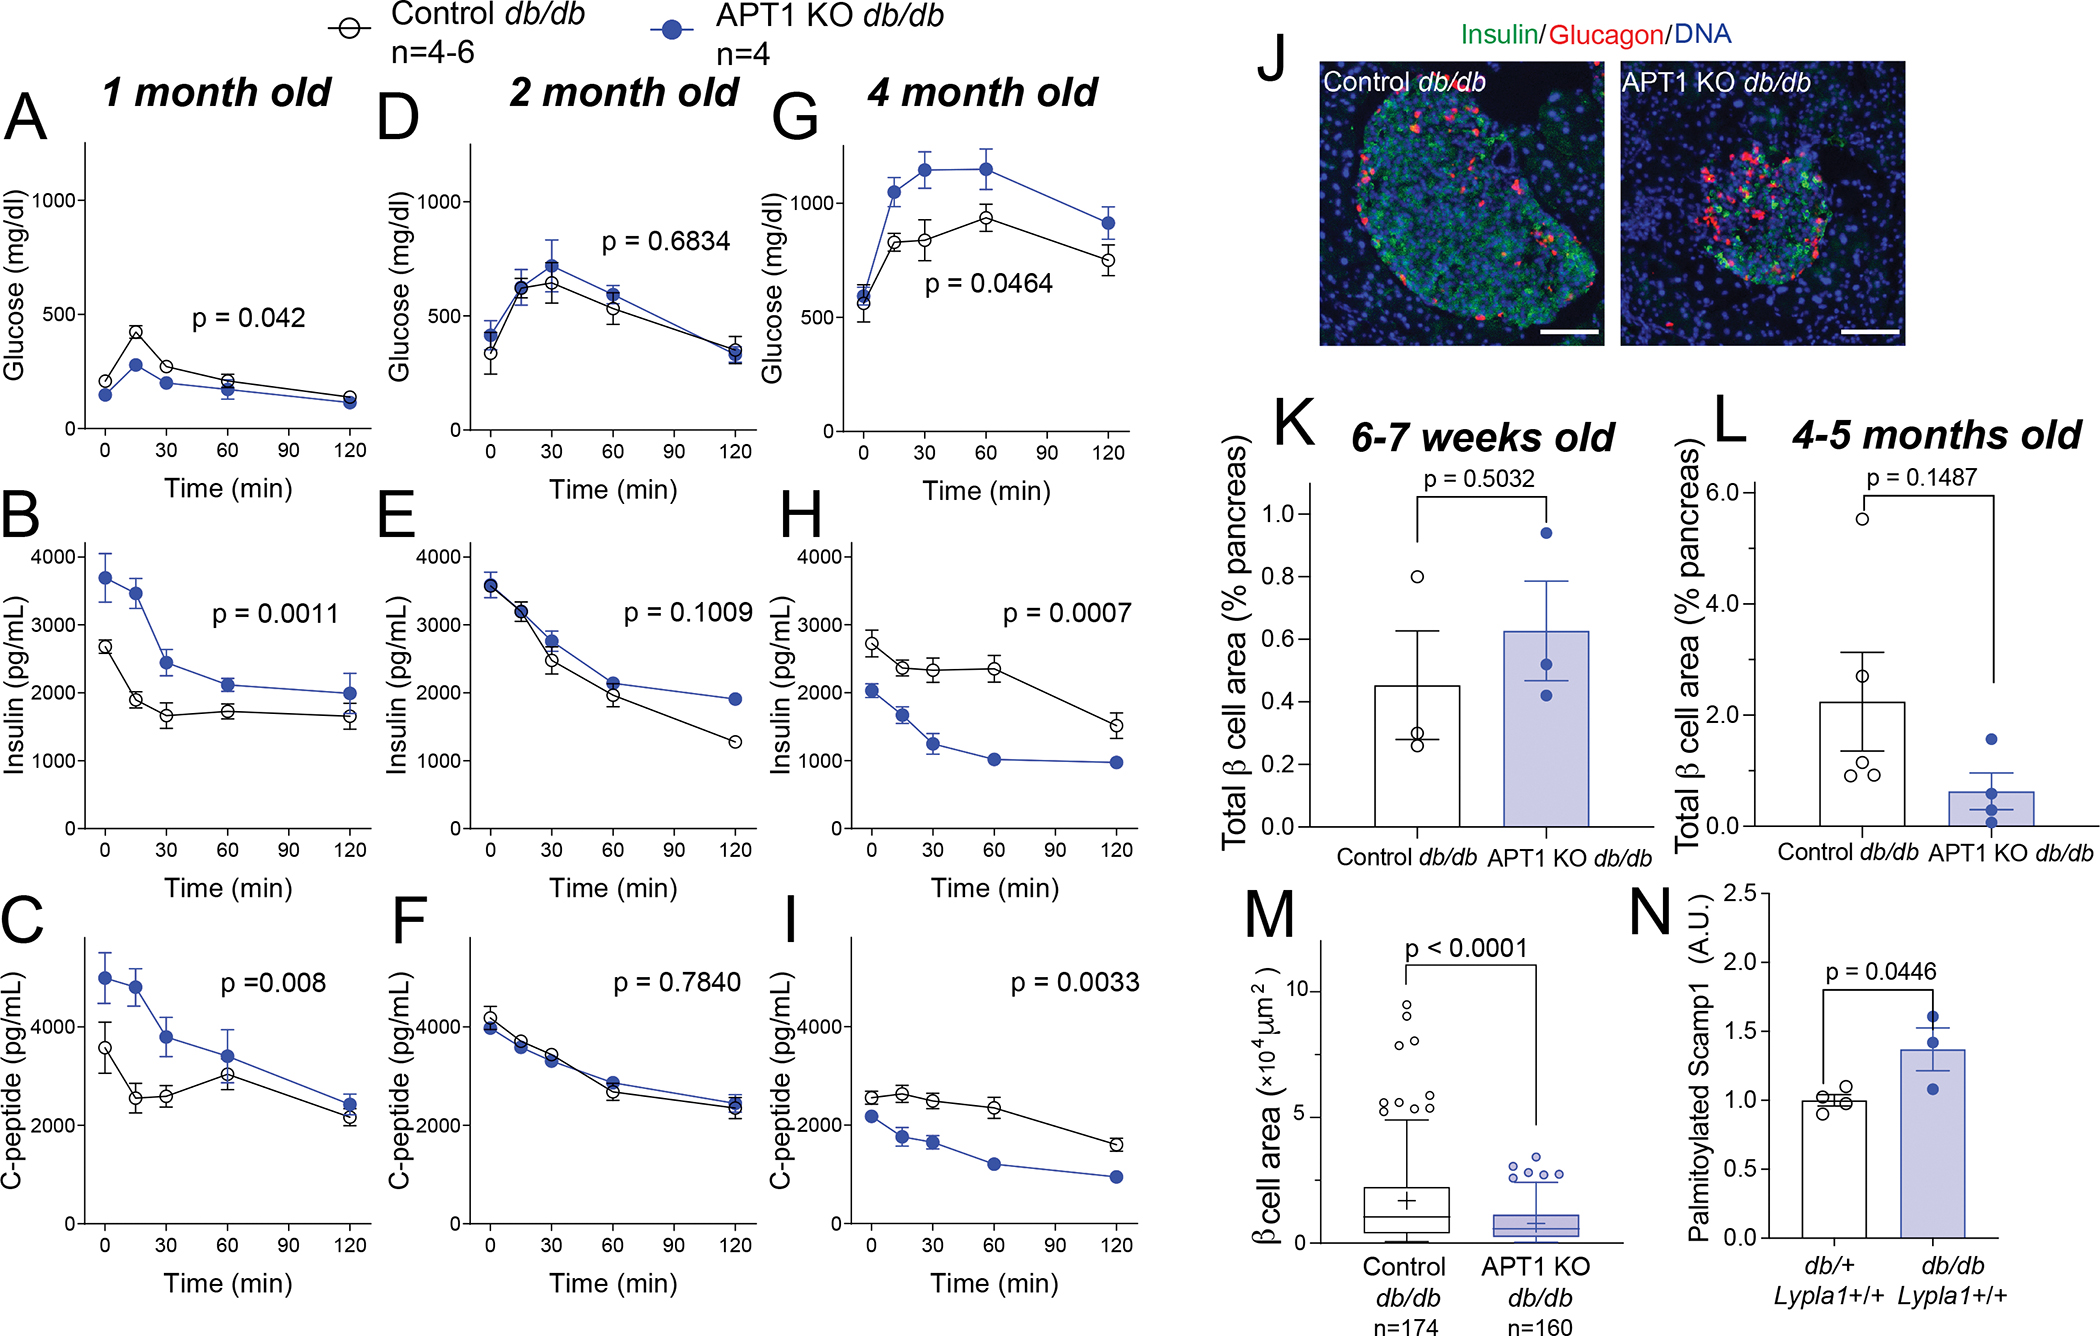
Hyperinsulinemia often precedes type 2 diabetes. Palmitoylation, implicated in exocytosis, is reversed by acyl-protein thioesterase 1 (APT1). APT1 biology was altered in pancreatic islets from humans with type 2 diabetes, and APT1 knockdown in nondiabetic islets caused insulin hypersecretion. APT1 knockout mice had islet autonomous increased glucose-stimulated insulin secretion that was associated with prolonged insulin granule fusion. Using palmitoylation proteomics, we identified Scamp1 as an APT1 substrate that localized to insulin secretory granules. Scamp1 knockdown caused insulin hypersecretion. Expression of a mutated Scamp1 incapable of being palmitoylated in APT1-deficient cells rescued insulin hypersecretion and nutrient-induced apoptosis. High-fat-fed islet-specific APT1-knockout mice and global APT1-deficient db/db mice showed increased β cell failure. These findings suggest that APT1 is regulated in human islets and that APT1 deficiency causes insulin hypersecretion leading to β cell failure, modeling the evolution of some forms of human type 2 diabetes.

Keywords: S-acylation; acyl-protein thioesterases; beta cell failure; lipotoxicity; type 2 diabetes.


Conflict of interest statement

Declaration of interests C.F.S. is a member of the Cell Metabolism advisory board.

Figures

Figure 1.
Figure 1.. APT1 expression, enzyme activity, and effect of APT1 deficiency on insulin secretion in human islets.
(A) APT1 mRNA in islets from control (nondiabetic) and type 2 diabetes (T2D) humans. Donor demographics are provided in Table S1A. (B,C) Hyperglycemia decreases APT1 enzyme activity in nondiabetic human islets. APT1 activity was assayed using fluorescent depalmitoylation probe DPP3 in human islets treated with low glucose (5.5 mM) or high glucose (25 mM) for 48 h. FACS gating strategy is shown in top of panel B and the DPP3 histogram for each gate is shown in the bottom of panel B. Whole live cells: single+ DAPI; Islet cells: single+DAPIHpi2+; β-cells: single+DAPIHpi2+CD26NTPDase3+. Panel C shows the activity results for three independent assays using islets from three different donors. Donor demographics are provided in Table S1B. (D,E,F) Comparison of APT1 enzyme activity in human diabetic and nondiabetic islets. Panels D (donor IDs HP-20021-01, HP-20019-01T2D) and E (donor IDs HP-21124-01, HP-21129-01T2D) used islets from donors with no prior history of diabetes; Panel F (donor IDs HP-20268-01, HP-20259-01T2D) used islets from a donor with a long history of diabetes and its complications. (G,H) APT1 knockdown in nondiabetic human islets increases insulin secretion. Western blots to verify knockdown are shown for three culture aliquots in panel G. Insulin stimulation index (insulin after 16.7 mM glucose as compared to 3 mM glucose) in multiple aliquots of islets from two different normal donors indicated by different size symbols. Donor demographics are provided in Table S1C.
Figure 2.
Figure 2.. Isolated islets from APT1 deficient mice have increased glucose-stimulated insulin secretion.
(A,B) Islet histomorphometry is unaffected in chow fed APT1 global KO mice. (C) Analysis of β-cell area as % of pancreatic area in chow fed APT1 global KO mice. (D) Pancreatic insulin content in control and APT1 global KO mice. (E) Static glucose-stimulated insulin secretion in control and global APT1 KO islets. (F) Dynamic glucose-stimulated insulin secretion in control and global APT1 KO islets performed by perifusion. (G,H) Islet histomorphometry is unaffected in chow fed APT1 islet KO mice. (I) Analysis of β-cell area as % of pancreatic area in chow fed APT1 islet KO mice. (J) Dynamic glucose-stimulated insulin secretion in control and islet APT1 KO islets performed by perifusion. Scale=50 μm.
Figure 3.
Figure 3.. Calcium imaging, docked granules, cortical actin, and kinetics of granule fusion.
(A) Fluo-4 live cell imaging of isolated islets in the presence of 2 mM and 16.7 mM glucose. Scale=100 μm. (B) Docked insulin granule analysis by TIRF imaging in the presence of 3 mM and 16.7 mM glucose. Scale=5 μm. (C) Dispersed islets from global APT1 knockout and control mice were isolated and F-actin was imaged in cells incubated in 3 mM or 16.7 mM glucose. P values represent comparisons by two-way ANOVA. (D) Western blotting to validate the knockdown of APT1 in INS-1 832/13 cells (top panel) and increased glucose-stimulated insulin secretion in APT1 knockdown cells (bottom panel). (E) VAMP2-pHluorin imaging of insulin granules in an INS-1 cell by TIRF (left panel, Scale=5 μm) and fusion events in scrambled (SC) and APT1 knockdown (KD) INS-1 cells (right panel). (F) Intensity of isolated granule fusion events (left) and video frames of representative fusion events imaged by TIRF (right). Scale=0.5 μm. (G) Decay curve of peak intensity during fusion events for scrambled (SC) and APT1 knockdown (KD) cells. (H) Half-life of granule fusion for scrambled (SC) and APT1 knockdown (KD) cells.
Figure 4.
Figure 4.. Scamp1 is a palmitoylated protein that partially localizes to insulin secretory granules.
(A) Volcano plot of palmitoylation screen to identify proteins with increased palmitoylation in APT1 deficient islets. Large symbols indicate ≥ 2 peptides; small symbols < 2 peptides. (B,C) Validation of Scamp1 as a palmitoylated protein and substrate for APT1 by RAC assay (B) and click chemistry (C). (D) Western blotting to validate the knockdown of Scamp1 in INS-1 cells. (E) Increased glucose-stimulated insulin secretion in Scamp1 knockdown cells. (F) Diagram of the transmembrane vesicle protein Scamp1 with cysteine residues denoted by red stars. (G) RAC assay of wild type and mutant Scamp1 proteins with individual cysteine to serine mutations at each of the cysteine residues in Scamp1. (H) Click chemistry assay for palmitoylation in wild type and C132S Scamp1. (I) Co-localization of Scamp1 (red) and insulin (green) granules in dispersed mouse islets by TIRF. The box in the merged image of the middle panel is shown at higher magnification in the right panel. Scale=1 μm. (J) Scamp1 localization in dense core secretory granules of INS-1 cells. (K) Decreased accumulation of the palmitoylation defective C132S Scamp1 mutant in dense core granules (fraction #10). (L) Western blotting of Scamp1 in various fractions of control/Scrambled and APTKD INS-1 cells. (M) Quantification of Scamp1 fractions including dense core secretory granules (fraction #10) in INS-1 cells from two independent experiments.
Figure 5.
Figure 5.. Islet specific APT1 deficiency promotes β-cell failure induced by feeding a high fat diet.
Male APT1 islet KO mice with improved glucose tolerance due to increased insulin secretion (Figure S1 E–H) were placed on a high fat diet for 12 weeks. (A) Body weight of APT1 islet KO and control mice after 12 weeks on high fat diet. (B) Impaired glucose tolerance in APT1 islet KO mice after high fat diet. (C) No effect on insulin sensitivity by insulin tolerance testing in APT1 islet KO mice compared to control mice after high fat diet. (D,E) Decreased insulin secretion in APT1 islet KO mice as shown by decreased insulin:glucose ratio (D) and decreased C-peptide (E) 15 min after glucose administration. (F) Islet images after high fat diet. Insulin (green), glucagon (red), DAPI (blue). Scale=50 μm. (G) Histomorphometry of islets after high fat diet. (H) Analysis of β-cell area as % of pancreatic area in high fat fed APT1 islet KO mice.
Figure 6.
Figure 6.. Palmitoylation defective Scamp1 (C132S) rescues increased insulin secretion and nutrient induced apoptosis in APT1 knockdown INS-1 cells.
(A) Expression of wild type and C132S mutant Scamp1 in control (scrambled) and APT1 knockdown INS-1 cells at levels comparable to endogenous levels of Scamp1. (B) Glucose-stimulated insulin secretion in control and APT1 knockdown cells with expression of GFP only, GFP-wild type Scamp1, and GFP-C132S Scamp1. (C,D) APT1-deficient INS-1 cells have increased susceptibility to apoptosis. FACS analysis for Annexin V and PI in the presence and absence of high glucose (25 mM) + palmitate (0.5 mM) complexed with BSA (C) and quantitation of Annexin V data after exposure to different media for 24 h (D). (E) INS-1 cells treated with Scrambled or APT1 knockdown shRNA were transduced with GFP alone, WT Scamp1 or C132S Scamp1 for 48 h, then treated with high glucose (25 mM) + palmitate (0.5 mM) complexed with BSA for 24 h followed by FACS assay for apoptosis.
Figure 7.
Figure 7.. APT1 deficiency promotes β-cell failure over time in db/db mice.
(A,B,C) Male and female db/db mice with APT1 deficiency at 1 month of age have enhanced glucose tolerance (A), and increased secretion of insulin (B) and C-peptide (C). (D,E,F) No difference in glucose tolerance, insulin secretion or C-peptide secretion by genotype at 2 months of age. (G,H,I) db/db mice with APT1 deficiency at 4 months of age have impaired glucose tolerance (G), and decreased secretion of insulin (H) and C-peptide (I). (J) Images of islets after development of more pronounced glucose intolerance in the APT1 deficient animals. (K) Analysis of β-cell area as % of pancreatic area in APT1 KO db/db and control db/db mice at 6–7 weeks of age and at (L) 4–5 months of age. (M) Islet histomorphometry of APT1 KO and control db/db mice at 4 months of age. (N) Palmitoylated Scamp1 in isolated islets of db/db mice without APT1 deficiency and control db/+ mice without APT1 deficiency as determined by RAC assay. Scale=100 μm.

References

    1. Porte D Jr. (1991). Banting lecture 1990. Beta-cells in type II diabetes mellitus. Diabetes 40, 166–180. 10.2337/diab.40.2.166. - DOI - PubMed
    1. Kahn SE (2003). The relative contributions of insulin resistance and beta-cell dysfunction to the pathophysiology of Type 2 diabetes. Diabetologia 46, 3–19. 10.1007/s00125-002-1009-0. - DOI - PubMed
    1. Tura A, Grespan E, Gobl CS, Koivula RW, Franks PW, Pearson ER, Walker M, Forgie IM, Giordano GN, Pavo I, et al. (2021). Profiles of Glucose Metabolism in Different Prediabetes Phenotypes, Classified by Fasting Glycemia, 2-Hour OGTT, Glycated Hemoglobin, and 1-Hour OGTT: An IMI DIRECT Study. Diabetes 70, 2092–2106. 10.2337/db21-0227. - DOI - PubMed
    1. Wagner R, Heni M, Tabak AG, Machann J, Schick F, Randrianarisoa E, Hrabe de Angelis M, Birkenfeld AL, Stefan N, Peter A, et al. (2021). Pathophysiology-based subphenotyping of individuals at elevated risk for type 2 diabetes. Nat Med 27, 49–57. 10.1038/s41591-020-1116-9. - DOI - PubMed
    1. Weyer C, Hanson RL, Tataranni PA, Bogardus C, and Pratley RE (2000). A high fasting plasma insulin concentration predicts type 2 diabetes independent of insulin resistance: evidence for a pathogenic role of relative hyperinsulinemia. Diabetes 49, 2094–2101. 10.2337/diabetes.49.12.2094. - DOI - PubMed

Publication types