. 2023 Jan 19;83(2):219-236.e7.
doi: 10.1016/j.molcel.2022.12.019. Epub 2023 Jan 11.

RNA methylation influences TDP43 binding and disease pathogenesis in models of amyotrophic lateral sclerosis and frontotemporal dementia

Affiliations

RNA methylation influences TDP43 binding and disease pathogenesis in models of amyotrophic lateral sclerosis and frontotemporal dementia

Michael McMillan et al. Mol Cell. .

Abstract

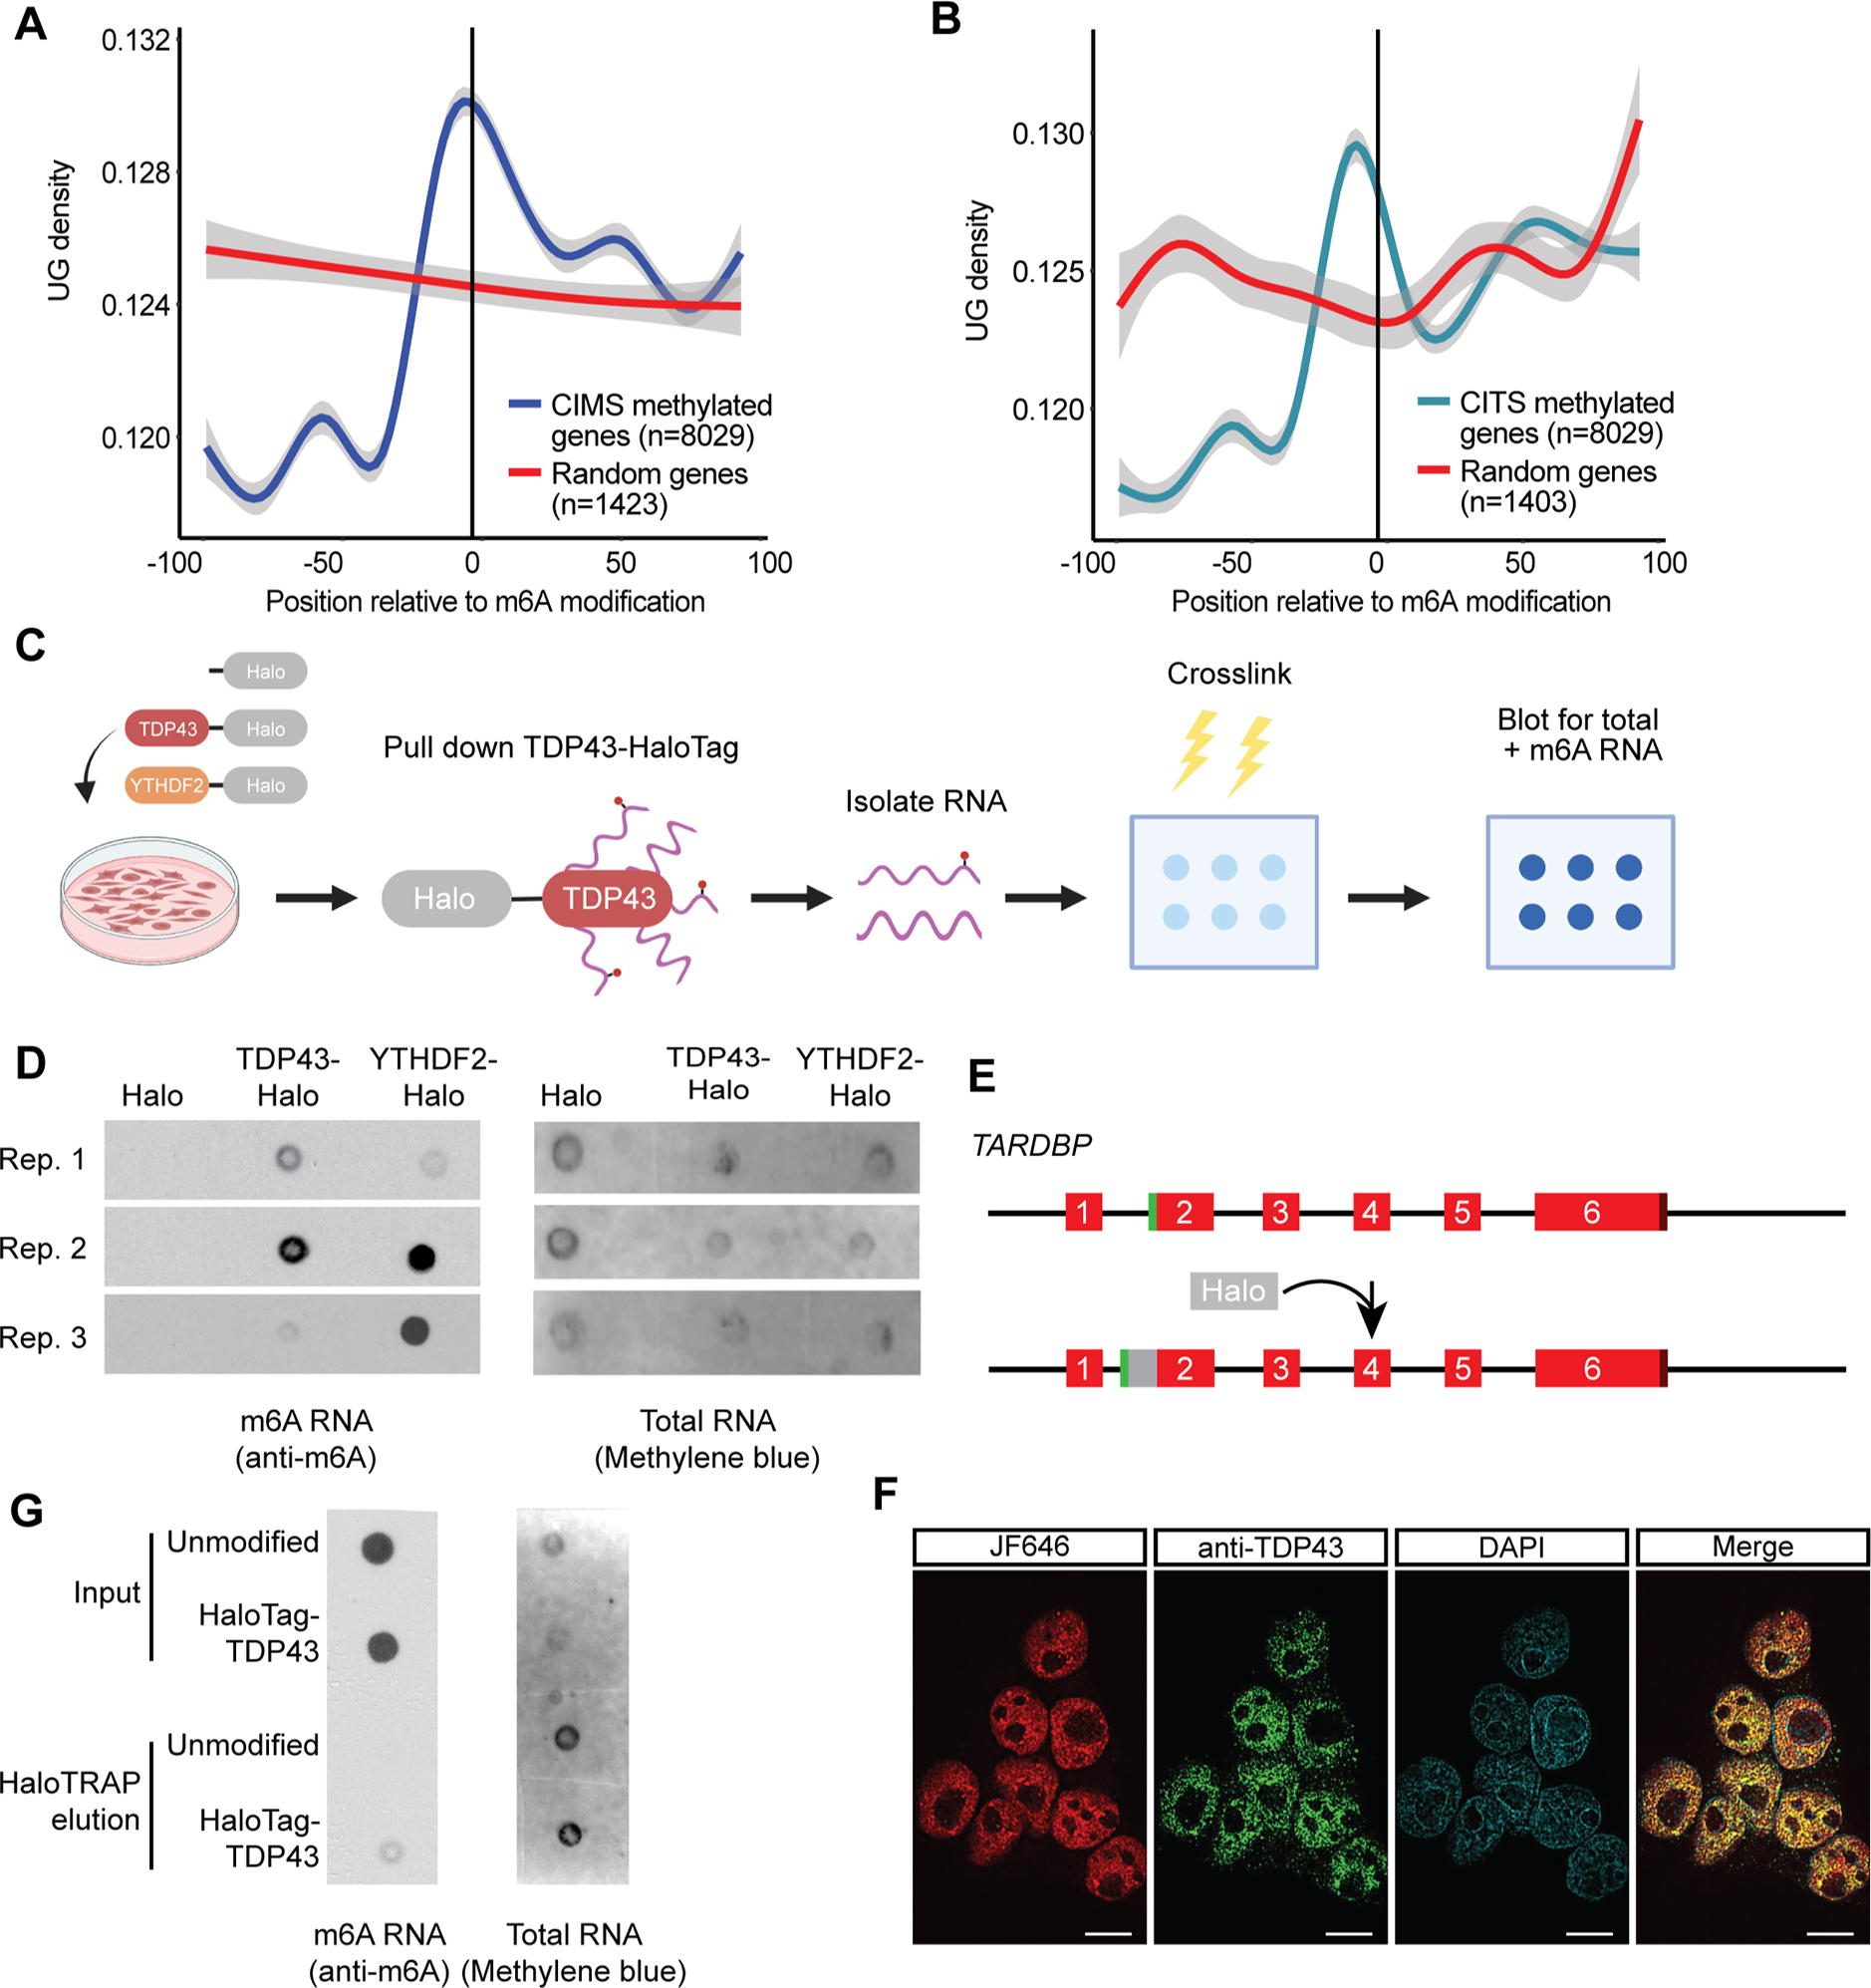
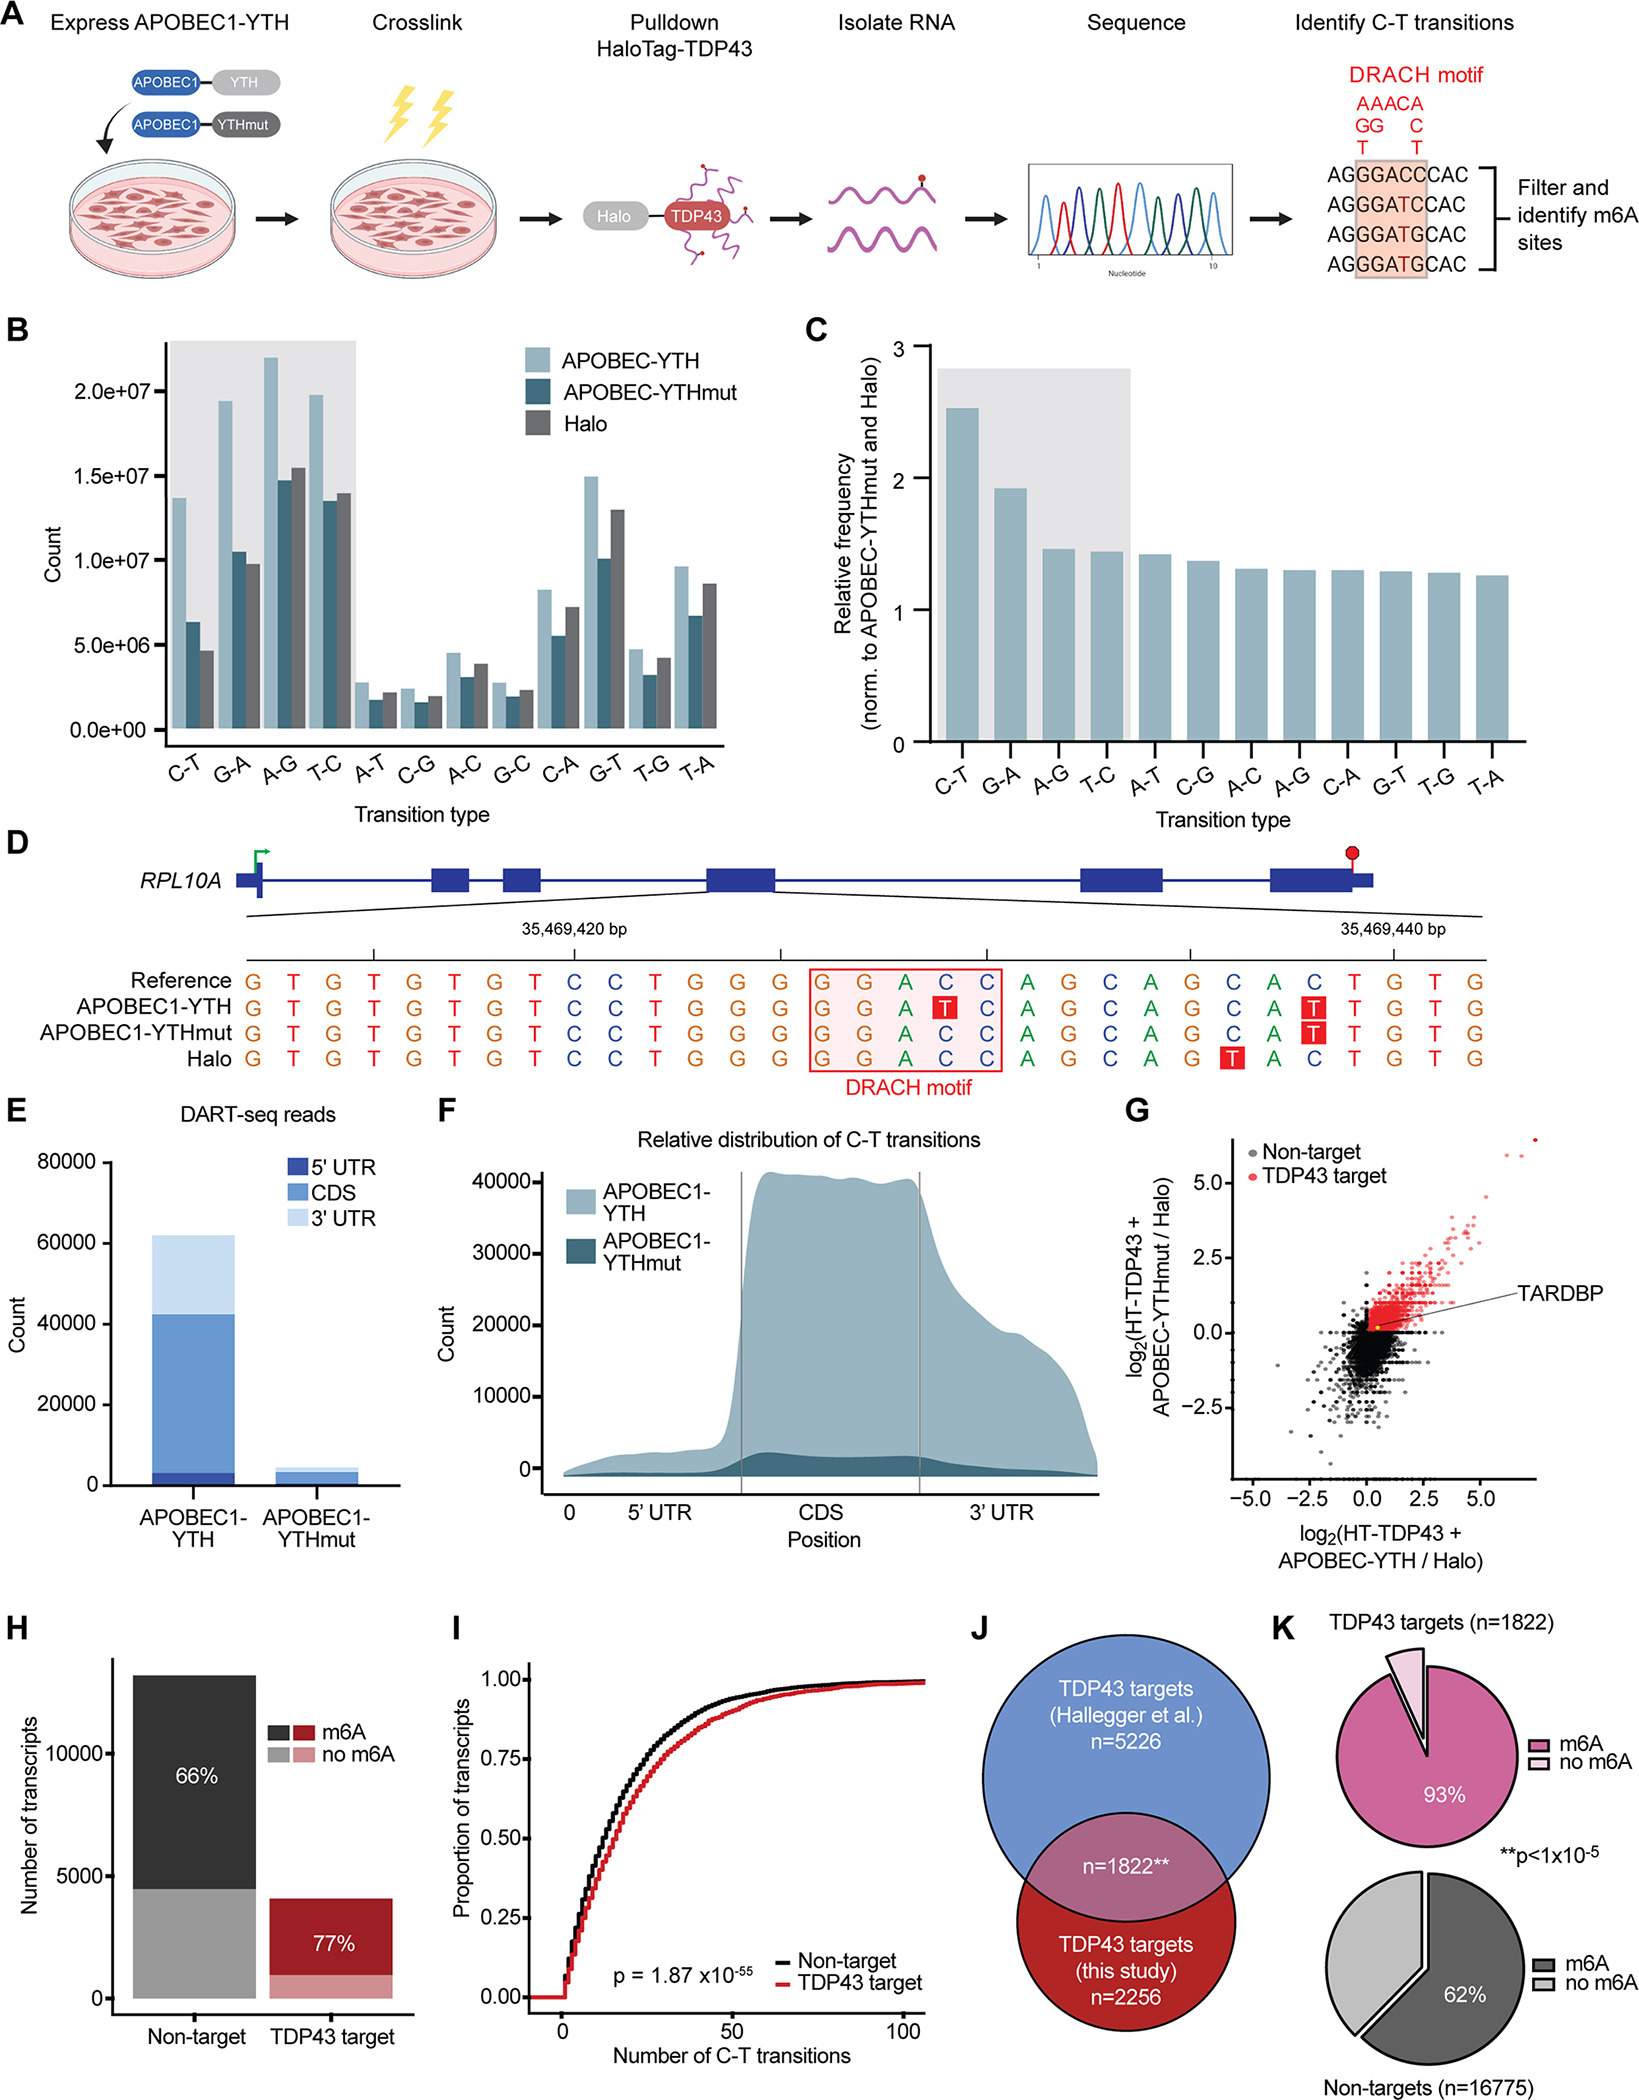
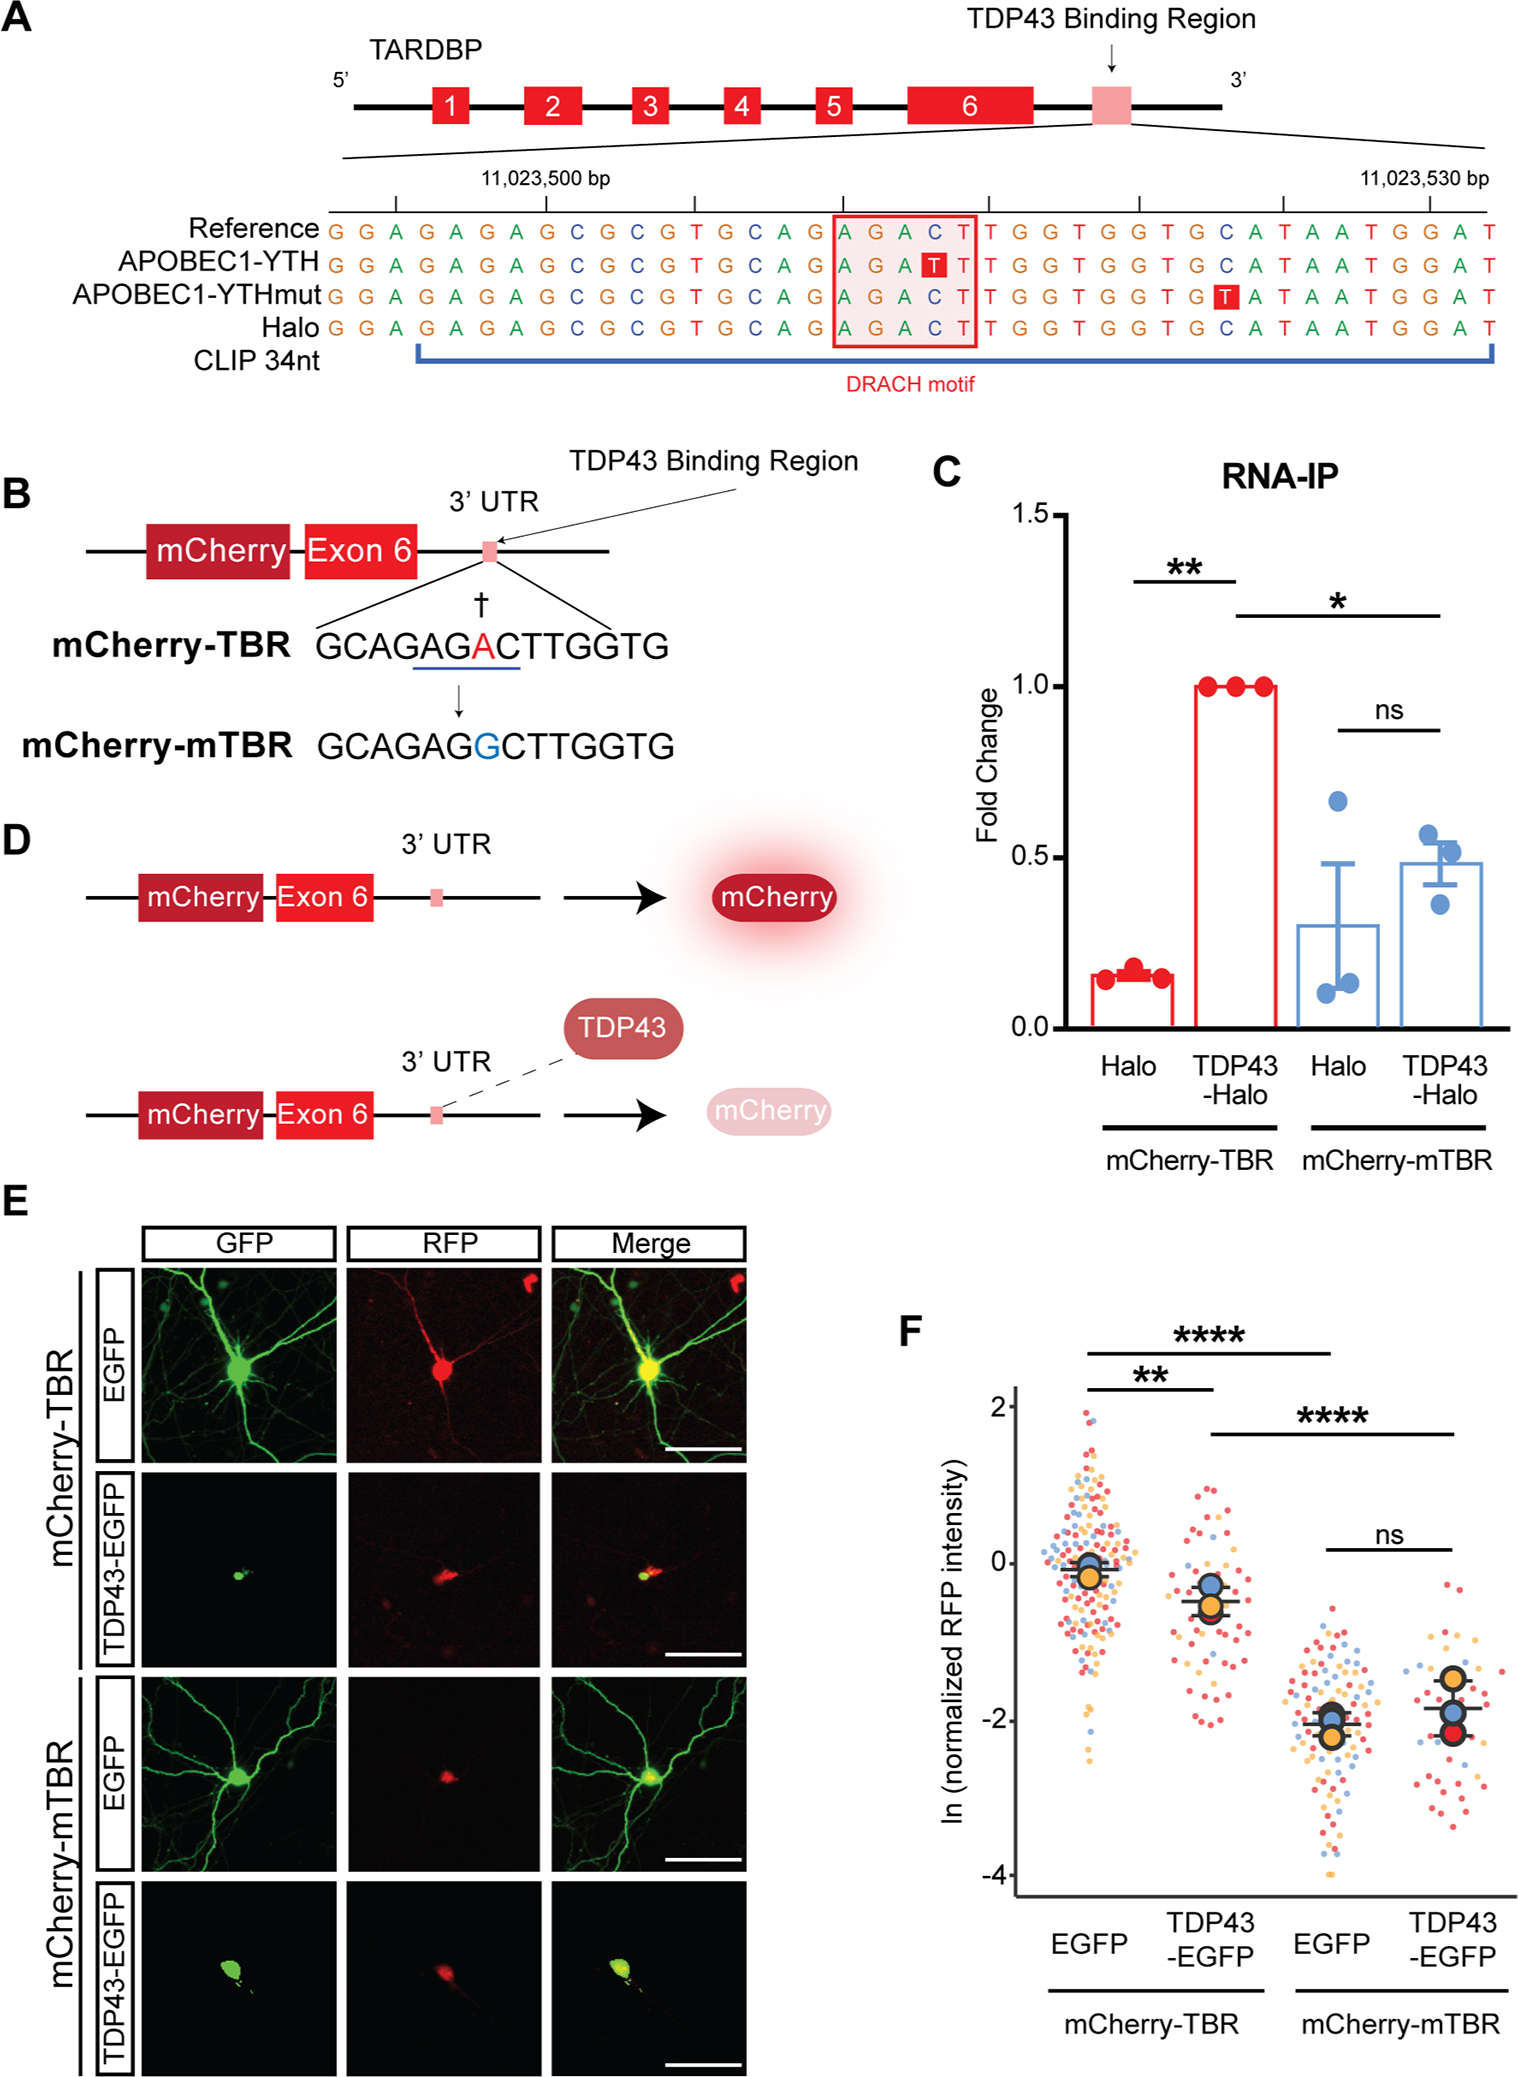
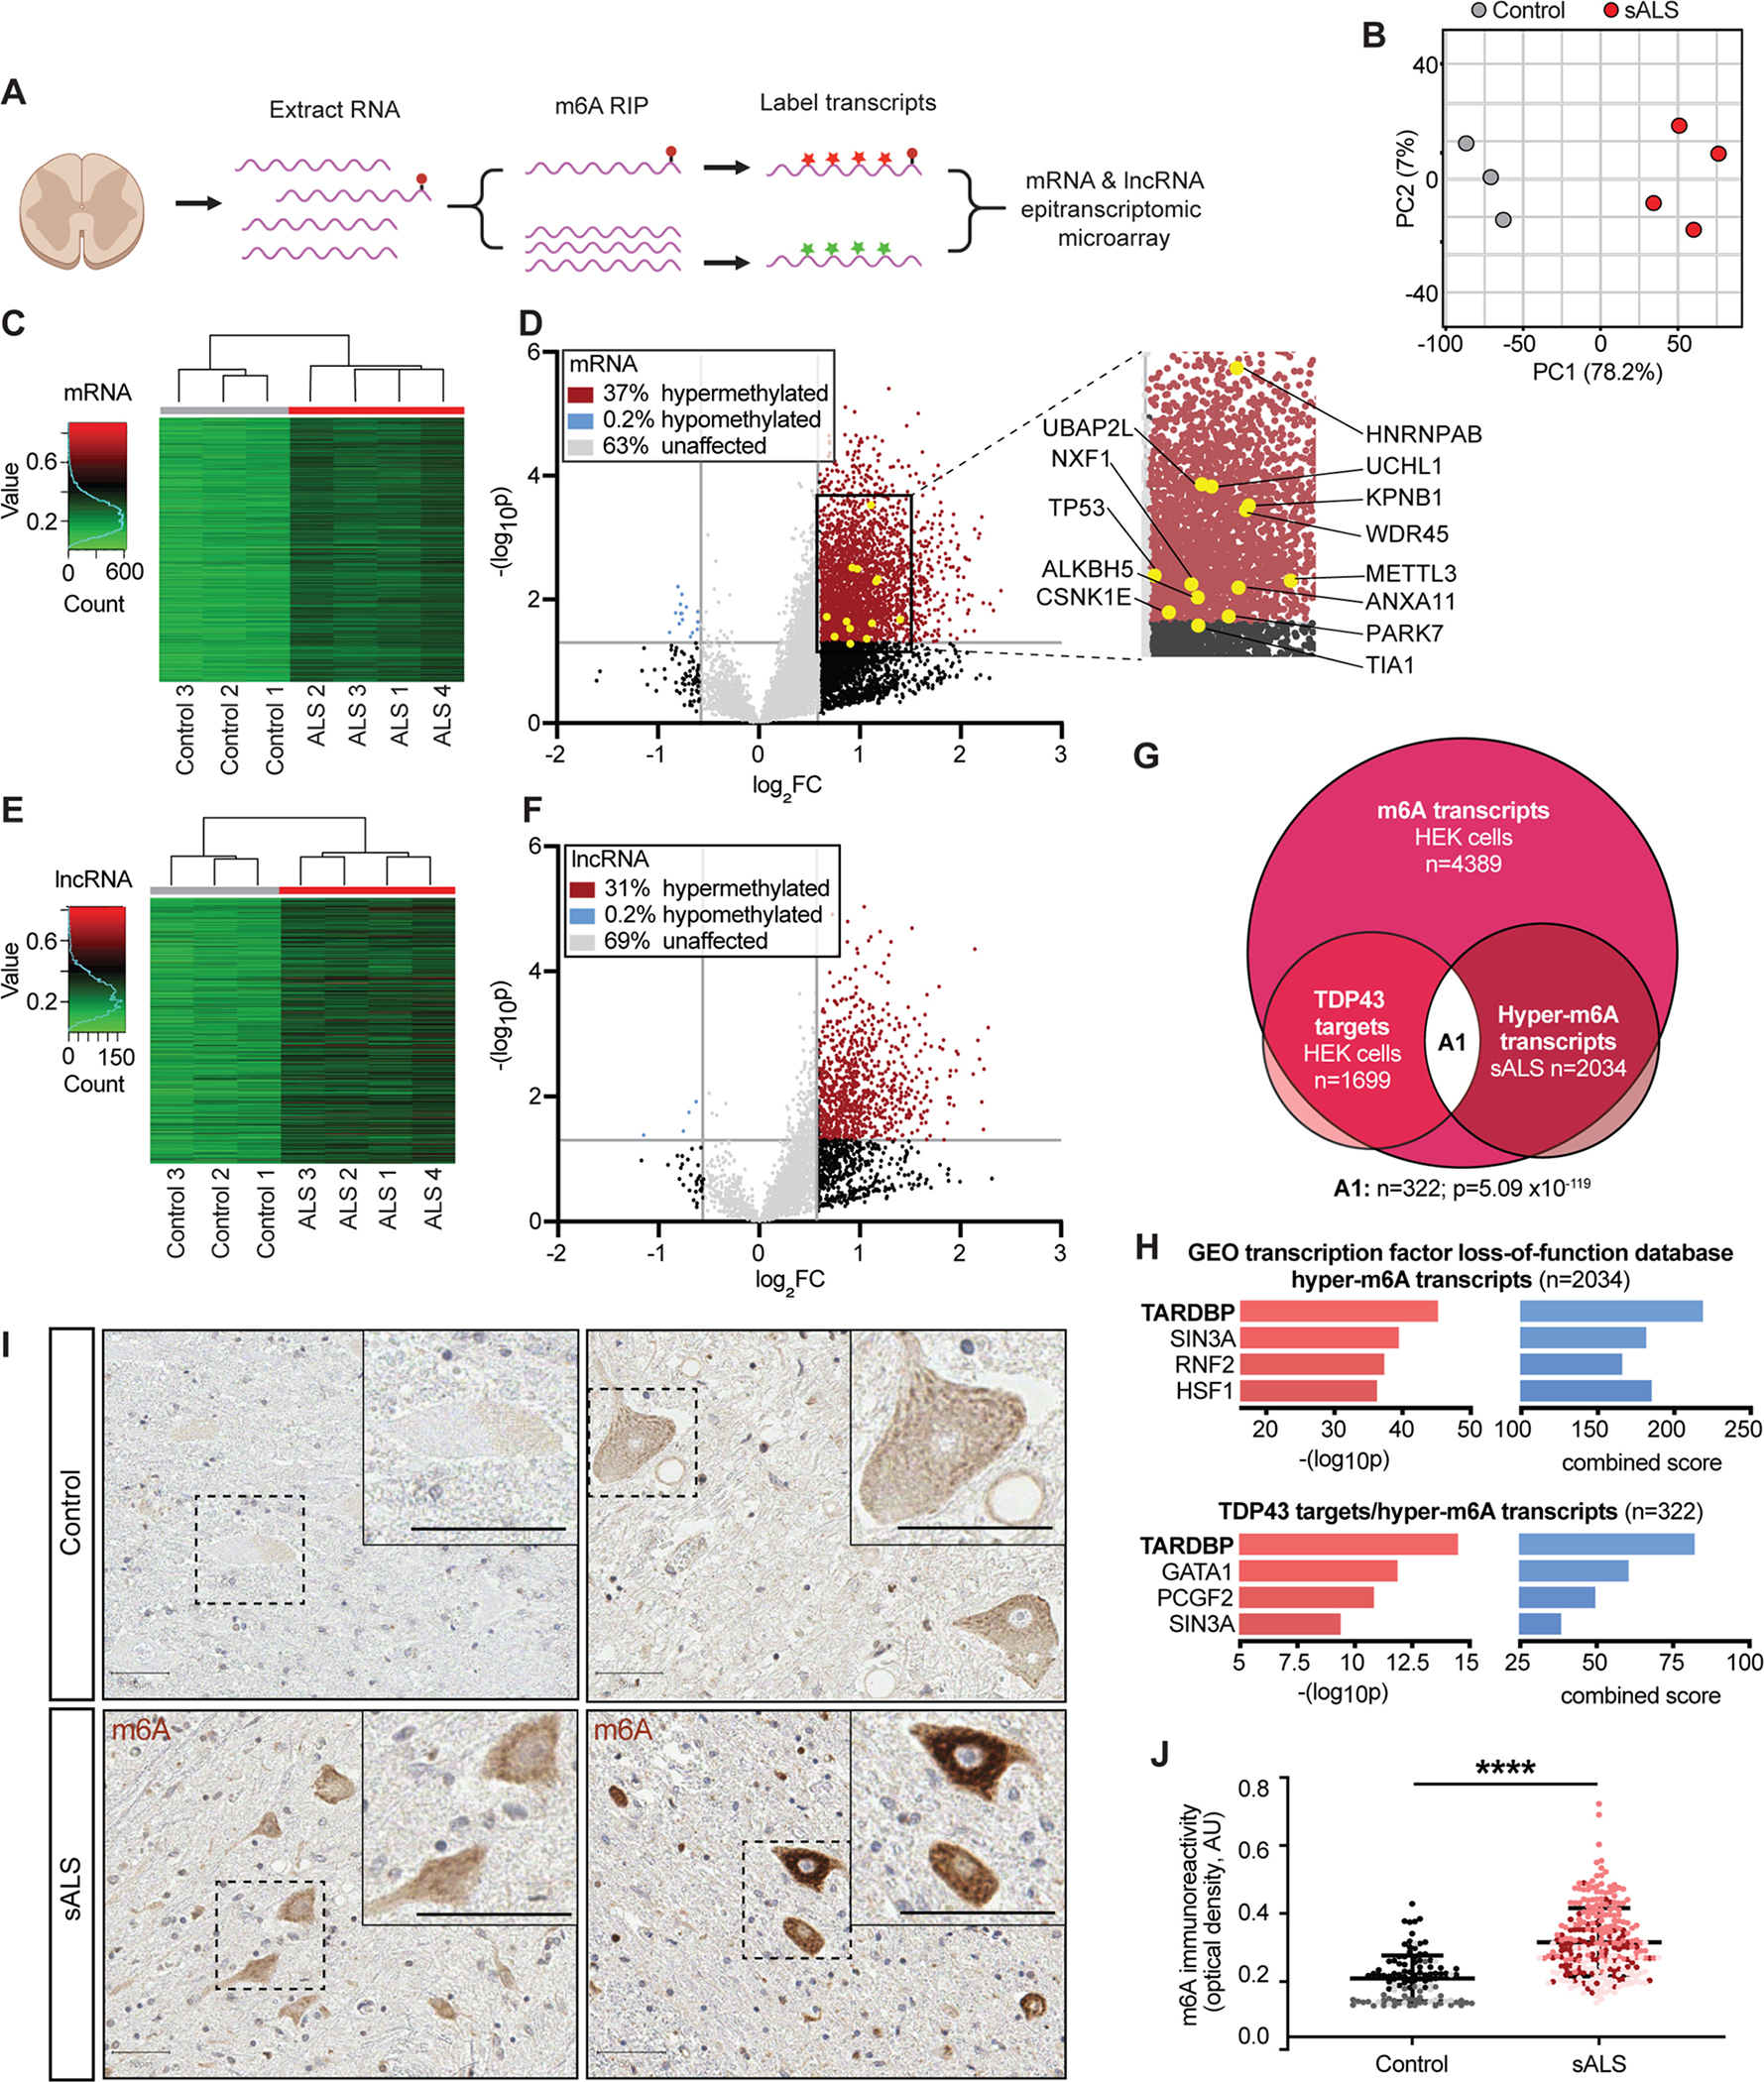
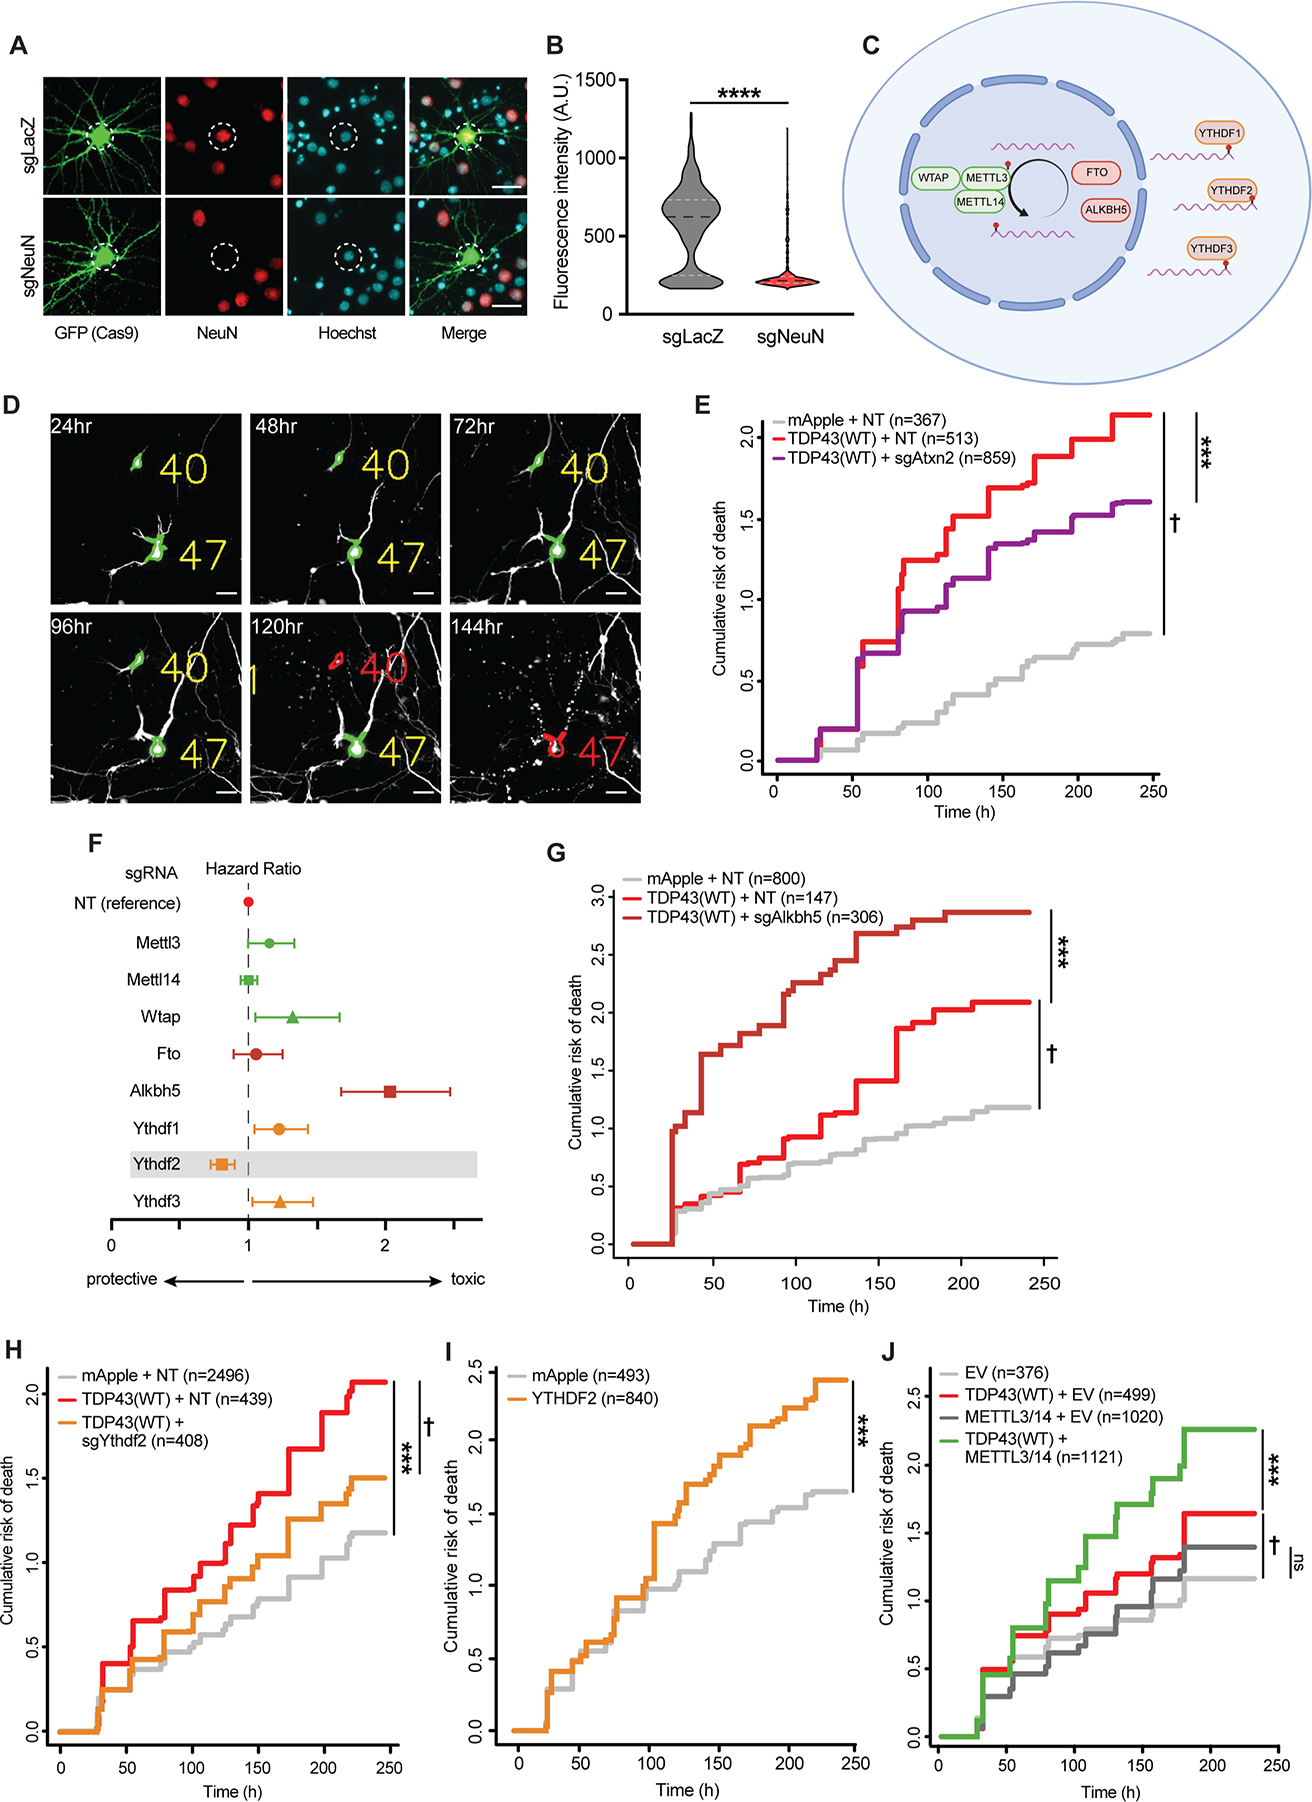
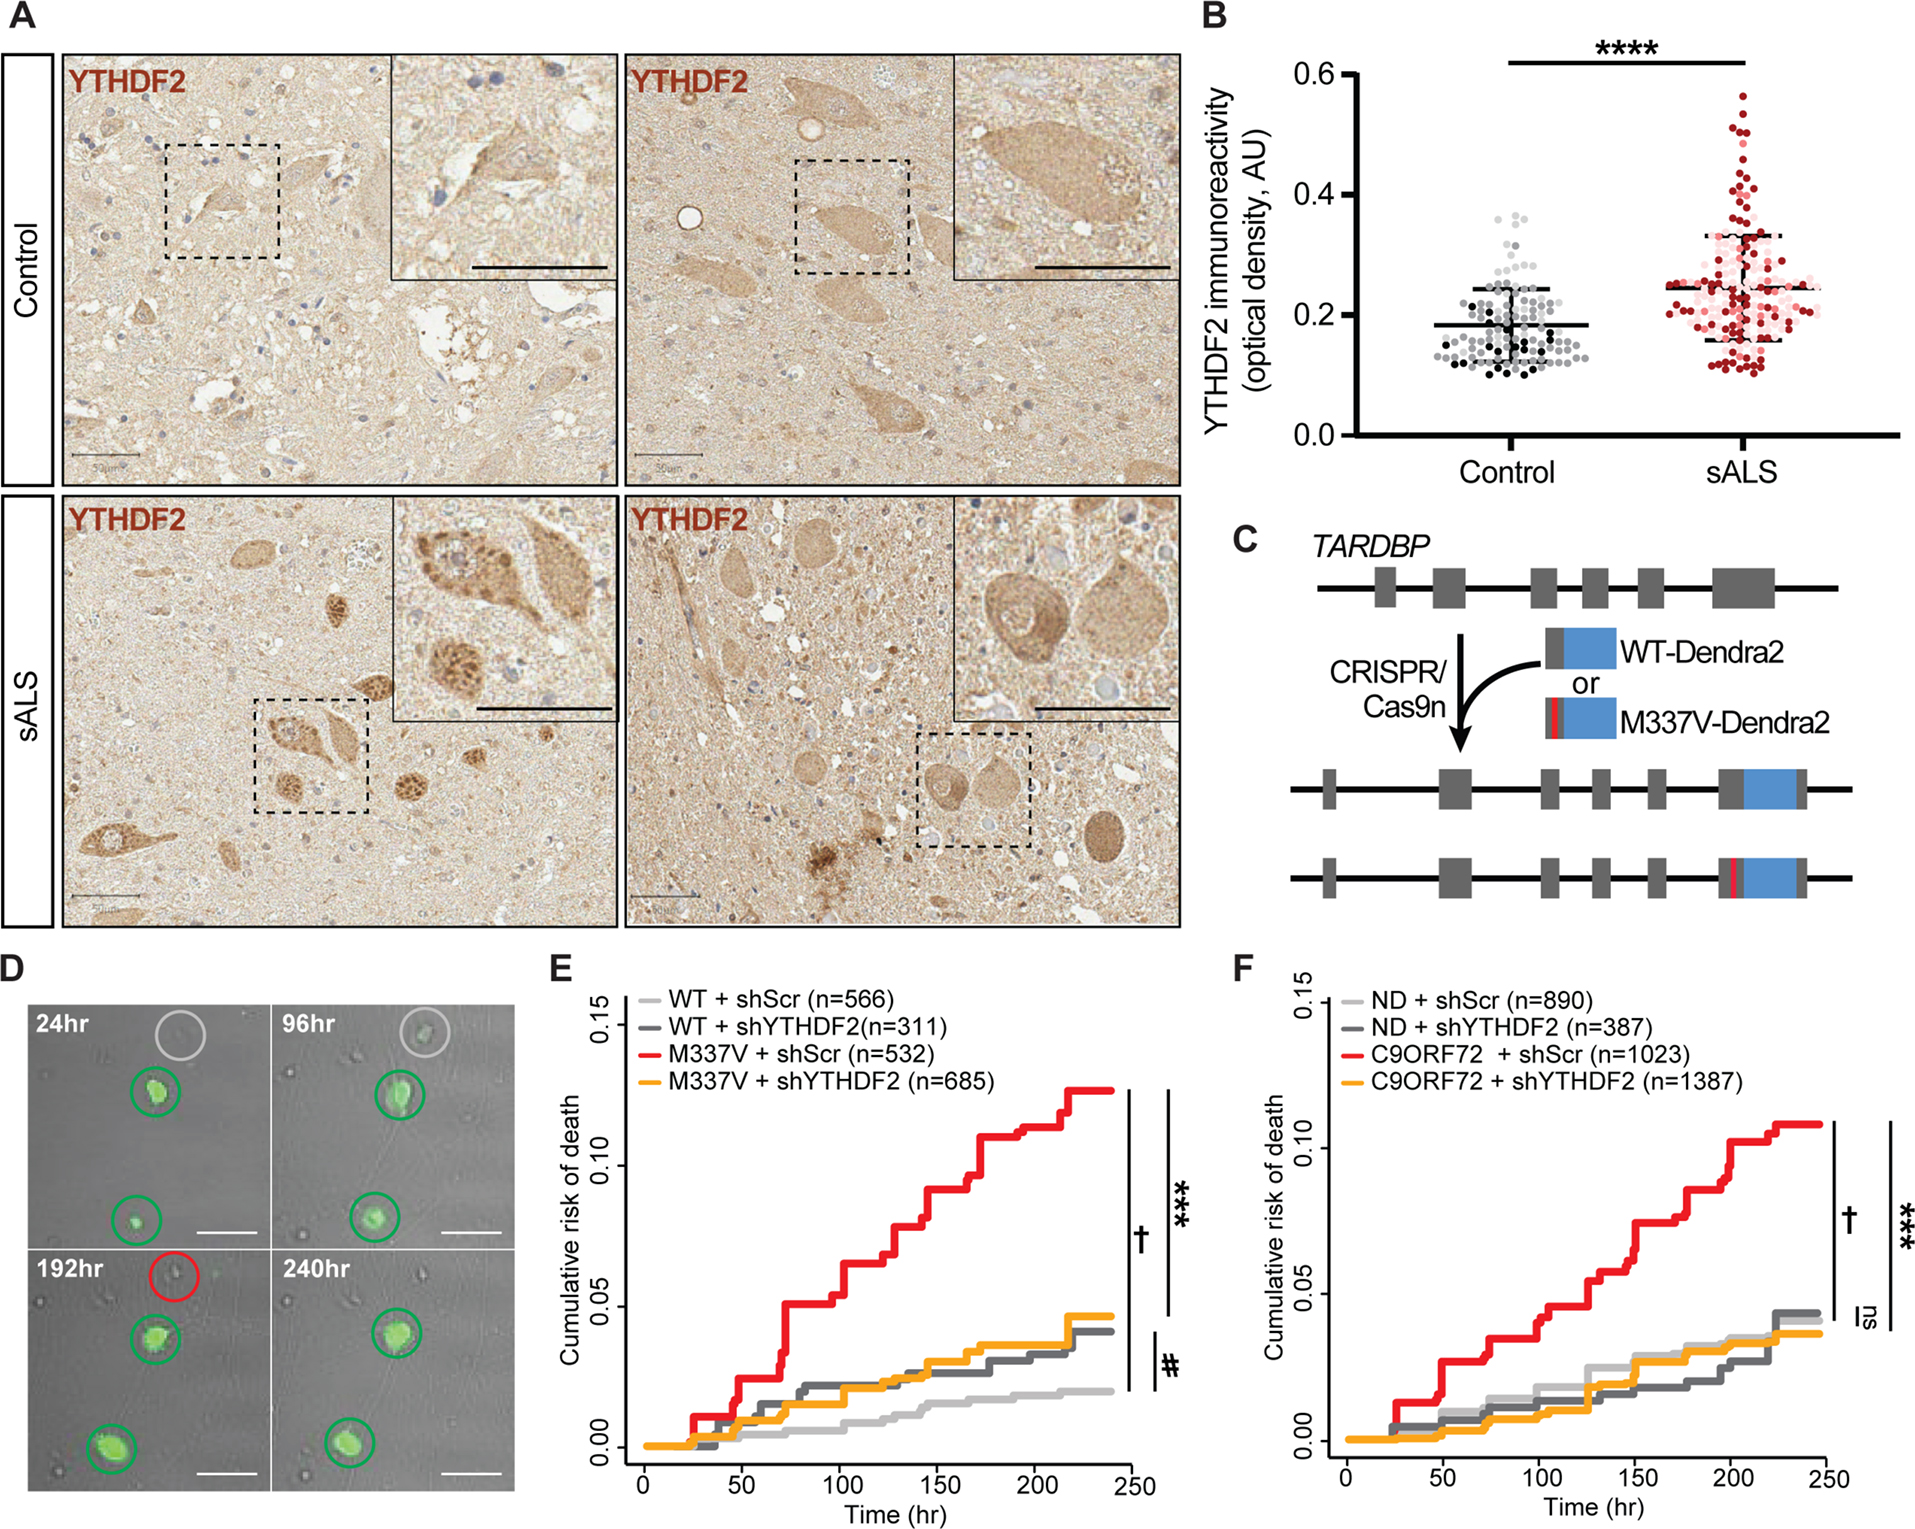
RNA methylation at adenosine N6 (m6A) is one of the most common RNA modifications, impacting RNA stability, transport, and translation. Previous studies uncovered RNA destabilization in amyotrophic lateral sclerosis (ALS) models in association with accumulation of the RNA-binding protein TDP43. Here, we show that TDP43 recognizes m6A RNA and that RNA methylation is critical for both TDP43 binding and autoregulation. We also observed extensive RNA hypermethylation in ALS spinal cord, corresponding to methylated TDP43 substrates. Emphasizing the importance of m6A for TDP43 binding and function, we identified several m6A factors that enhance or suppress TDP43-mediated toxicity via single-cell CRISPR-Cas9 in primary neurons. The most promising modifier-the canonical m6A reader YTHDF2-accumulated within ALS spinal neurons, and its knockdown prolonged the survival of human neurons carrying ALS-associated mutations. Collectively, these data show that m6A modifications modulate RNA binding by TDP43 and that m6A is pivotal for TDP43-related neurodegeneration in ALS.

Keywords: ALS; RNA modifications; TDP43; m6A; methylation; neurodegeneration.


Conflict of interest statement

Declaration of interests The authors declare no competing interests.

Figures

Figure 1:
Figure 1:. TDP43 recognizes m6A-modified RNA.
UG density 100bp up- and downstream of m6A modifications identified by cross-linking induced mutation sites (CIMS; A) or cross-linking induced truncation sites (CITS; B) in relation to random sequences (red line). Grey shading, 95% CI. (C) Schematic of HaloTag immunoprecipitation and dot blot procedure. (D) Dot blot for total RNA (detected by methylene blue) or m6A-modified RNA (detected by anti-m6A antibody) following HaloTag immunoaffinity purification in HEK293T cells overexpressing HaloTag, TDP43-HaloTag or YTHDF2-HaloTag from 3 biological replicates. (E) Diagram illustrating insertion of HaloTag downstream of the TARDBP start codon, encoding HaloTag-TDP43. (F) Halo-TDP43 HEK293T cells labeled live with JF646 dye (red), then fixed, permeabilized, and immunostained for TDP43 (green) prior to imaging. DAPI (blue) marks the nucleus. Scale bar, 10μm. (G) Dot blot for total and m6A RNA isolated by immunoaffinity purification of endogenous HaloTag-TDP43 or overexpressed HaloTag. Empty space between lanes was clipped in (D) and (E). Additional replicates shown in Fig. S1.
Figure 2:
Figure 2:. Site-specific identification of m6A-modified TDP43 substrates.
(A) Schematic of DART-seq in HaloTag-TDP43 HEK293T cells. D=A/G/T, R=A/G, H=A/C/T. Absolute counts (B) and relative frequency (C) of base pair transitions observed by RNA-seq in each condition. Shaded boxes represent transition types expected from APOBEC1 activity. (D) Example m6A sites identified by DART-seq in RPL10A. C-T transitions are highlighted in red, and DRACH motifs in pink. Green arrow, transcription start site; red hexagon, transcription stop site; thick blue bars, coding exons; thin blue bars, UTR. Absolute count (E) and relative distribution (F) of DART-seq reads in cells expressing APOBEC1-YTH and APOBEC1-YTHmut. (G) Scatter plot of TDP43 targets, determined by fold enrichment in precipitated RNA from HaloTag-TDP43 cells (expressing APOBEC1-YTH and APOBEC1-YTHmut) compared to cells transfected with HaloTag. Red dots signify transcripts showing ≥2-fold enrichment in both APOBEC1-YTH and APOBEC1-YTHmut expressing cells. (H) Stacked bar graph showing percentage of m6A modified RNA in TDP43 targets (red) and non-targets (black). (I) Cumulative distribution of RNA methylation in TDP43 targets (red) and non-targets (black). p=1.87×10−55 Kolmogorov Smirnov test. (J) Euler diagram depicting overlap between TDP43 targets identified in this study, and those identified previously by Hallegger et al.. **p=1.5×10−117, hypergeometric test. (K) Pie charts demonstrating the percentage of methylated RNA among TDP43 targets (pink) and non-targets (grey). **p<1×10⁻⁵ chi-square test.
Figure 3:
Figure 3:. m6A modifications influence TDP43 binding and autoregulation.
(A) TARDBP gene map, illustrating TDP43 binding region (TBR), the location of the DRACH motif (pink square), and the C-T transition (red box) identified by DART-seq within this domain, representing an m6A site. (B) Schematic of the TARDBP minigene reporter, consisting of the mCherry ORF upstream of TARDBP exon 6 and 3.4 Kb of the TARDBP 3’ UTR. The A residue adjacent to the putative m6A site in the WT reporter (mCherry-TBR) was mutated to a G, precluding methylation in the mutant reporter (mCherry-mTBR). Red, methylated residue; blue line, DRACH motif; †, putative m6A site. (C) Immunoaffinity purification of HaloTag-TDP43 from HEK293T cells expressing mCherry-TBR or mCherry-mTBR, followed by qRT-PCR for reporter RNA. (D) Outline of TDP43 autoregulation assay. Excess TDP43 binds to the TBR, triggering splicing, destabilization, and reduced mCherry fluorescence. (E) Primary rodent neurons were transfected with WT or mutant reporters, together with EGFP or TDP43-EGFP. After 7d, mCherry fluorescence was assessed by fluorescence microscopy. Scale bar, 20 μm. (F) Normalized RFP (mCherry) intensity at day 7. mCherry-TBR+GFP n=160, mCherry-TBR+TDP43(WT)-GFP n=58, mCherry-mTBR+GFP n=105, mCherry-mTBR+TDP43(WT)-GFP n=44. Data in D plotted as mean ± SD, color coded by biological replicate. ns, not significant; *p<0.05, **p<0.01, ***p<0.001, ****p<0.0001; one-way ANOVA with Tukey’s test.
Figure 4:
Figure 4:. RNA hypermethylation in ALS patient spinal cord.
(A) Diagram of epitranscriptomic array used to assess RNA methylation in control and ALS spinal cord. (B) Principal component analysis (PCA) plot comparing methylation levels in control (grey) and ALS (red) samples. (C) Hierarchical clustering of methylation profiles from control and ALS mRNA samples. (D) Volcano plot depicting fold change in mRNA methylation in ALS compared to control spinal cord. (E) Hierarchical clustering of lncRNA methylation in control and ALS samples. (F) Volcano plot showing fold change in lncRNA methylation in ALS compared to control spinal cord. In D and F, grey horizontal vertical lines represent p=0.05 and fold change (FC)=2. (G) Euler diagram demonstrating overlap (n=322, p=5.09×10−119, hypergeometric test) among TDP43 substrates and methylated mRNA identified in HEK293T cells, in additional to hypermethylated mRNA determined via m6A array in sALS spinal cord (comparisons were limited to the subset of transcripts expressed in both HEK293T cells and human spinal cord, nTPM>2). (H) Bar plots showing enrichment for TDP43-regulated genes among the 2034 transcripts hypermethylated in sALS spinal cord, and the 322 TDP43 targets hypermethylated in sALS (A1 in G). Combined score=(log10p*Z-score). (I) Immunohistochemistry staining for m6A in control and sALS spinal cord. Scale bars, 50 μm. (J) m6A antibody reactivity in spinal neurons from control (n=110 neurons) and sALS (n=277 neurons) sections. Plot shows mean ± SD, color coded by patient. ****p<0.0001 via Mann-Whitney test.
Figure 5:
Figure 5:. A single-cell CRISPR-based platform emphasizes the contribution of m6A factors to TDP43-dependent neurotoxicity.
(A) Rodent primary neurons were transfected with plasmids encoding Cas9-2A-EGFP and sgRNA targeting NeuN or negative control (LacZ). 5d after transfection, neurons were fixed and immunostained for NeuN (red). White dashed circles indicate nucleus, determined via Hoechst staining (blue). (B) NeuN antibody reactivity in EGFP(+) neurons expressing sgLacZ (n=565) or sgNeuN (n=654), ****p<0.0001 by Mann-Whitney. (C) Schematic depicting m6A writers (green), erasers (red), and readers (orange) targeted by CRISPR/Cas9. (D) Primary neurons expressing EGFP and TDP43-mApple were imaged at 24h intervals by fluorescence microscopy, and their time of death determined by automated survival analysis. Individual neurons (yellow) are tracked until their time of death (red). Scale bar, 20μm. (E) Expression of sgRNA targeting Atxn2 (sgAtxn2) mitigates TDP43-related toxicity in primary neurons. NT, non-targeting. p<2.0×10⁻¹⁶, hazard ratio (HR)=3.45; ***p=5.81×10⁻⁴, HR=0.80. (F) Forest plot depicting HR for TDP43-overexpressing neurons upon knockdown of m6A writers (green), erasers (dark red), and readers (orange), in comparison to NT control. Dashed line indicates the survival of neurons expressing TDP43-mApple+NT sgRNA. Values >1 indicate increased toxicity, whereas values <1 denote relative protection. Error bars, 95% CI. (G) Alkbh5 knockout significantly increases TDP43 associated toxicity. †p=3.11×10⁻⁵, HR=1.59; ***p=2.65×10⁻¹¹, HR=2.03. (H) Ythdf2 knockout extends survival in TDP43-expressing neurons. ***p<2.0×10⁻¹⁶, HR=1.69; p=6.2×10⁻⁶, HR=0.71. (I) YTHDF2 overexpression is toxic to neurons. ***p=3.07×10⁻⁵, HR=1.30. (J) METTL3/14 overexpression enhances TDP43-dependent toxicity in neurons. p=5.53×10⁻⁴, HR=1.32; ***p =4.16×10⁻⁶, HR=1.31. p values in E, G-J determined via Cox proportional hazards analysis, with a minimum 3 of biological replicates.
Figure 6:
Figure 6:. YTHDF2 reduction extends neuronal survival in human neuron disease models.
(A) YTHDF2 immunostaining in control and sALS spinal cord. Scale bar, 50 μm. (B) YTHDF2 immunoreactivity in spinal neurons from control (n=117 neurons) and sALS (n=193 neurons) samples. Plot shows mean ± SD, color coded by sample. ****p<0.0001 via Mann-Whitney test. (C) Strategy used to create isogenic iPSCs expressing native TDP43(WT)-Dendra2 or TDP43(M337V)-Dendra2. (D) Representative images of untransduced (grey) and transduced (green) iNeurons expressing shRNA against YTHDF2 (shYTHDF2). Time of death (red circles) for each cell is used to determine cumulative risk of death, plotted in (E) and (F). Scale bar, 20μm. YTHDF2 knockdown significantly extended the survival of TDP43(M337V)-Dendra2 iNeurons (E; p=8.42×10⁻¹², HR=6.25; ***p=4.82×10⁻⁹, HR=0.32; #p=0.08, HR=1.84) as well as mutant C9ORF72 iNeurons (F, p=1.42×10⁻¹¹, HR=2.85; ***p=1.42×10⁻¹⁶, HR=0.32). ns, not significant. Values in (E, F) calculated by Cox proportional hazards analysis, with a minimum 3 biological replicates.

References

    1. Charcot J., and Joffory A (1869). Deux cas d’atrophie musculaire progressive avec lesions de la substance grise et des faisceaux antero-lateraux de la moelle epiniere. Arcives Physiol. Neurol. Pathol. 2, 744–754.
    1. Neumann M (2009). Molecular neuropathology of TDP-43 proteinopathies. Int. J. Mol. Sci. 10, 232–246. 10.3390/ijms10010232. - DOI - PMC - PubMed
    1. Ou SH, Wu F, Harrich D, García-Martínez LF, and Gaynor RB (1995). Cloning and characterization of a novel cellular protein, TDP-43, that binds to human immunodeficiency virus type 1 TAR DNA sequence motifs. J. Virol. 69, 3584–3596. - PMC - PubMed
    1. Buratti E, and Baralle FE (2008). Multiple roles of TDP-43 in gene expression, splicing regulation, and human disease. Front. Biosci. 13, 867–878. - PubMed
    1. Tank EM, Figueroa-Romero C, Hinder LM, Bedi K, Archbold HC, Li X, Weskamp K, Safren N, Paez-Colasante X, Pacut C, et al. (2018). Abnormal RNA stability in amyotrophic lateral sclerosis. Nat. Commun. 9, 2845. 10.1038/s41467-018-05049-z. - DOI - PMC - PubMed