. 2023 Mar;615(7950):158-167.
doi: 10.1038/s41586-023-05704-6. Epub 2023 Jan 12.

Targeting TBK1 to overcome resistance to cancer immunotherapy

Affiliations

Targeting TBK1 to overcome resistance to cancer immunotherapy

Yi Sun et al. Nature. 2023 Mar.

Abstract

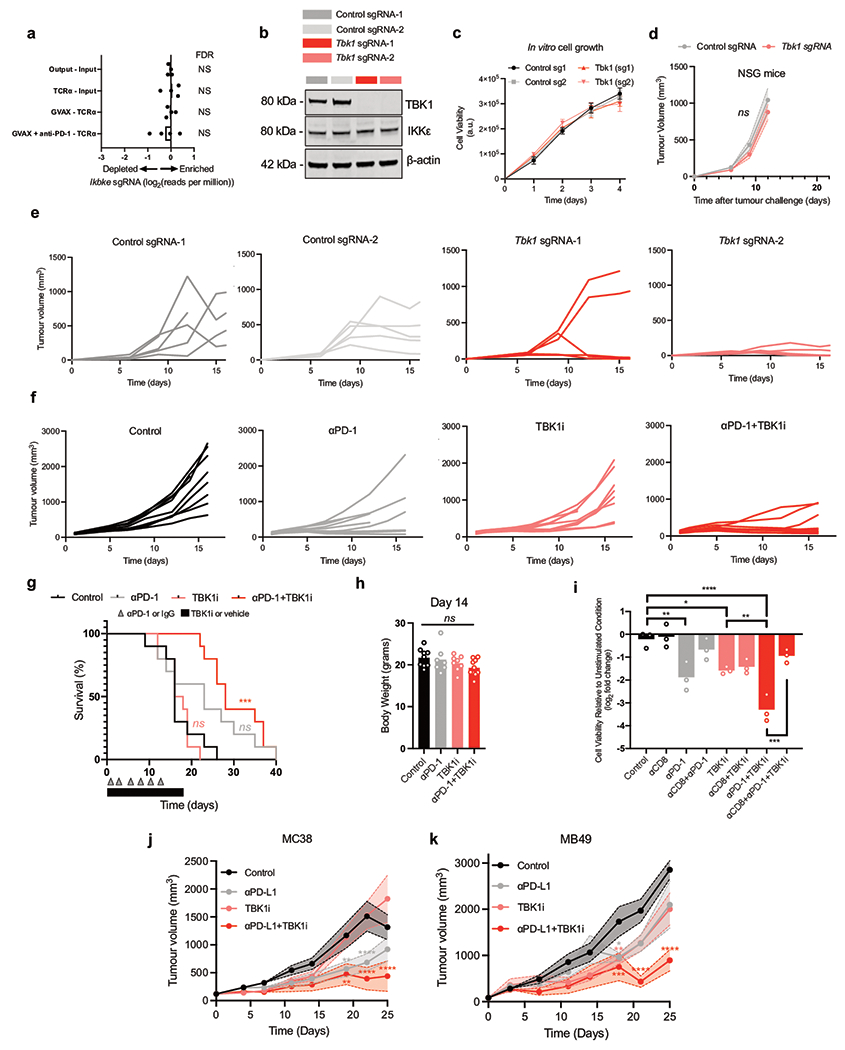
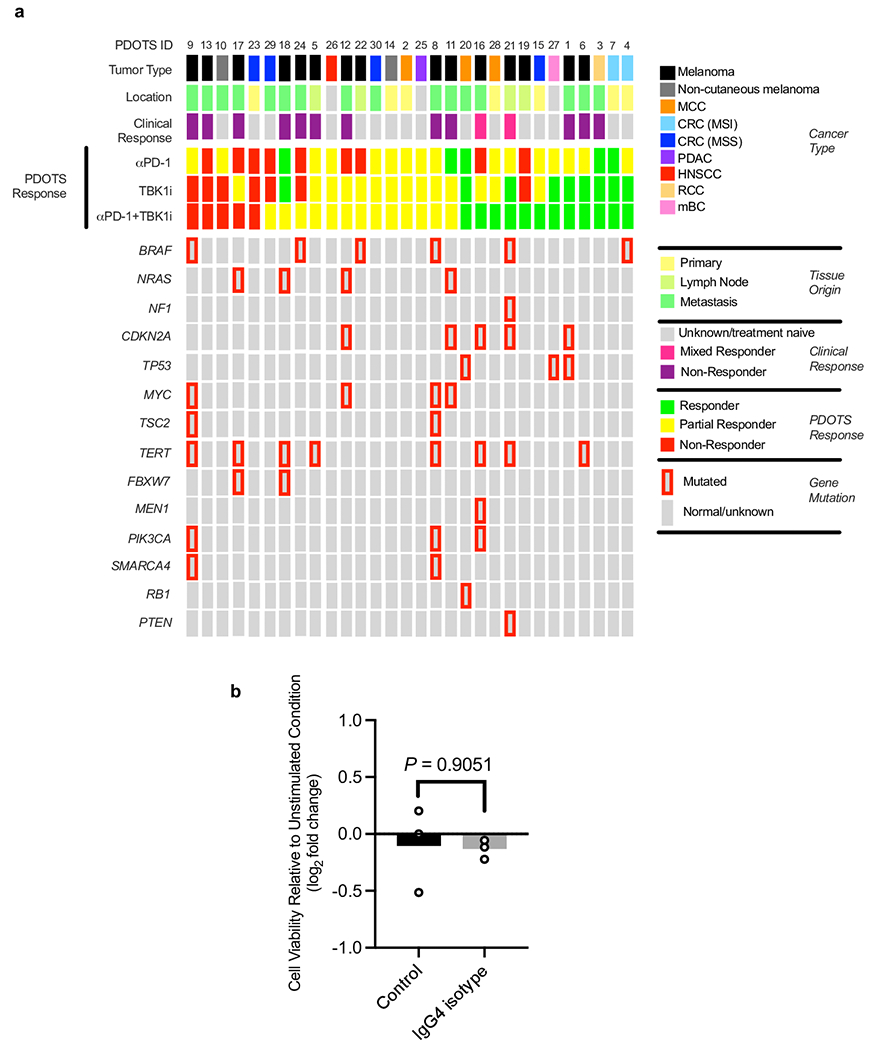
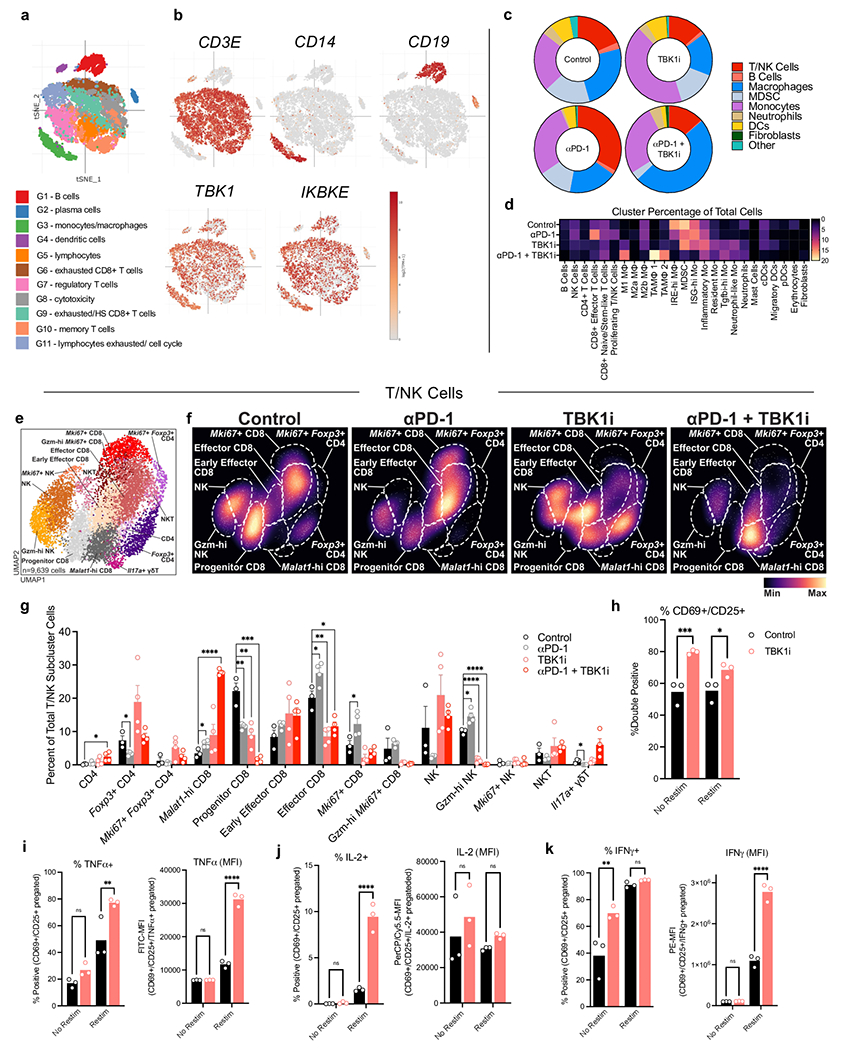
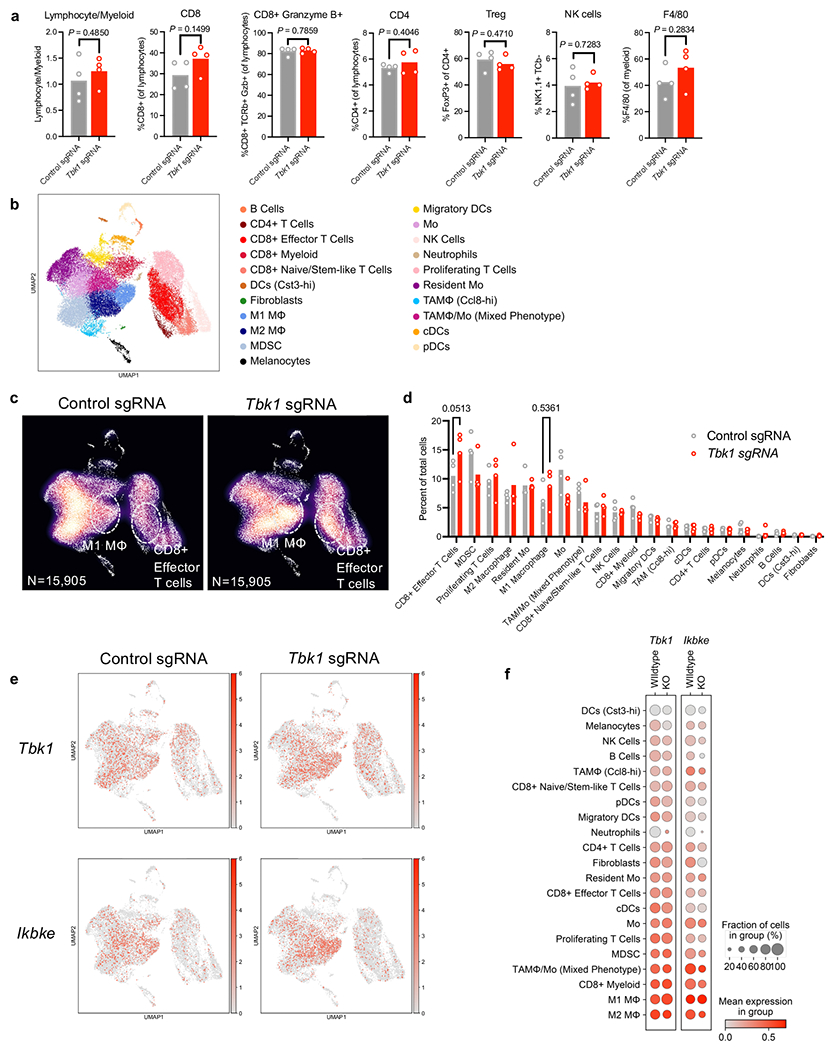
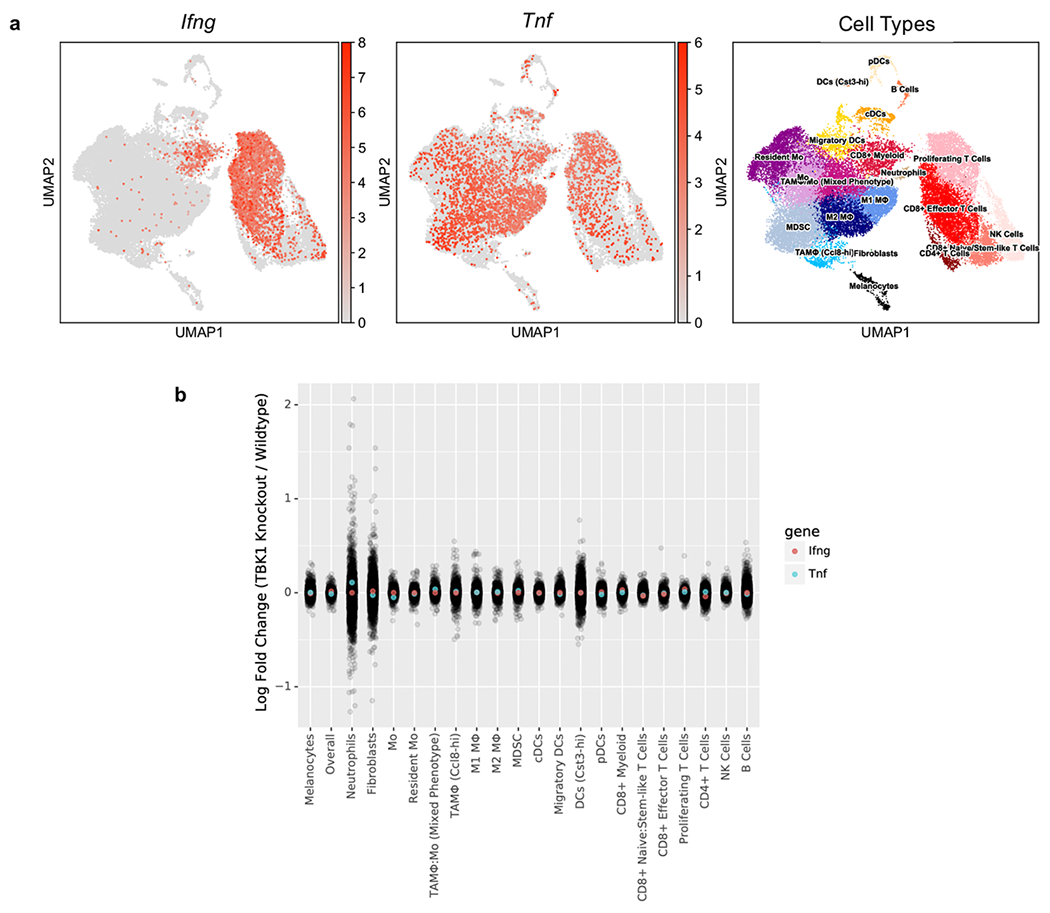
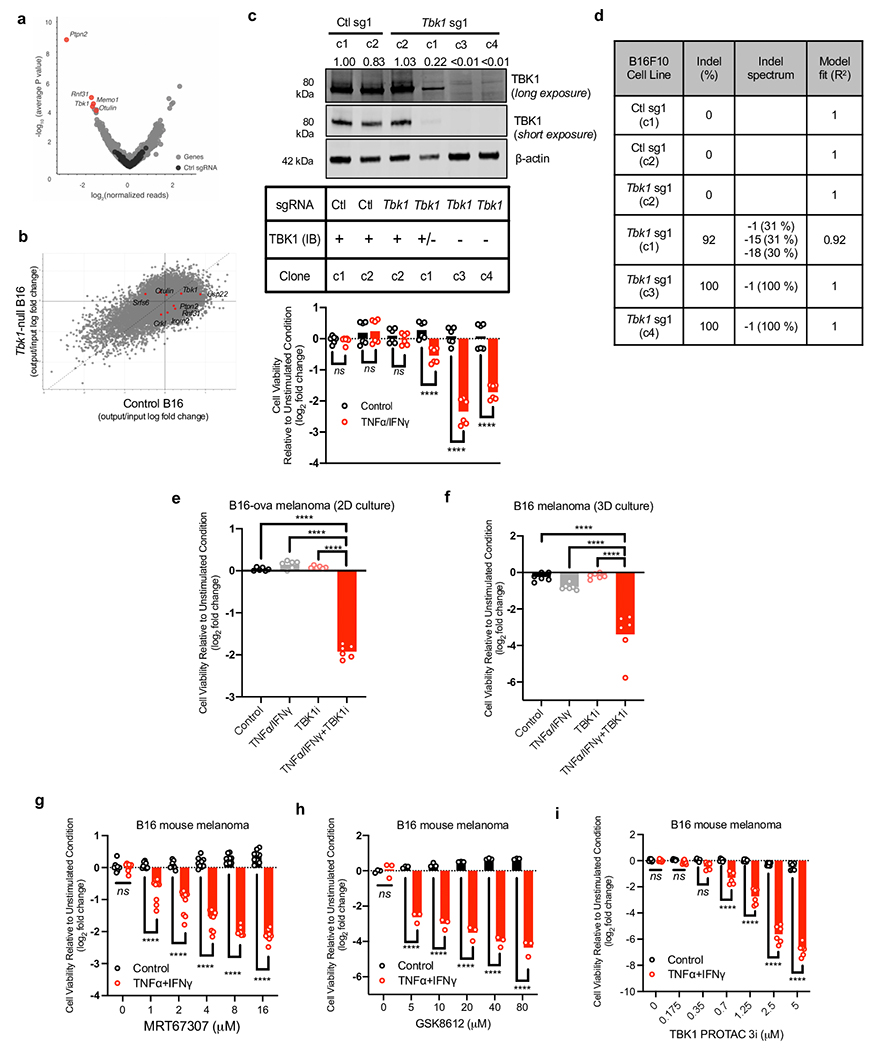
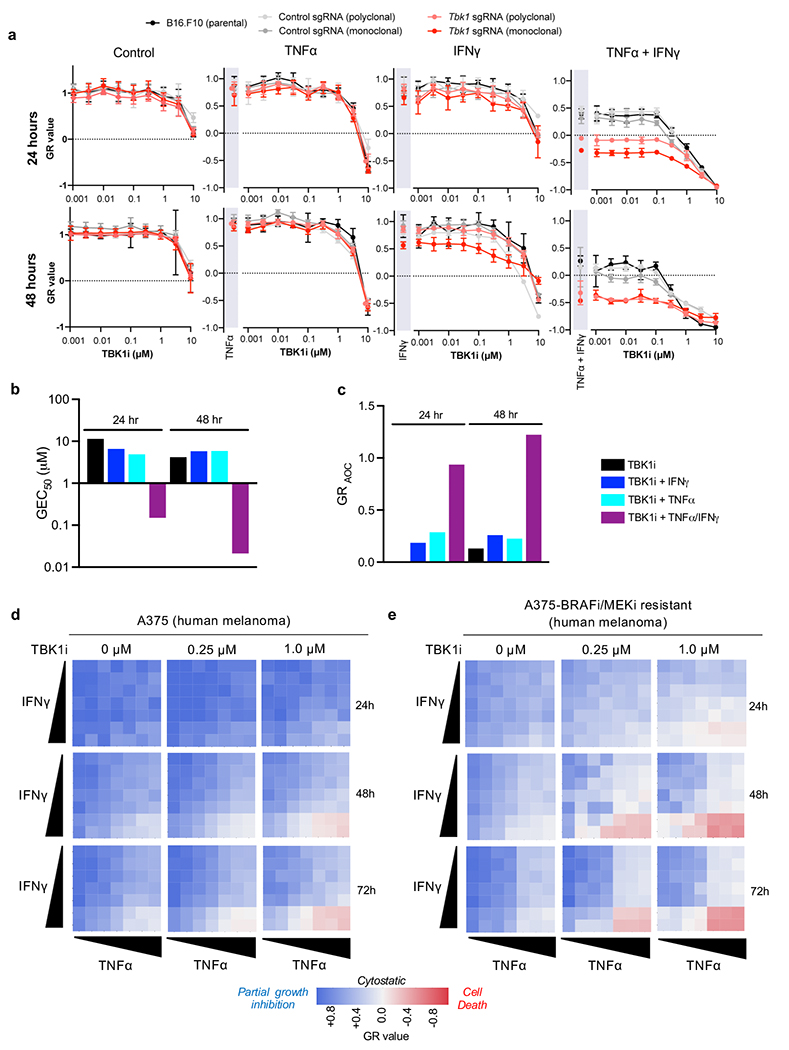
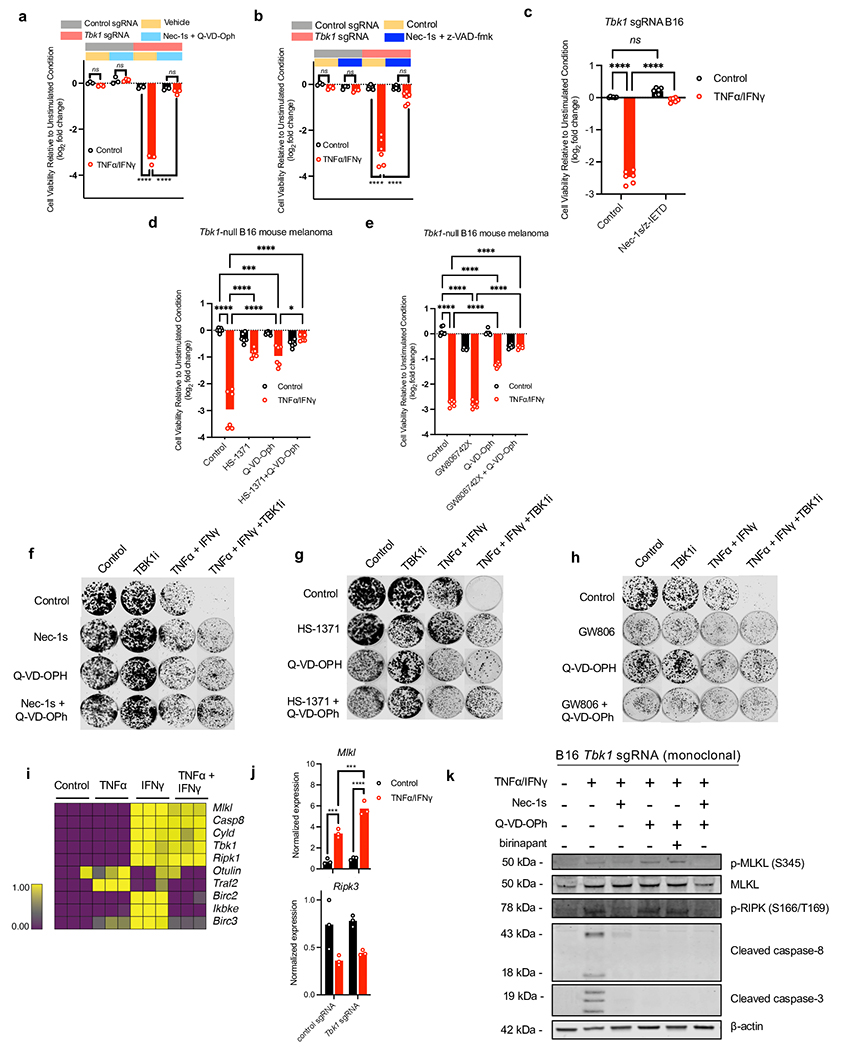
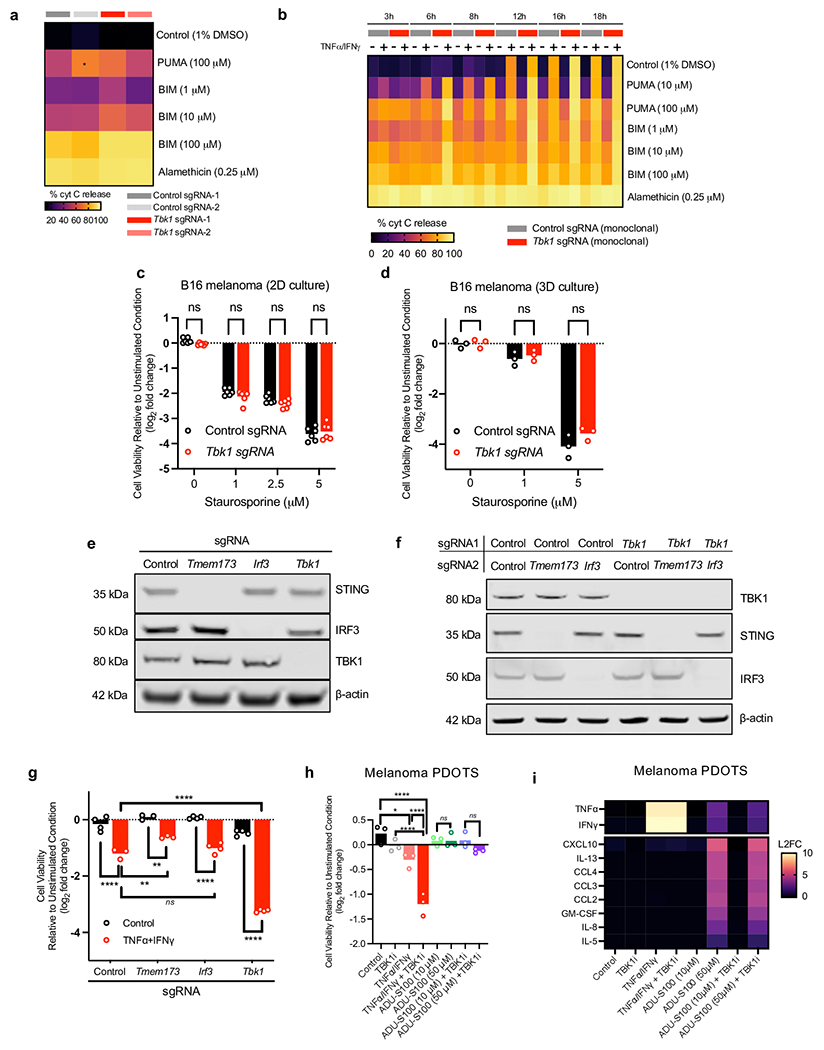
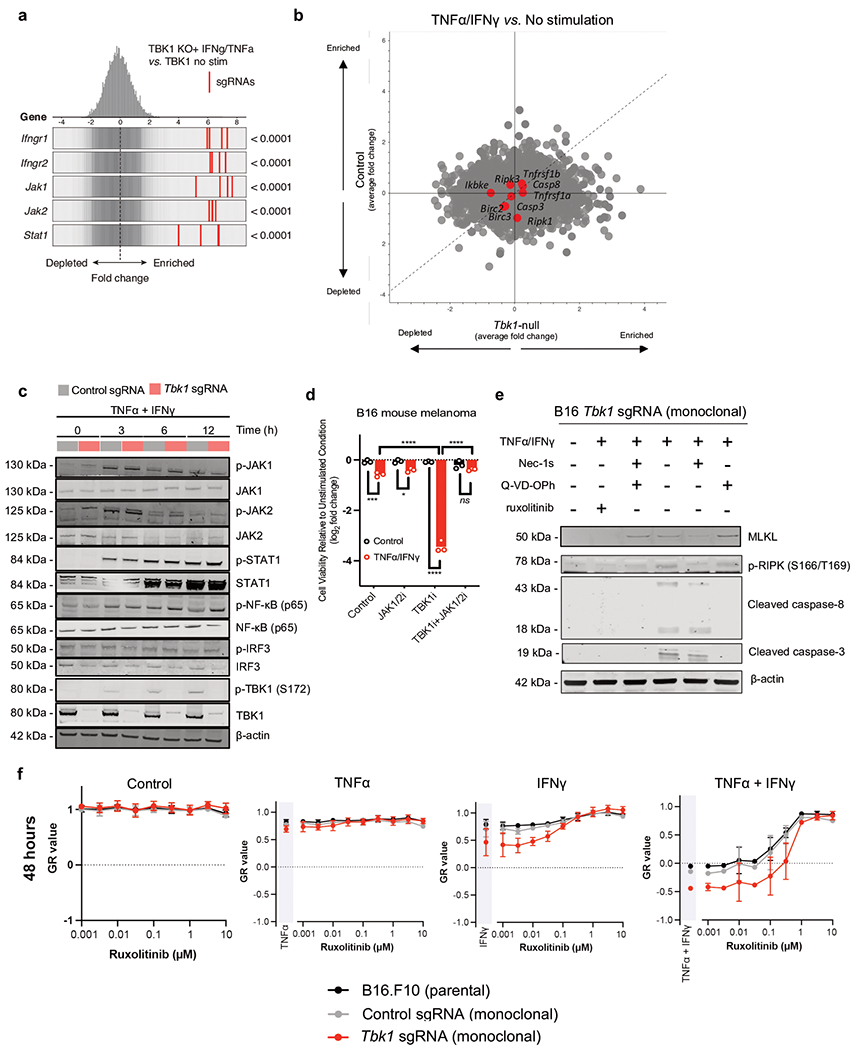
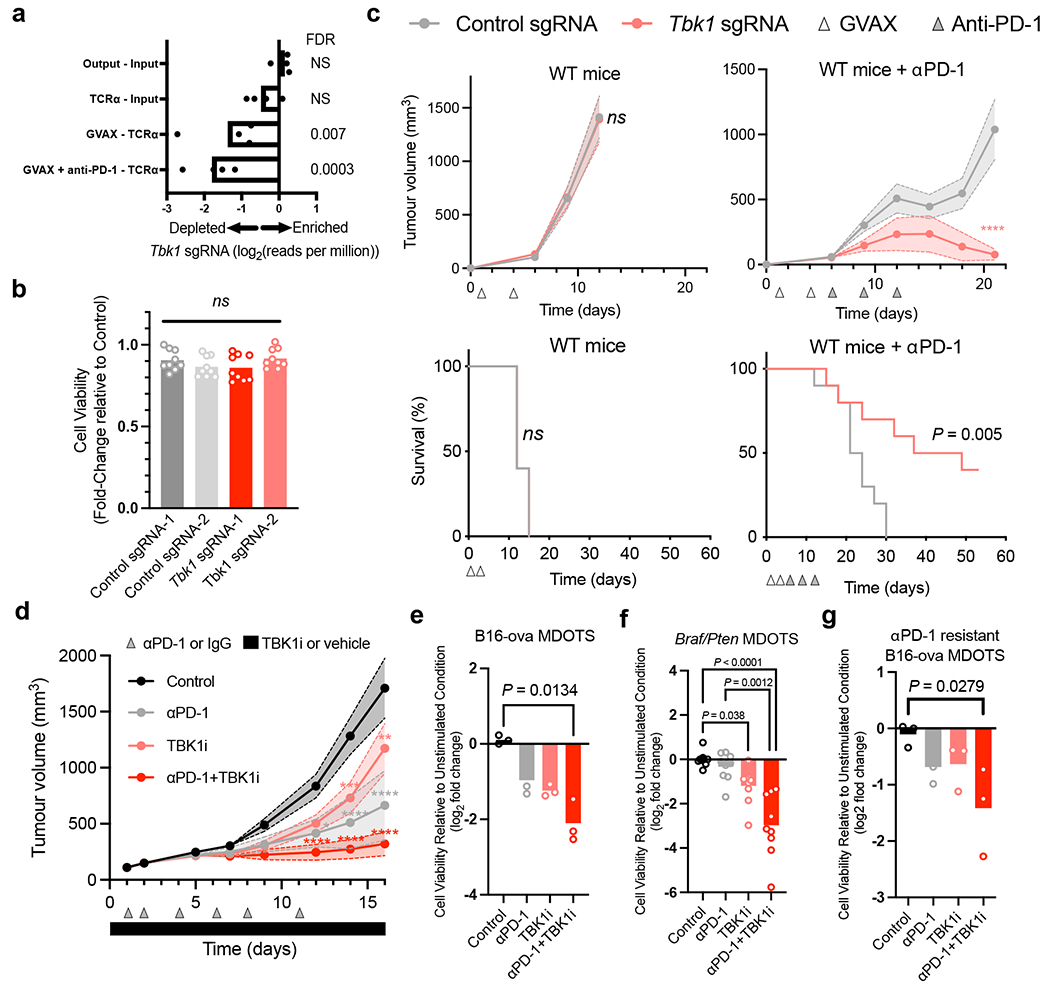
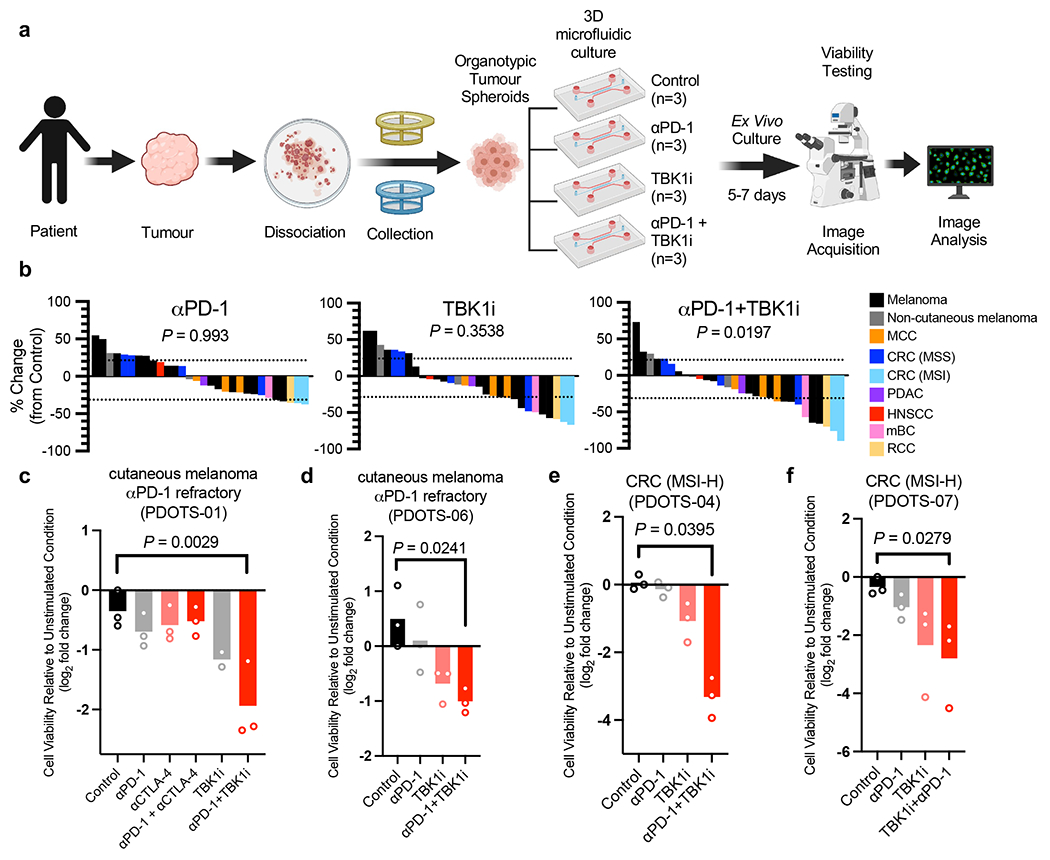
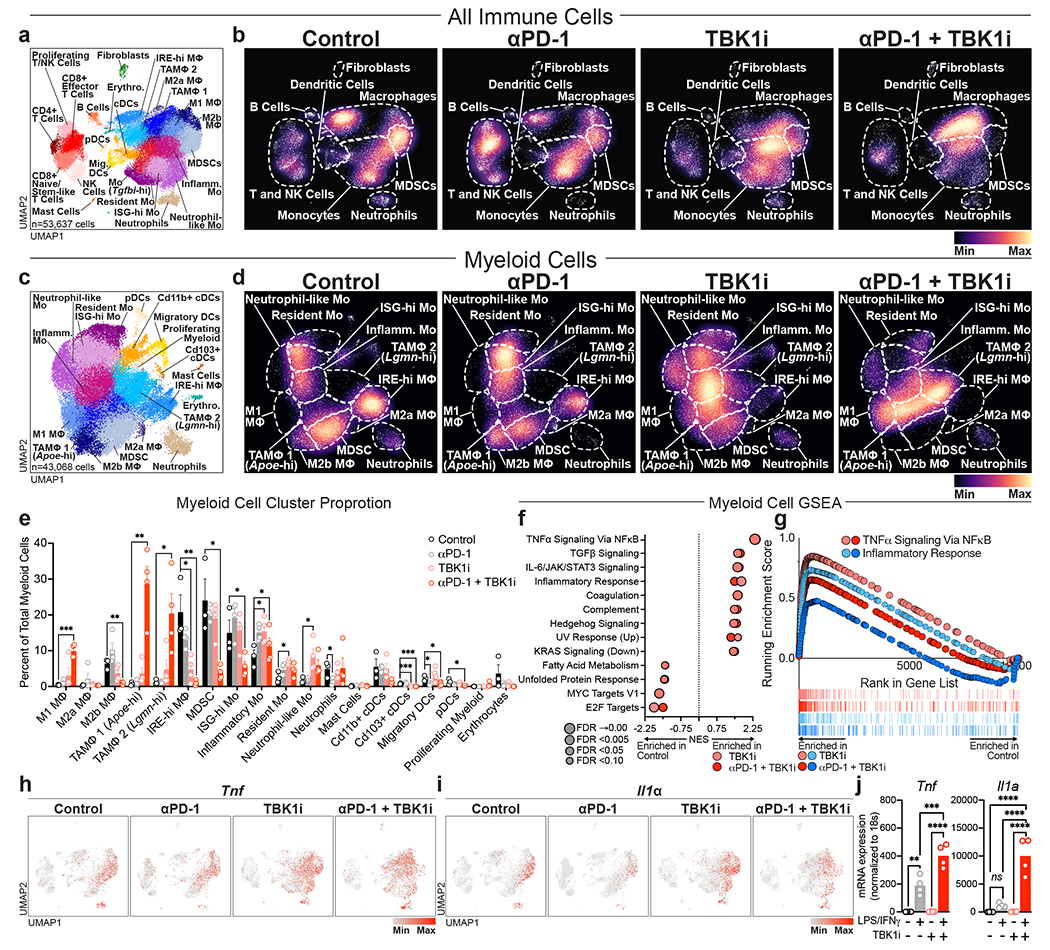
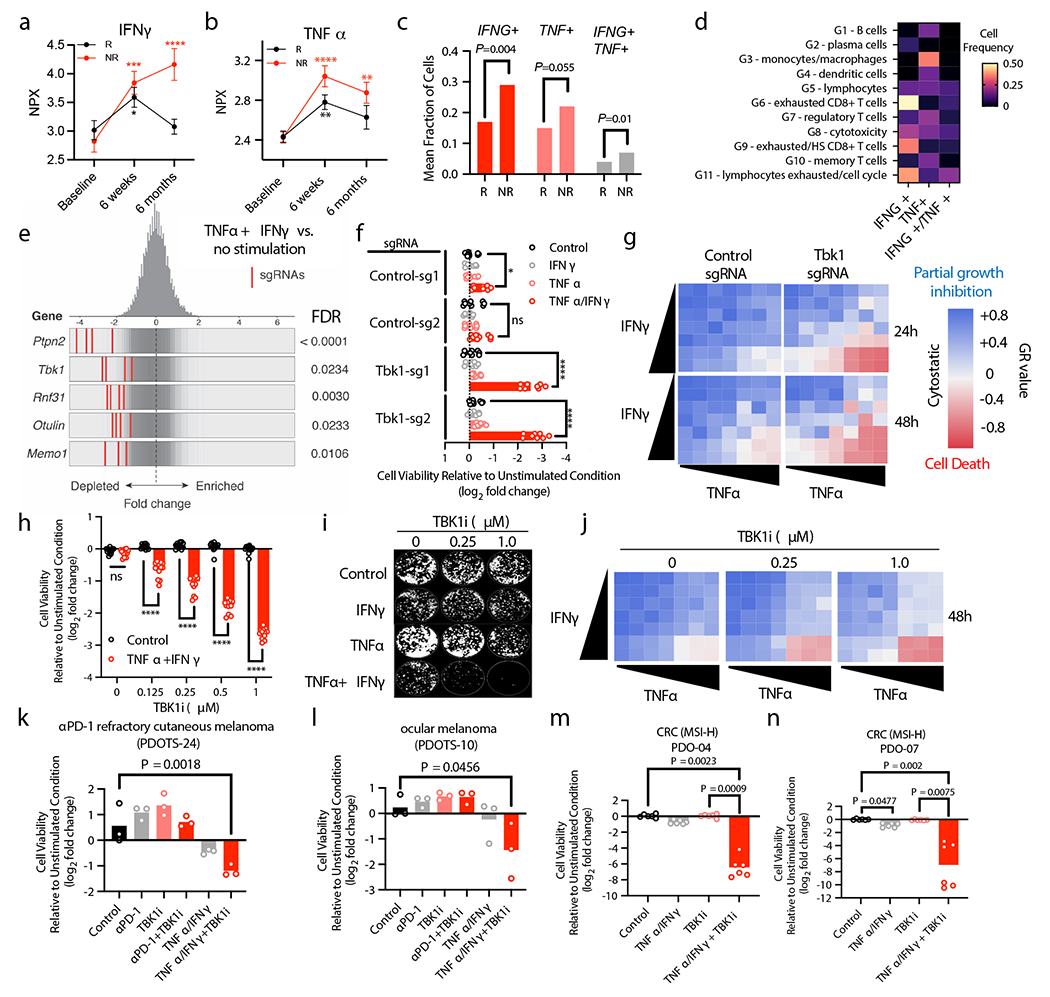
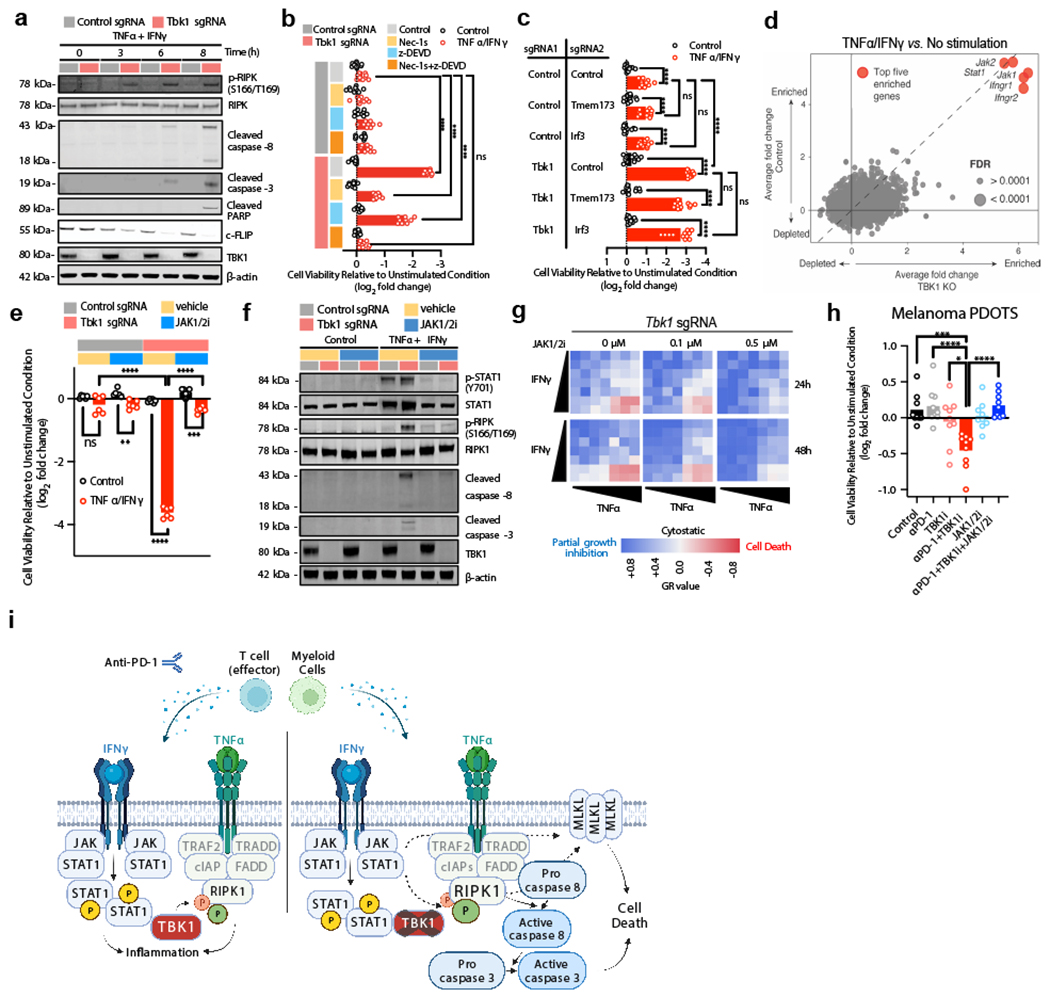
Despite the success of PD-1 blockade in melanoma and other cancers, effective treatment strategies to overcome resistance to cancer immunotherapy are lacking1,2. Here we identify the innate immune kinase TANK-binding kinase 1 (TBK1)3 as a candidate immune-evasion gene in a pooled genetic screen4. Using a suite of genetic and pharmacological tools across multiple experimental model systems, we confirm a role for TBK1 as an immune-evasion gene. Targeting TBK1 enhances responses to PD-1 blockade by decreasing the cytotoxicity threshold to effector cytokines (TNF and IFNγ). TBK1 inhibition in combination with PD-1 blockade also demonstrated efficacy using patient-derived tumour models, with concordant findings in matched patient-derived organotypic tumour spheroids and matched patient-derived organoids. Tumour cells lacking TBK1 are primed to undergo RIPK- and caspase-dependent cell death in response to TNF and IFNγ in a JAK-STAT-dependent manner. Taken together, our results demonstrate that targeting TBK1 is an effective strategy to overcome resistance to cancer immunotherapy.


Conflict of interest statement

R.W.J. is a member of the advisory board for and has a financial interest in Xsphera Biosciences Inc., a company focused on using ex vivo profiling technology to deliver functional, precision immune-oncology solutions for patients, providers, and drug development companies. A.M. is a consultant for Third Rock Ventures, LLC., Asher Biotherapeutics and Abata Therapeutics. A.M. holds equity in Asher Biotherapeutics and Abata Therapeutics. S.I.P. has received consultancy payments from Abbvie, Astrazeneca/MedImmune, Cue Biopharma, Fusion Pharmaceuticals, MSD/Merck, Newlink Genetics, Oncolys Biopharma, Replimmune, Scopus Biopharma, and Sensei Biopharma. She has received grants/research support from Abbvie, Astrazeneca/MedImmune, Cue Biopharma, Merck, and Tesaro. S.J.K. has served a consultant/advisory role for Eli Lilly, Merck, BMS, Astellas, Daiichi-Sankyo, Pieris, and Natera. S.J.K. owns stock in Turning Point Therapeutics, Inc. D.J. received consulting fees from Novartis, Genentech, Syros, Eisai, Vibliome, Mapkure, and Relay Therapeutics. D.J. conducted contracted research with Novartis, Genentech, Syros, Pfizer, Eisai, Takeda, Pfizer, Ribon Therapeutics, Infinity, InventisBio, and Arvinas. D.J. has ownership interest in Relay Therapeutics and PIC Therapeutics. D.M.M. has received honoraria for participating on advisory boards for Checkpoint Therapeutics, EMD Serono, Castle Biosciences, Pfizer, Merck, Regeneron, and Sanofi Genzyme. D.M.M. owns stock for Checkpoint Therapeutics. D.E.F. has a financial interest in Soltego, a company developing salt inducible kinase inhibitors for topical skin-darkening treatments that might be used for a broad set of human applications. R.T.M. consults for Bristol Myers Squibb. M.S.F receives research funding from Bristol-Meyers Squib.

Figures

Extended Data Fig. 1 |
Extended Data Fig. 1 |. Supporting evidence that loss of TBK1 sensitizes tumours to cancer immunotherapy.
a, Relative depletion/enrichment of Ikbke sgRNAs from a pool of sgRNAs targeting 2,368 genes expressed by Cas9-expressing B16 melanoma cells (n = 4 independent guides targeting each gene; false discovery rate (FDR) was calculated using the STARS algorithm v1.3, as previously described ,). b, TBK1 and β-actin protein levels in control and Tbk1-null B16 cells. Results are representative of three independent experiments. c, Proliferation of Tbk1-null and control B16 tumour cells following at 1-4 days of in vitro culture (n = 9 per condition from three independent experiments). d, Tumour volume of control (grey), Tbk1-null (light red) B16 tumours in NSG mice (n=5 mice per group). Mean tumour volumes (solid circles) are shown +/− s.e.m. (shaded region). 2-way ANOVA with Sidak’s multiple comparisons test. e, Spider plots for tumour volume analysis for control sgRNA-1 (black), sgRNA-2 (grey), Tbk1 sgRNA-1 (pink), and Tbk1 sgRNA-2 (red) B16 tumours in anti-PD-1-treated wild-type C57BL/6 mice (see Fig. 1c). f-g, Spider plots for tumour volume analysis (f) and survival (g) for control (black), αPD-1 (grey), TBK1i (pink), and αPD-1+TBK1i (red) B16 tumours in C57BL/6 mice (see Fig. 1d). For survival analysis (g), pairwise testing was performed using the log-rank (Mantel-Cox) test for survival (g); n=10 mice per treatment group, ***P < 0.001; ns, not significant, compared to control group. h, body weight of mice bearing B16-ova tumours on Day 14 of indicated treatment. Means (bars) and individual values (open circles) are shown (n = 10 mice per group, 1-way ANOVA with Tukey’s multiple comparisons test; ns, not significant). i, Viability assessment of CT26 MDOTS with indicated treatments. Means (bars) and individual values (open circles) are shown (n = 3, biological replicates, one-way ANOVA with Tukey’s multiple comparisons test; *P < 0.05; **P < 0.01; ***P < 0.001; **** P < 0.0001). j-k, Tumour volume analyses of mice bearing MC38 (j) and MB49 (k) tumours treated with TBK1i, αPD-L1, or combination compared to control (IgG + vehicle); n=10 mice per treatment group. Mean tumour volumes (solid circles) are shown +/− s.e.m. (shaded region). 2-way ANOVA with Tukey’s multiple comparisons test ***P < 0.001; compared to control group.
Extended Data Figure 2 |
Extended Data Figure 2 |. Supporting data that TBK1 inhibition enhances sensitivity to PD-1 blockade using PDOTS.
a, Tumour type, tissue source (location), clinical response data, PDOTS response data, and associated tumour mutation profile for specimens used for PDOTS profiling (samples ordered by ex vivo PDOTS response to combined αPD-1+TBK1i). PDOTS response parameters defined as follows: responder (reduction >30% compared to control), partial responder (<30% reduction and <20% growth compared to control), and non-responder (>20% growth compared to control). Red border around grey rectangle indicates presence of alteration in indicated gene. b, effect of IgG4 control monoclonal Ab on viability of PDOTS from a patient with melanoma. Means (bars) and individual values (open circles) are shown (n = 3, biological replicates, 2-sided unpaired t-test).
Extended Data Figure 3 |
Extended Data Figure 3 |. Effect of TBK1 inhibition on the tumour immune microenvironment.
a-b, tSNE plot of 11 clusters of CD45+ cells (a) from patients with metastatic melanoma responsive (R) or non-responsive (NR) to immune checkpoint blockade (ref. Sade-Feldman et al. 2018), and t-SNE plots of RNA-sequenced single cells with colouring of CD3E (T cells), CD14 (myeloid cells), and CD19 (B cells) TBK1 and IKBKE expression (b). c-d, broad cluster proportions (c) and percent cells per cluster across indicated treatment groups (d). e-f, UMAP (c) and density (d) plots of reclustered lymphoid (T/NK) cells. g, cluster proportions of lymphoid (T/NK) cells. Means (bars) and individual values (circles) are shown +/− s.e.m (error bars). Multiple unpaired t-test, *P < 0.05; **P < 0.01; ***P < 0.001; **** P < 0.0001; ns, not significant. h, percentage of activated (CD69+CD25+) murine CD8+ splenocytes pre-treated with TBK1i (1 μM) or DMSO (0.1%) with/without restimulation; n=3 biologically independent samples, 2-way ANOVA, Sidak’s multiple comparisons test; *P < 0.05; ***P < 0.001. i-k, intracellular cytokine staining for TNFα (i), IL-2 (j), and IFNγ (k) of murine CD3+CD8+ splenocytes pre-treated with TBK1i (1 μM) or DMSO (0.1%) with/without restimulation with data shown as % CD69+CD25+ cells and MFI); n=3 biologically independent samples, 2-way ANOVA, Sidak’s multiple comparisons test; **P < 0.01; **** P < 0.0001; ns, not significant.
Extended Data Figure 4|
Extended Data Figure 4|. Effect of Tbk1 deletion on the tumour immune microenvironment.
a, Flow cytometry of immune populations from control and Tbk1-null B16 tumours treated with anti-PD-1 (n=4 per group). Means (bars) and individual values (open circles) are shown (n = 4 biologically independent samples, 2-sided unpaired t-test). b-c, UMAP (b) and density (c) plots of 31,810 RNA-sequenced single cells from control and Tbk1-null B16 tumours following anti-PD-1 treatment (DC, dendritic cells; Tregs, regulatory T cells; MDSC, myeloid-derived suppressor cell; NK, natural killer cells; M1, M1 macrophages; M2, M2 macrophages). d, percent of cells in each lineage-defined cluster. Means (bars) and individual values (open circles) are shown (n = 4 biologically independent samples, 2-way ANOVA, Sidak’s multiple comparisons test; P values shown for M1 macrophages and CD8 T cells that did not reach statistical significance). e, UMAP plot of RNA-sequenced single cells with colouring of Tbk1 and Ikbke expression with cell types referenced (b). f, bubble plot indicating Tbk1 and Ikbke expression across UMAP-defined cell clusters.
Extended Data Figure 5|
Extended Data Figure 5|. TNFα and IFNγ expression in B16 melanoma tumours.
a, UMAP plot of RNA-sequenced single cells with colouring of Ifng and Tnfa expression with cell types referenced (right). b, log-fold change of Ifng (light red) and Tnfa (light blue) expression across lineage-defined cell clusters (Tbk1-null/control).
Extended Data Figure 6|
Extended Data Figure 6|. Supporting data that loss/inhibition of TBK1 sensitizes tumour cells to TNFα/IFNγ.
a, volcano plot depicting relative sgRNAs gene depletion/enrichment. Top 5 depleted sgRNAs indicated. b, scatter plot of gene essentiality from in vitro CRISPR screen (control and Tbk1-null B16 cells). c, TBK1 expression and cell viability (control vs. TNFα/IFNγ;) for single cell clones derived from polyclonal control and Tbk1-null B16 cells. Western blot is representative of three independent experiments. Means (bars) and individual values (open circles) are shown (n=6 across two independent experiments, 2-way ANOVA, Sidak’s multiple comparisons test; **** P < 0.0001; ns, not significant). d, TBK1 indel spectrum from control sgRNA and Tbk1 sgRNA B16 single cell clones. e, Viability assessment (Cell Titer Glo) of B16-ova cells in standard 2D culture after 24 hours treatment with TNFα (160 ng/mL) + IFNγ (40 ng/mL) compared to unstimulated cells (n=6, 2 independent experiments, 1-way ANOVA, Holm-Sidak’s multiple comparisons test). f, Viability assessment (Hoechst/propidium iodide) of B16 tumour spheroids (lacking immune cells) in 3D microfluidic culture after 96 hours treatment with TNFα (10 ng/mL) + IFNγ (10 ng/mL) compared to unstimulated cells (n=6, 2 independent experiments, 1-way ANOVA, Holm-Sidak’s multiple comparisons test). g, Cell viability assessment of B16 cells after 24 hours treatment with TNFα (200 ng/mL) + IFNγ (40 ng/mL) compared to unstimulated cells treated with increasing concentrations of MRT67307 (n=9, 3 independent experiments 2-way ANOVA, Sidak’s multiple comparisons test). h, Cell viability assessment of B16 cells in standard 2D culture after 24 hours treatment with TNFα (200 ng/mL) + IFNγ (40 ng/mL) compared to unstimulated cells treated with increasing concentrations of GSK8612 (n=3, 1 independent experiment, 2-way ANOVA, Sidak’s multiple comparisons test). i, Cell viability assessment of B16 cells in standard 2D culture after 24 hours treatment with TNFα (200 ng/mL) + IFNγ (40 ng/mL) with increasing concentrations of TBK1 PROTAC 3i (n=6, 2 independent experiments 2-way ANOVA, Sidak’s multiple comparisons test). **** P < 0.0001; ns, not significant.
Extended Data Figure 7|
Extended Data Figure 7|. Supporting data that TBK1 inhibition lowers the cytotoxicity threshold to TNFα/IFNγ.
a, GR values for 9-point inhibitor titration of TBK1i in parental, control sgRNA (polyclonal and monoclonal), and Tbk1 sgRNA (polyclonal and monoclonal) B16 cells (2 independent experiments; representative data from single experiment with 6 technical replicates per condition). Means (solid circles) are shown +/− s.e.m (error bars). b-c, evaluation of TBK1i potency (b; half-maximal effect, GEC50) and overall efficacy (c; area over the GR curve, GRAOC) d-e, Heatmap of GR values for parental (d) and BRAF/MEK inhibitor resistant (e) A375 human melanoma cells treated with increasing concentrations of TNFα and IFNγ for 24, 24, and 72 hours with 0, 0.25, and 1.0 μM TBK1i (n=3).
Extended Date Figure 8|
Extended Date Figure 8|. Supporting data that Tbk1-null cells undergo RIPK- and caspase-dependent cell death.
a-b, Cell viability assessment (Cell Titer Glo) in control and Tbk1-null B16 cells pre-treated with RIPK1 inhibitor (Nec-1s, 10 μM) and the pan-caspase inhibitor Q-VD-OPh (10 μM) +/− TNFα/IFNγ (n=3, 1 independent experiment: 2-way ANOVA, Dunnett’s multiple comparisons test). b, cell viability assessment (Cell Titer Glo) in control and Tbk1-null B16 cells pre-treated with RIPK1 inhibitor (Nec-1s, 10 μM) and the pan-caspase inhibitor z-VAD-fmk (20 μM) +/− TNFα/IFNγ (n=3-6, 1-2 independent experiments: 2-way ANOVA, Dunnett’s multiple comparisons test). c, cell viability assessment in Tbk1-null B16 cells pre-treated with RIPK1 inhibitor (Nec-1s, 10 μM) and the caspase 8 inhibitor z-IETD-fmk (2.5 μM) +/− TNFα/IFNγ (n=6, 2 independent experiments; 2-way ANOVA, Dunnett’s multiple comparisons test). d, cell viability assessment in Tbk1-null B16 cells pre-treated with RIPK3 inhibitor (HS-1371, 2 μM) and the pan-caspase inhibitor Q-VD-OPh (20 μM) +/− TNFα/IFNγ (n=6, 2 independent experiments: 2-way ANOVA, Dunnett’s multiple comparisons test). e, cell viability assessment in Tbk1-null B16 cells pre-treated with MLKL inhibitor (GW806742X, 5 μM) and the pan-caspase inhibitor Q-VD-OPh (20 μM) +/− TNFα/IFNγ (n=6, 2 independent experiments: 2-way ANOVA, Dunnett’s multiple comparisons test). f-h, Clonogenic assay of B16 cells treated with TNFα (10 ng/mL), IFNγ (10 ng/mL), or TNFα + IFNγ with control (0.1% DMSO), Q-VD-OPh (20 μM) with/without the RIPK1 inhibitor Nec-1s (10 μM, f), RIPK3 inhibitor HS-1371 (2 μM, g), and MLKL inhibitor GW806742X (2 μM, h) (representative images shown; n=3). i, normalized expression of selected genes in B16 cells treated with TNFα (10 ng/mL), IFNγ (100 ng/mL), or both, compared to control cells (source data for bulk RNA-seq – Manguso et al. 2017). j, normalized expression of Mlkl and Ripk3 in control and Tbk1-null B16 cells with/without TNFα/IFNγ treatment (18 hours) determined by qRT-PCR (n=3; 2-way ANOVA, Sidak’s multiple comparison test). *P < 0.05; **P < 0.01; ***P < 0.001; **** P < 0.0001; ns, not significant. k, Western blot of indicated proteins in Tbk1-null B16 cell lysates following 2-hour pre-treatment with vehicle control (0.1%DMSO), Q-VD-OPh (20μM), Nec-1s (10 μM), or Q-VD-OPh plus Nec-1s, or Q-VD-OPh plus birinapant (1 μM) followed by 10 hour treatment with TNFα (160 ng/mL) and IFNγ (40 ng/mL) or unstimulated (PBS) control. Data are representative of three independent experiments.
Extended Date Figure 9|
Extended Date Figure 9|. Supporting data regarding TNFα/IFNγ-induced cell death signaling in control and Tbk1-null cells.
a, heatmap of % cytochrome C (cyt C) release for in vitro BH3 profiling of unstimulated control (sg1 and sg2) and Tbk1-null (sg1 and sg2) B16 cells. Mean values shown; n=3 biologically independent samples; 2-way ANOVA, Dunnett’s multiple comparisons test. b, heatmap of % cytochrome C (cyt C) release for in vitro BH3 profiling of control sgRNA and Tbk1 sgRNA B16 cells. Mean values shown; n=3 biologically independent samples; 2-way ANOVA, Tukey’s multiple comparisons test. No statistically significant differences observed between control sgRNA and Tbk1 sgRNA B16 cells at any time point. c, Viability assessment (Cell Titer Glo) of B16 cells in standard 2D culture after 24 hours treatment with indicated concentrations of staurosporine (STS) in control and Tbk1-null B16 cells. Means (bars) and individual values (open circles) are shown (n=6, 2 independent experiments, 2-way ANOVA, Sidak’s multiple comparisons test). d, Viability assessment (Hoechst/propidium iodide) of B16 tumour spheroids (lacking immune cells) in 3D microfluidic culture after 48 hours treatment indicated concentrations of staurosporine (STS) compared to unstimulated cells Means (bars) and individual values (open circles) are shown (n=6, 2 independent experiments, 1-way ANOVA, Holm-Sidak’s multiple comparisons test). e, Western blot for STING, IRF3, TBK1, and β-actin in B16 cells with single CRISPR cell lines with single-guide RNAs targeting Tmem173, Irf3, and Tbk1 compared to control sgRNA. Data are representative of three independent experiments. f, Western blot for STING, IRF3, TBK1, and β-actin in double CRISPR B16 cells with indicated sgRNA pairs. Data are representative of three independent experiments. g, Viability assessment (Cell Titer Glo) of indicated sgRNA B16 cells after 48 hours treatment with TNFα (160 ng/mL) + IFNγ (40 ng/mL) compared to unstimulated cells. Means (bars) and individual values (open circles) are shown (n = 4 biological replicates, 2-way ANOVA, Sidak’s multiple comparisons test, **P < 0.01; **** P < 0.0001; ns, not significant). h, PDOTS viability assessment from patients (n=2) with cutaneous melanoma with indicated treatments. Means (bars) and individual values (open circles) are shown (n = 6 biological replicates, 2 independent specimens; one-way ANOVA with Dunn’s multiple comparisons test, **P < 0.01; **** P < 0.0001; ns, not significant). i, heatmap of secreted cytokine profiles (L2FC) of conditioned media from PDOTS in response to indicated treatments (n=2). Mean values shown. **P < 0.01; **** P < 0.0001; ns, not significant.
Extended Date Figure 10|
Extended Date Figure 10|. Supporting data that IFNγ sensing is essential for effector cytokine-induced death in TBK1-null cells.
a, Frequency histograms of enrichment (z-score) for all sgRNAs per target in a Tbk1-null B16 cells +/− in vitro stimulation with TNFα (10ng/mL) and IFNγ (10ng/mL). b, scatter plot depicting relative depletion of sgRNAs targeting 19,674 genes in a Cas9+ B16 control and Tbk1 sgRNA cell line +/− in vitro stimulation with TNFα (10ng/mL) and IFNγ (10ng/mL). c, Western blot of control sgRNA and Tbk1-null B16 cells treated with TNFα (160 ng/mL) and IFNγ (40 ng/mL) for the indicates times. Data are representative of three independent experiments. d, cell viability assessment in parental B16 cells pre-treated with TBK1i (1μM) +/− JAK 1/2 inhibitor (ruxolitinib, 0.5 μM) +/− TNFα/IFNγ for 48 hours compared to unstimulated controls. Means (bars) and individual values (open circles) are shown (n=3, 1 independent experiment; 2-way ANOVA, Dunnett’s multiple comparisons test; *P < 0.05; ***P < 0.001; **** P < 0.0001; ns, not significant). e, Western blot of indicated proteins in Tbk1-null B16 cell lysates following 2-hour pre-treatment with vehicle control (0.1%DMSO), ruxolitinib (1 μM), Q-VD-OPh (20μM), Nec-1s (10 μM), or Q-VD-OPh plus Nec-1s followed by 10-hour treatment with TNFα (160 ng/mL) and IFNγ (40 ng/mL) or unstimulated (PBS) control. Data are representative of three independent experiments. f, GR values for 9-point inhibitor titration of ruxolitinib (JAK1/2i) in parental, control sgRNA (monoclonal), and Tbk1 sgRNA (monoclonal) B16 cells (2 independent experiments; representative data from single experiment with 6 technical replicates per condition). Means (solid circles) are shown +/− s.e.m (error bars).
Figure 1|
Figure 1|. TBK1 loss sensitizes tumours to PD-1 blockade.
a, Relative depletion of Tbk1 sgRNAs from a pool of sgRNAs targeting 2,368 genes expressed by Cas9-expressing B16 melanoma cells (n = 4 independent guides targeting each gene; false discovery rate (FDR) was calculated using the STARS algorithm v1.3, as previously described ,). b, Viability of Tbk1-null and control B16 tumour cells following 3 days of in vitro culture. Means (bars) and individual values (open circles) are shown (n = 9, across 3 independent experiments. One-way ANOVA with Tukey’s multiple comparisons test; ns, not significant. c, Tumour volume and survival analysis of control (grey), Tbk1-null (light red) B16 tumours in wild-type (WT) and WT αPD-1-treated C57BL/6 mice with overlapping survival curves for GVAX WT mice. Data in c represent two independent experiments with n = 5 animals per guide with two separate guides for the control group and two separate guides for each Tbk1-null group. Mean tumour volumes (solid circles) are shown +/− s.e.m. (shaded region). d, Tumour volume analysis of mice bearing B16-ova tumours treated with TBK1i (Compound 1, 40mg/kg daily by oral gavage), αPD-1 (200 mg i.p. tiw x 6 doses), or combination compared to control (IgG + vehicle); n=10 mice per treatment group. Mean tumour volumes (solid circles) are shown +/− s.e.m. (shaded region). 2-way ANOVA with Tukey’s multiple comparisons test ***P < 0.001; compared to control group. e-g, Viability assessment of (e) treatment-naïve B16-ova MDOTS (n=3 per treatment group), (f) treatment-naïve Braf/Pten (D4M.3A) MDOTS (n=9 per treatment group), (g) αPD-1 resistant B16-ova MDOTS (n=3 per treatment group); one-way ANOVA with Dunn’s multiple comparisons test. *P < 0.05; **P < 0.01; **** P < 0.0001; ns, not significant.
Figure 2|
Figure 2|. TBK1 inhibition enhances sensitivity to PD-1 blockade using PDOTS.
a, Scheme of PDOTS preparation. b, waterfall plots for PDOTS (n=30, indicated tumour types) treated with αPD-1 (250μg/mL pembrolizumab), TBK1i (1 μM), or combined αPD-1+TBK1i. Means (bars) for each specimen are shown. 1-way ANOVA (matched) with Dunnett’s multiple comparisons test compared to control. c-f, PDOTS viability assessment from patients with treatment-refractory melanoma (c-d) and treatment-naïve MSI-colon adenocarcinoma (e-f) with indicated treatments. Means (bars) and individual values (open circles) are shown (n = 3, biological replicates, one-way ANOVA with Dunn’s multiple comparisons test; *P < 0.05; **P < 0.01).
Figure 3|
Figure 3|. TBK1 inhibition remodels the tumour immune microenvironment.
a, Uniform Manifold Approximation and Projection (UMAP) of all immune cells (n=53,637) with 25 unique populations identified among CD45+-enriched immune cells from single cell RNA sequencing on tumour-infiltrating leukocytes from B16-ova tumours from Control (Vehicle/IgG, n=3), αPD-1 (Vehicle/anti-PD-1, n=4), TBK1i (TBK1i/IgG n=4), and αPD-1 + TBK1i (TBK1i/anti-PD-1, n=4) treated tumours. b, Downsampled cell density projections by condition. c, UMAP of 43,068 cells and 19 unique populations identified among sub-clustered myeloid cells. d, Downsampled myeloid sub-cluster cell density projections by condition. e, Bar plots of proportional changes by unique cluster of myeloid sub-cluster immune cells by treatment. Means (bars) and individual values (circles) +/− s.e.m (error bars) are shown (n = 4 biologically independent samples, except for control, n = 3; multiple unpaired t-test, **P < 0.01; ***P < 0.001; **** P <.0001). f, Top enriched or decreased Hallmark gene signatures in the myeloid sub-cluster determined by GSEA Prerank on differentially expressed genes calculated by a logistic regression by condition. g, Mountain plots showing enrichment scores for the TNFα Signaling Via NFκB Hallmark gene set and Inflammatory Response gene set in the myeloid sub-cluster by condition. h-i, downsampled UMAP of all immune cells showing (h) Tnf gene expression and (i) Il1a gene expression by condition. j, gene expression (qRT-PCR) of Tnf and Il1a in bone marrow-derived macrophages (BMDMs) pre-treated with TBK1i (1 μM) for 24 hours prior to 2-hour stimulation with LPS (20 ng/mL) plus IFNγ (20ng/mL) versus PBS control. Means (bars) and individual values (open circles) are shown (n=4 biological replicates; 2-way ANOVA with Sidak’s multiple comparisons test, **P < 0.01; ***P < 0.001; **** P <.0001).
Figure 4|
Figure 4|. Loss of TBK1 sensitizes tumour cells to TNFα/IFNγ.
a-b, Plasma protein levels (NPX, normalized protein expression) from patients with metastatic melanoma responsive (R) or non-responsive (NR) to ICB at baseline (n=179), 6 weeks after starting ICB (n=173) and 6 months after starting ICB (n=151). Mean values (solid circles) +/− s.e.m. are shown (2-way ANOVA with Dunnett’s multiple comparisons test: **P < 0.01; ***P < 0.001; **** P <.0001). c-d, Mean fraction of CD45+ cells (c) and cell frequency across lineage-defined clusters (d) for cells expressing IFNG and TNF in patients with metastatic melanoma. e, Frequency histograms of depletion (z-score) for all sgRNAs per target in a Cas9+ B16 control sgRNA cell line +/− in vitro stimulation with TNFα and IFNγ. f, Viability assessment of indicated B16 cell lines with indicated treatments (24 hours). Means (bars) and individual values (open circles) are shown (n=9, 3 independent experiments, 2-way ANOVA, Dunnett’s multiple comparisons test: * P <.05, **** P <.0001, ns, not significant). g, Heatmap of mean GR values (n=3) for cells treated with increasing concentrations of TNFα and IFNγ. h, Viability assessment of B16 cells with indicated treatments compared to unstimulated cells (24 hours). Means (bars) and individual values (open circles) are shown (n=12, 4 independent experiments, 2-way ANOVA, Dunnett’s multiple comparisons test: **** P <.0001, ns, not significant). i, Clonogenic assay of B16 cells (representative images shown; n=3). j, Heatmap of GR values for B16 cells treated with TBK1i (n=3) across TNFα/IFNγ concentrations. k-l, PDOTS viability assessment with indicated treatments. Means (bars) and individual values (open circles) are shown (n = 3, one-way ANOVA with Dunn’s multiple comparisons test). m-n, patient-derived organoids with indicated treatments. Means (bars) and individual values (open circles) are shown (n=6 biological replicates, 2 independent experiments: one-way ANOVA with Dunn’s multiple comparisons test).
Figure 5|
Figure 5|. IFNγ sensing is required for RIPK- and caspase-dependent death of Tbk1-null cells.
a, Western blot for indicated proteins in control sgRNA and Tbk1-null B16 cells treated with TNFα (160 ng/mL) and IFNγ (40 ng/mL) for the indicates times. b, Viability assessment of control and Tbk1-null B16 cells with indicated pre-treatments +/− TNFα/IFNγ. Means (bars) and individual values (open circles) are shown (n=9, 3 independent experiments; 2-way ANOVA, Dunnett’s multiple comparisons test; **** P < 0.0001; ns, not significant). c, Viability assessment of indicated B16 cells after 48 hours treatment with TNFα/IFNγ compared to unstimulated cells. Means (bars) and individual values (open circles) are shown (n=8, 2 independent experiments; 2-way ANOVA, Tukey’s multiple comparisons test; **** P < 0.0001; ns, not significant). d, Scatter plot depicting relative depletion and enrichment of sgRNAs targeting 19,674 genes in a Cas9+ B16 control and Tbk1 sgRNA cell line +/− in vitro stimulation with TNFα/IFNγ. e, cell viability assessment of indicated B16 cells pre-treated with ruxolitinib (0.5 μM) +/− TNFα/IFNγ. Means (bars) and individual values (open circles) are shown (n=6, 2 independent experiments; 2-way ANOVA, Dunnett’s multiple comparisons test: **P <.01, ***P < 0.001; **** P <.0001; ns, not significant). f, Western blot for indicated proteins in control sgRNA and Tbk1-null B16 cells pre-treated with vehicle or ruxolitinib (0.5 μM) followed by TNFα/IFNγ or PBS (control) for 8 hours. g, Heatmap of mean GR values (n=3) for Tbk1-null B16 cells treated with increasing concentrations of TNFα and IFNγ for 24 and 48 hours with 0, 0.1, and 0.5 μM ruxolitinib. h, Viability assessment of melanoma PDOTS with indicated treatments. Means (bars) and individual values (open circles) are shown (n=9, 3 independent specimens: one-way ANOVA with Dunn’s multiple comparisons test; *P <.05, ***P < 0.001; **** P <.0001). i, Scheme of TNFα/IFNγ-driven RIPK1- and caspase-dependent cell death in cells lacking TBK1.

References

    1. Jenkins RW, Barbie DA & Flaherty KT Mechanisms of resistance to immune checkpoint inhibitors. Br. J. Cancer 118, 9–16 (2018). - PMC - PubMed
    1. Sharma P, Hu-Lieskovan S, Wargo JA & Ribas A Primary, Adaptive, and Acquired Resistance to Cancer Immunotherapy. Cell 168, 707–723 (2017). - PMC - PubMed
    1. Zhou R, Zhang Q & Xu P TBK1, a central kinase in innate immune sensing of nucleic acids and beyond. Acta Biochim. Biophys. Sin (2020) doi:10.1093/abbs/gmaa051. - DOI - PubMed
    1. Manguso RT et al. In vivo CRISPR screening identifies Ptpn2 as a cancer immunotherapy target. Nature 547, 413–418 (2017). - PMC - PubMed
    1. Tang J, Shalabi A & Hubbard-Lucey VM Comprehensive analysis of the clinical immuno-oncology landscape. Annals of Oncology vol. 29 84–91 Preprint at 10.1093/annonc/mdx755 (2018). - DOI - PubMed

Publication types

MeSH terms