. 2023 Apr;164(4):593-609.e13.
doi: 10.1053/j.gastro.2023.01.002. Epub 2023 Jan 10.

F4/80+Ly6Chigh Macrophages Lead to Cell Plasticity and Cancer Initiation in Colitis

Affiliations

F4/80+Ly6Chigh Macrophages Lead to Cell Plasticity and Cancer Initiation in Colitis

Alice E Shin et al. Gastroenterology. 2023 Apr.

Abstract

Background & aims: Colorectal cancer is a leading cause of cancer death, and a major risk factor is chronic inflammation. Despite the link between colitis and cancer, the mechanism by which inflammation leads to colorectal cancer is not well understood.

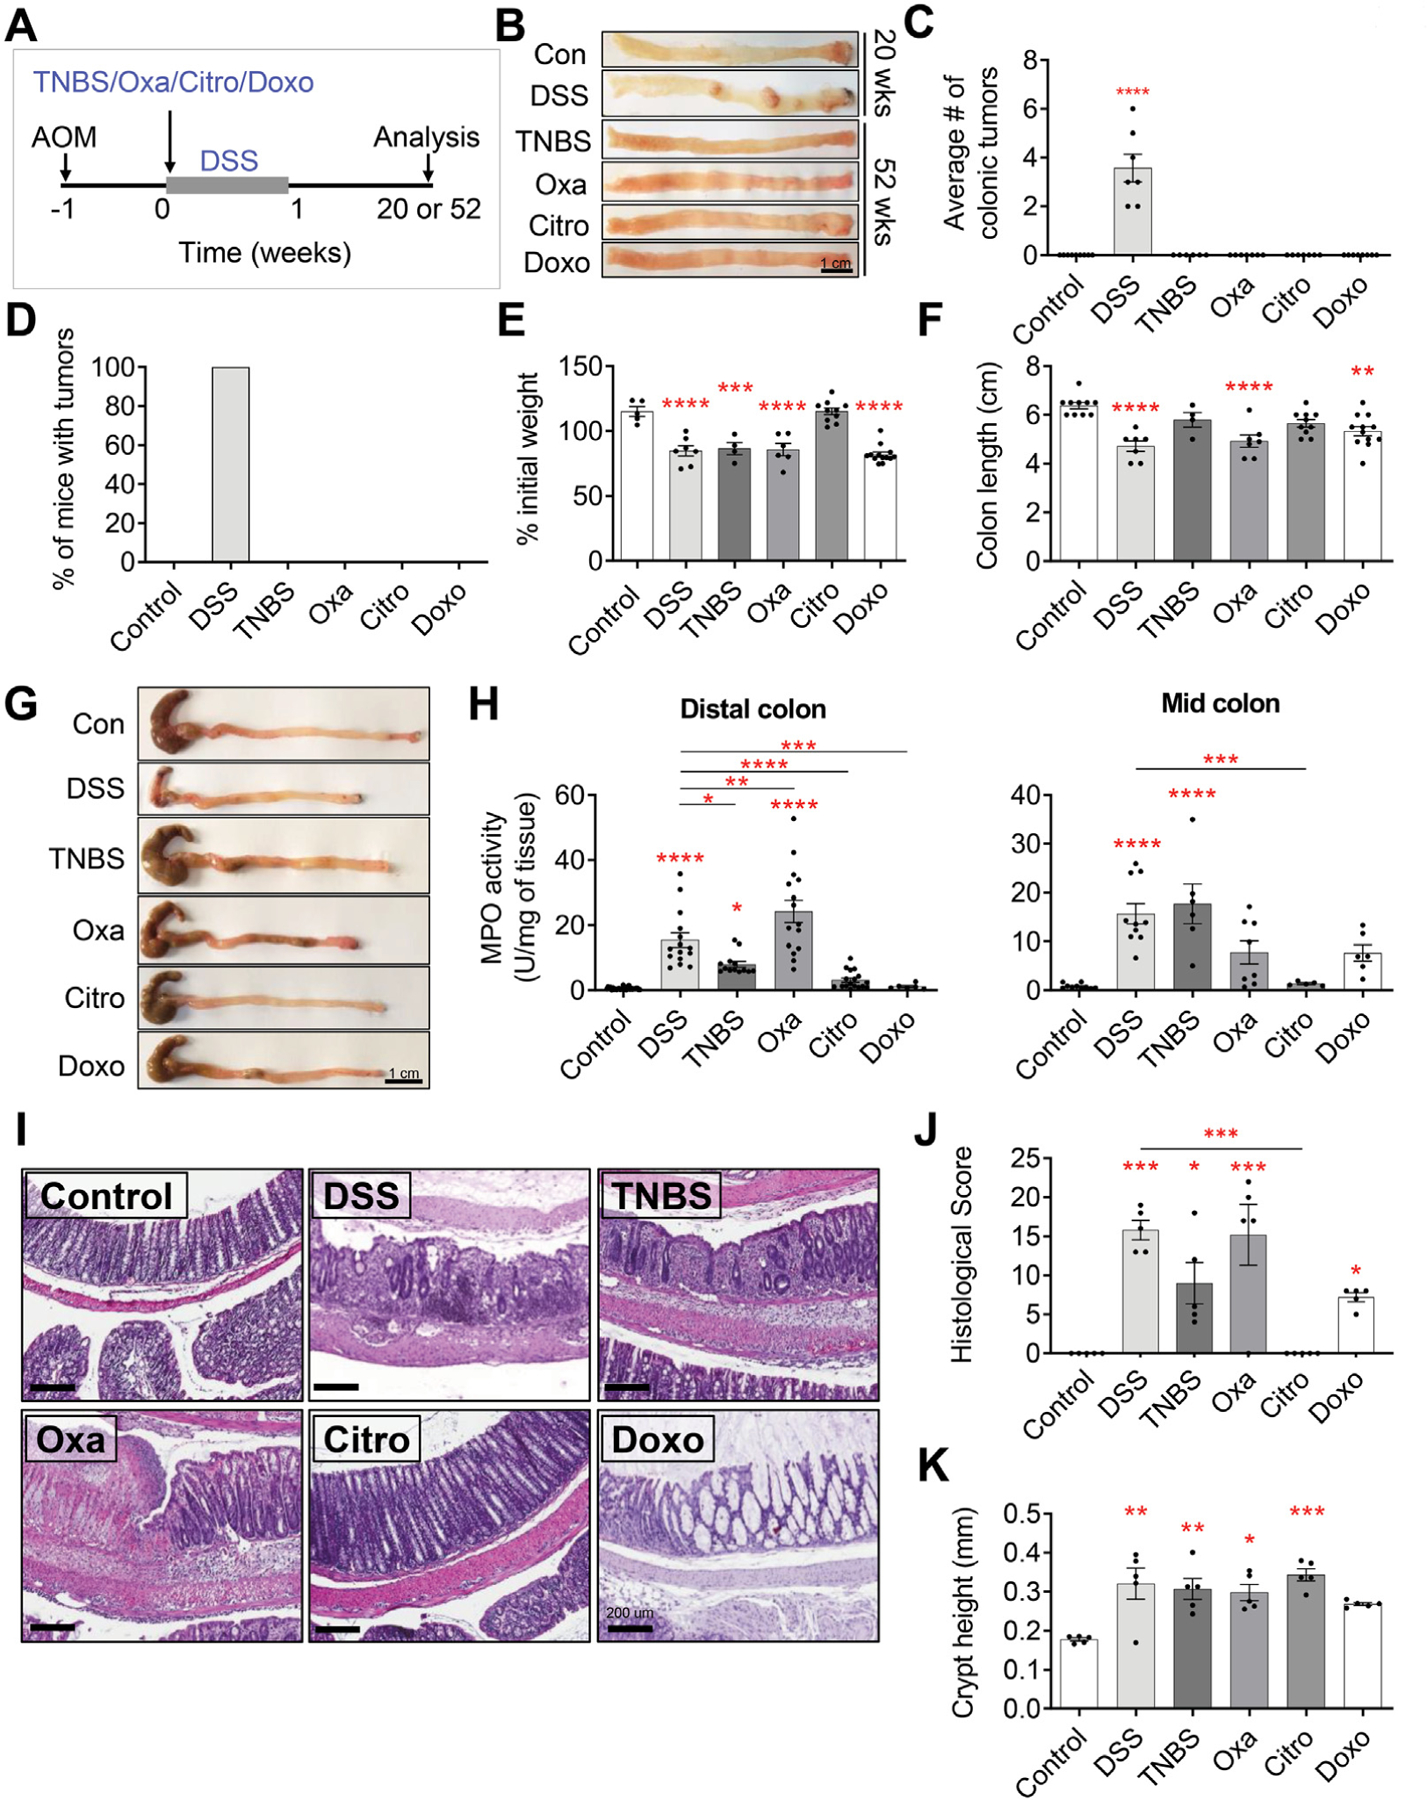
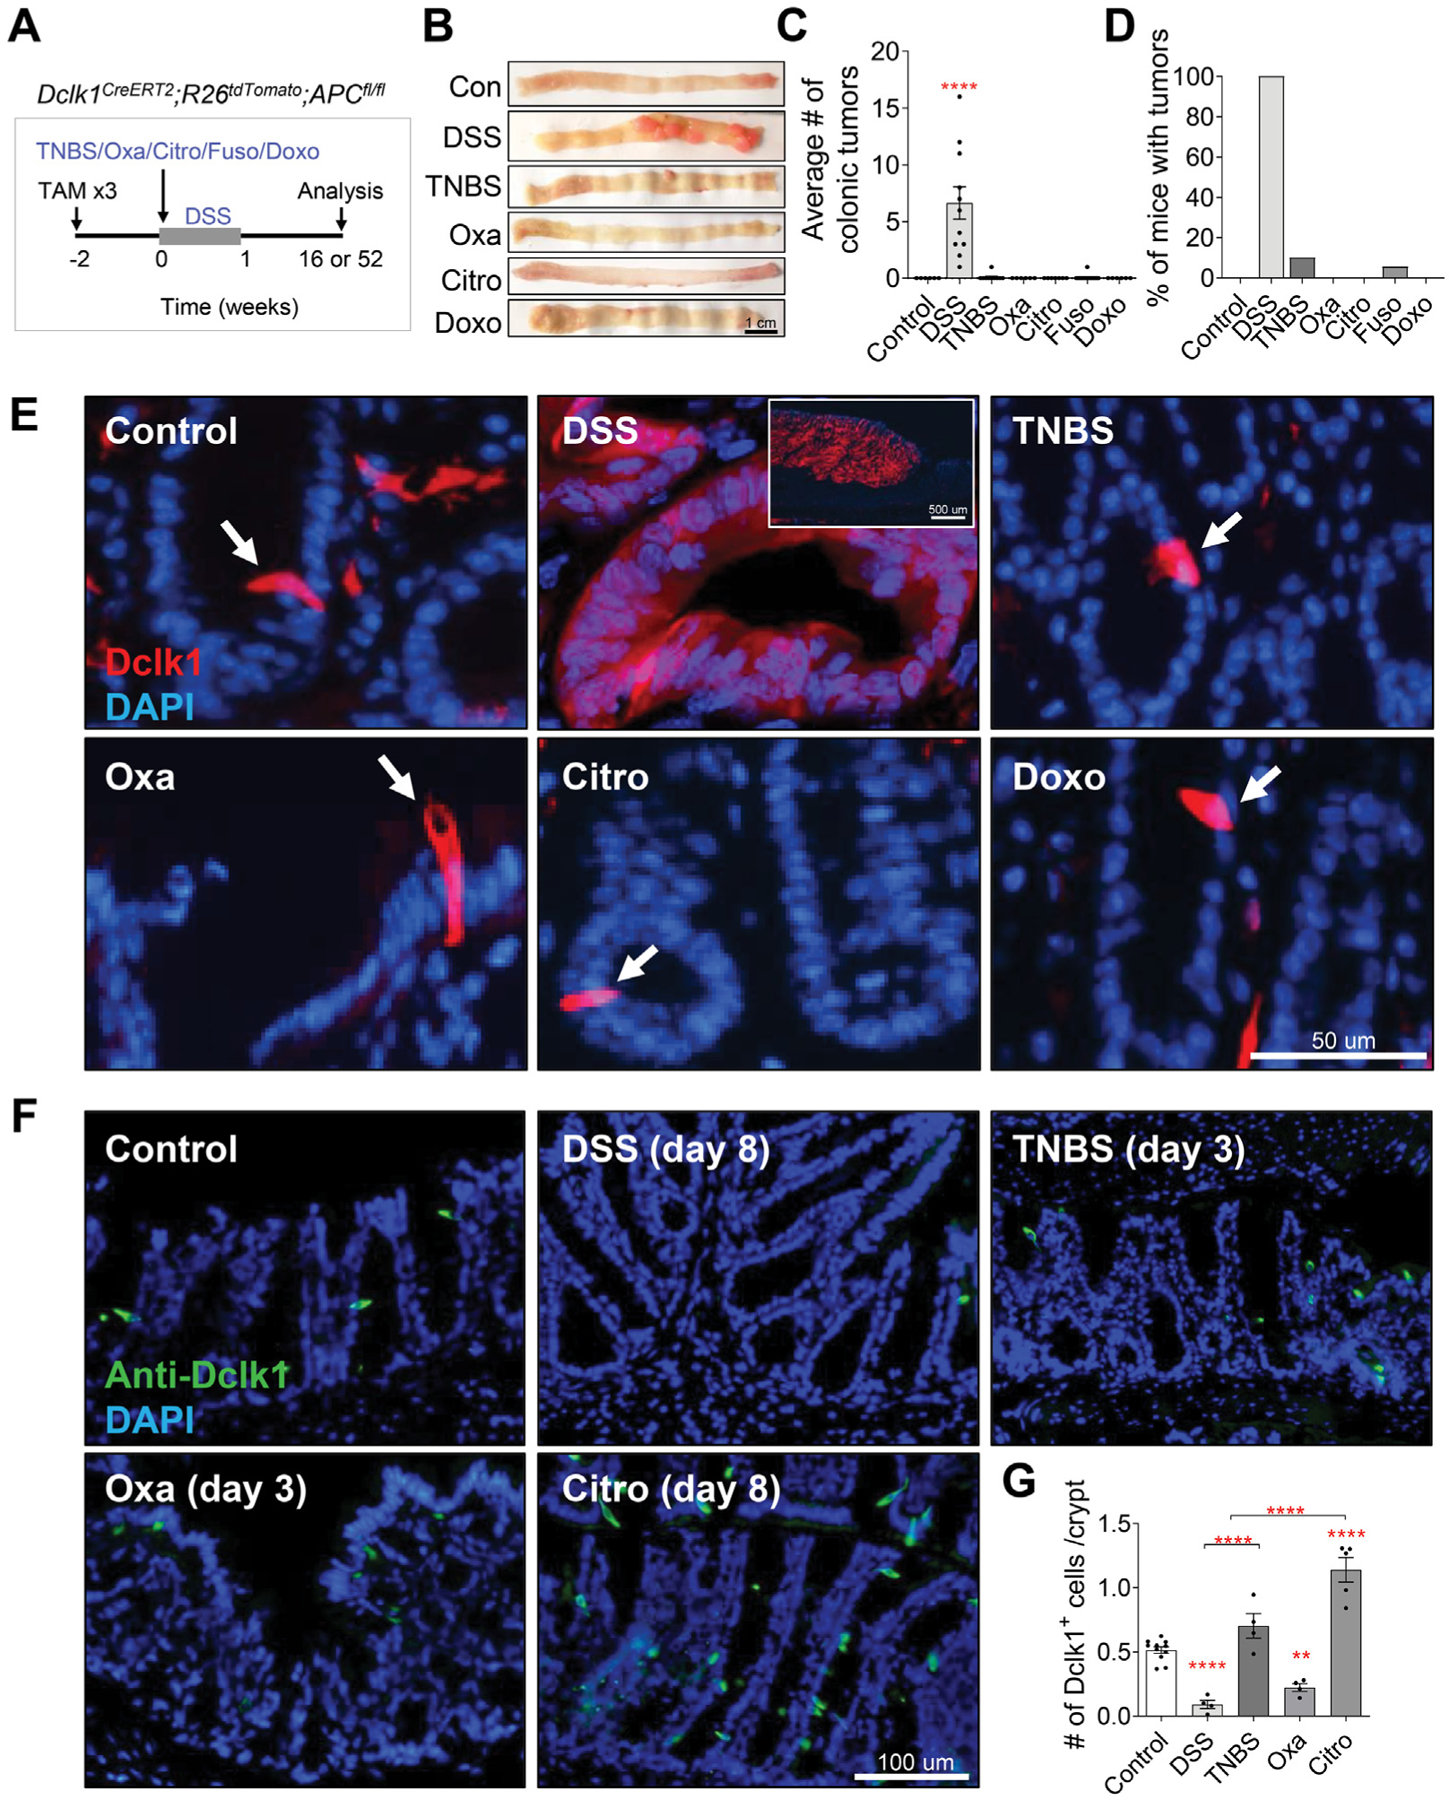
Methods: To investigate whether different forms of inflammation pose the same risk of cancer, we compared several murine models of colitis (dextran sodium sulfate [DSS], 2,4,6-trinitrobenzene sulfonic acid, 4-ethoxylmethylene-2-phenyloxazol-5-one, Citrobacter rodentium, Fusobacterium nucleatum, and doxorubicin) with respect to their ability to lead to colonic tumorigenesis. We attempted to correlate the severity of colitis and inflammatory profile with the risk of tumorigenesis in both azoxymethane-dependent and Dclk1/APCfl/fl murine models of colitis-associated cancer.

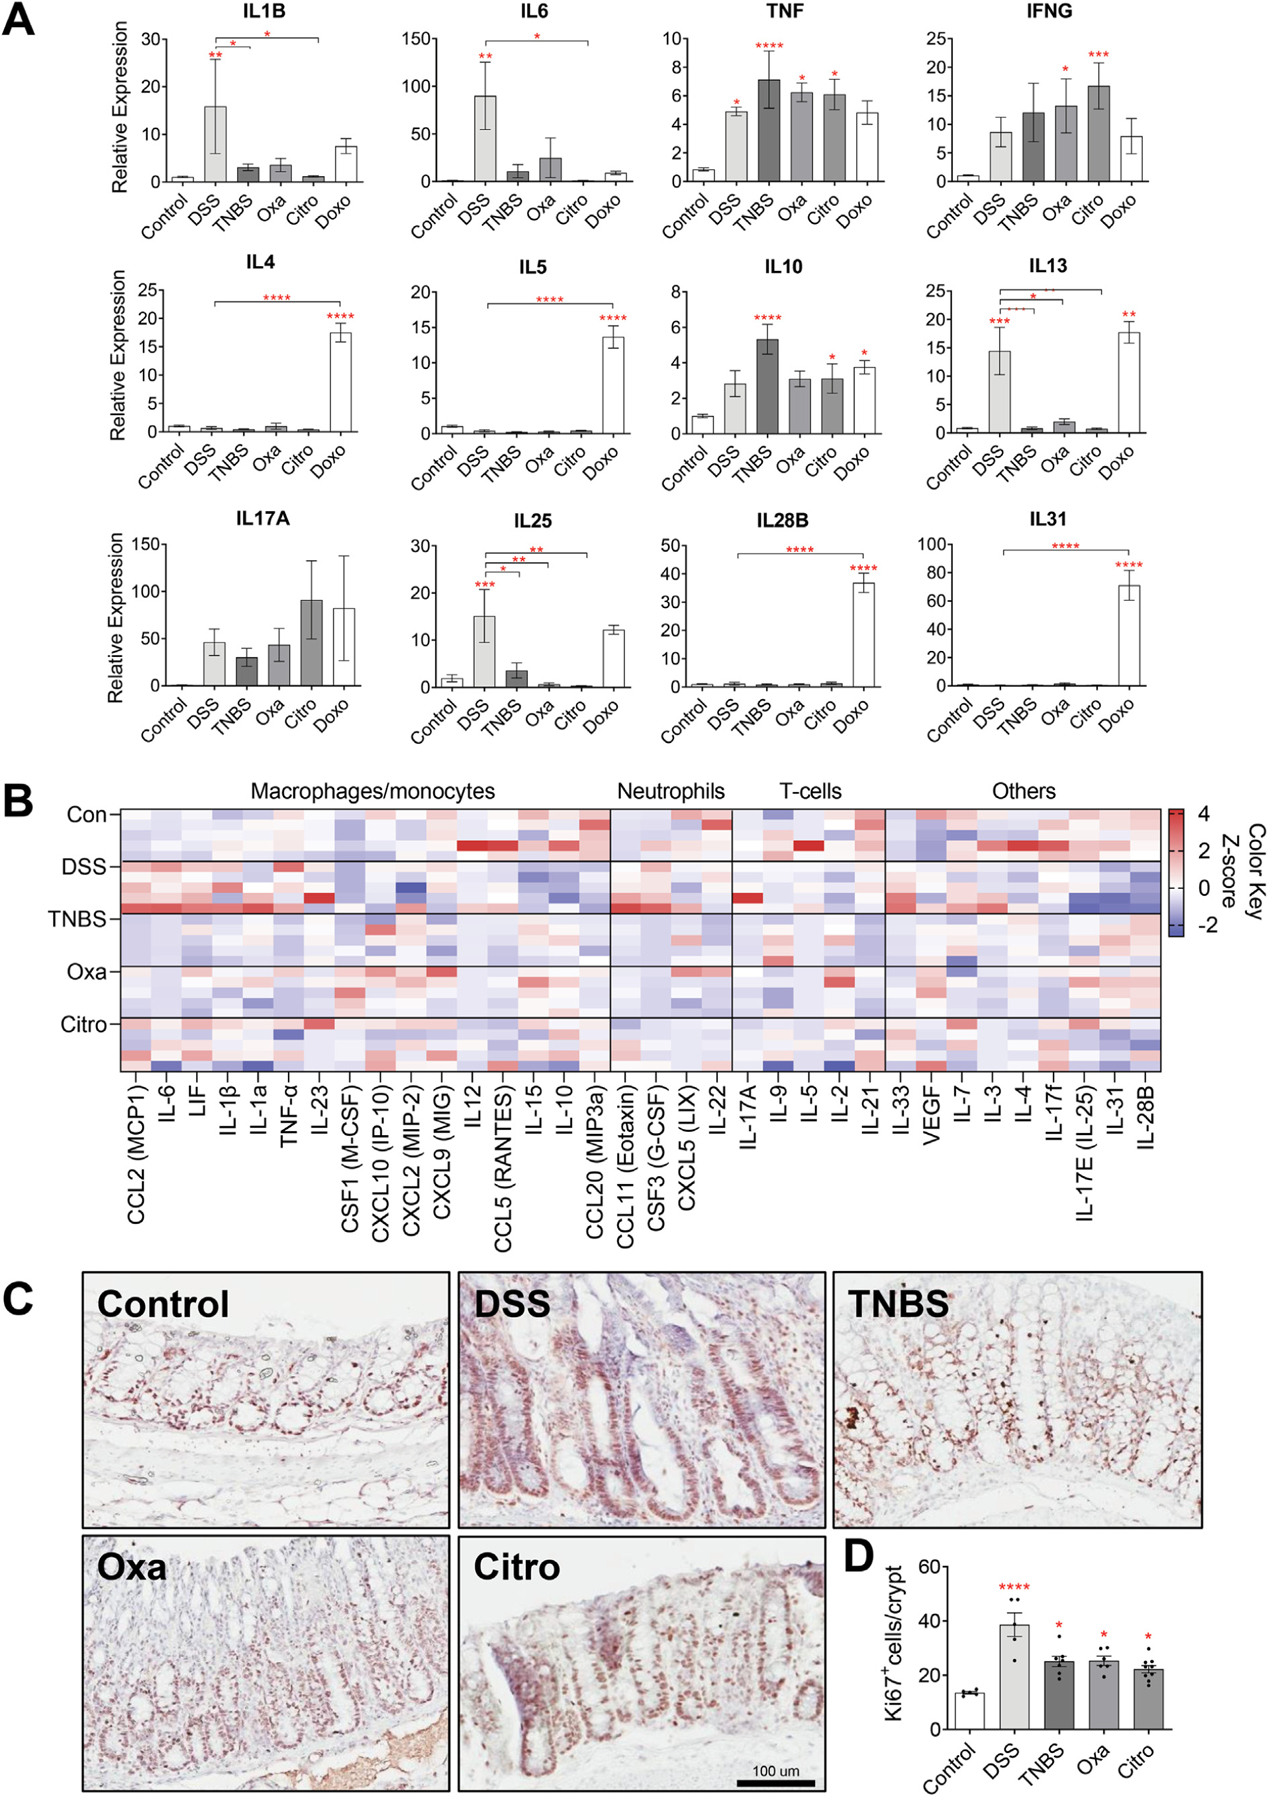
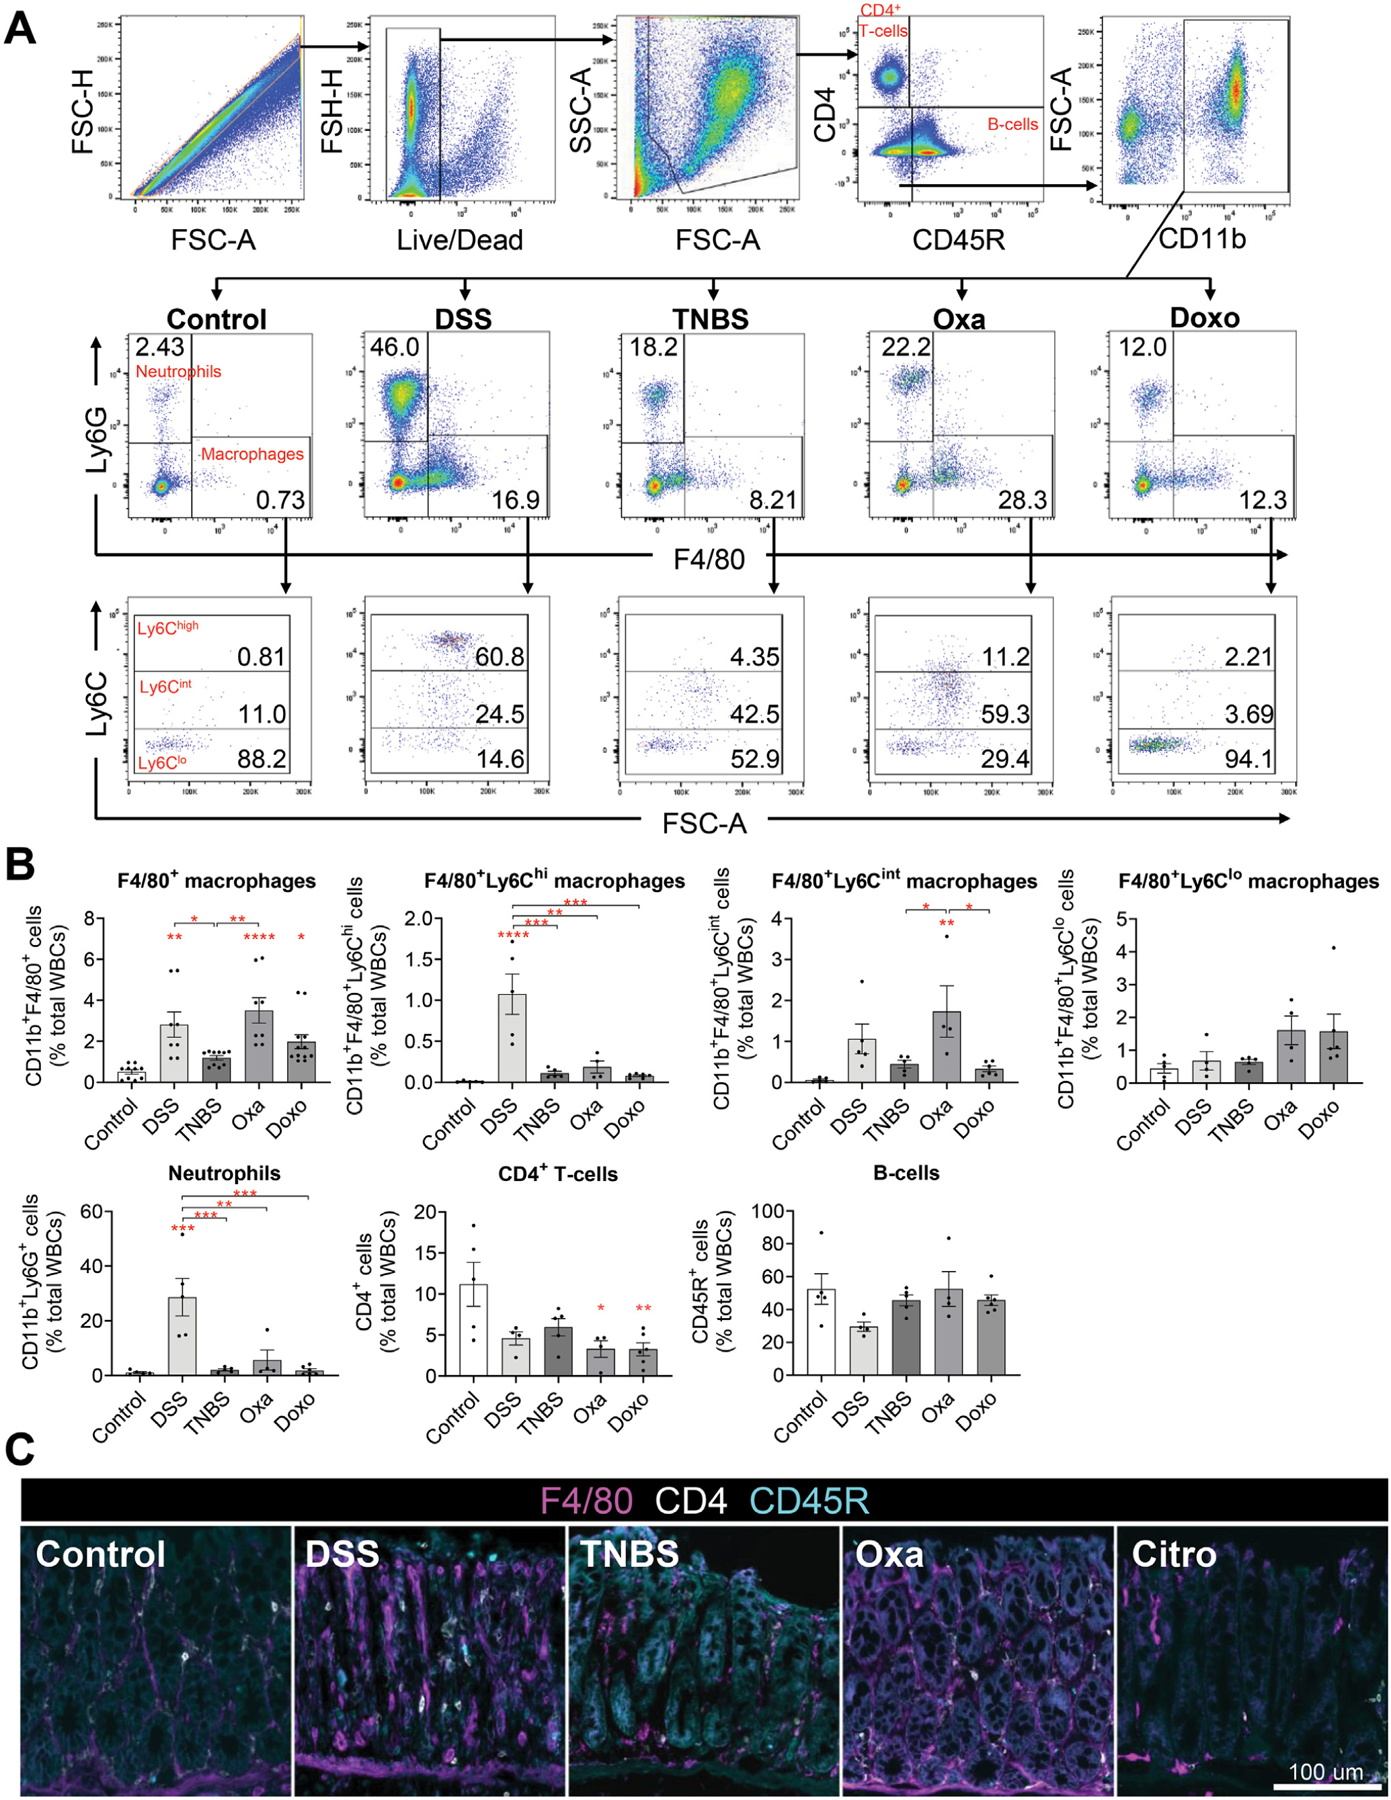
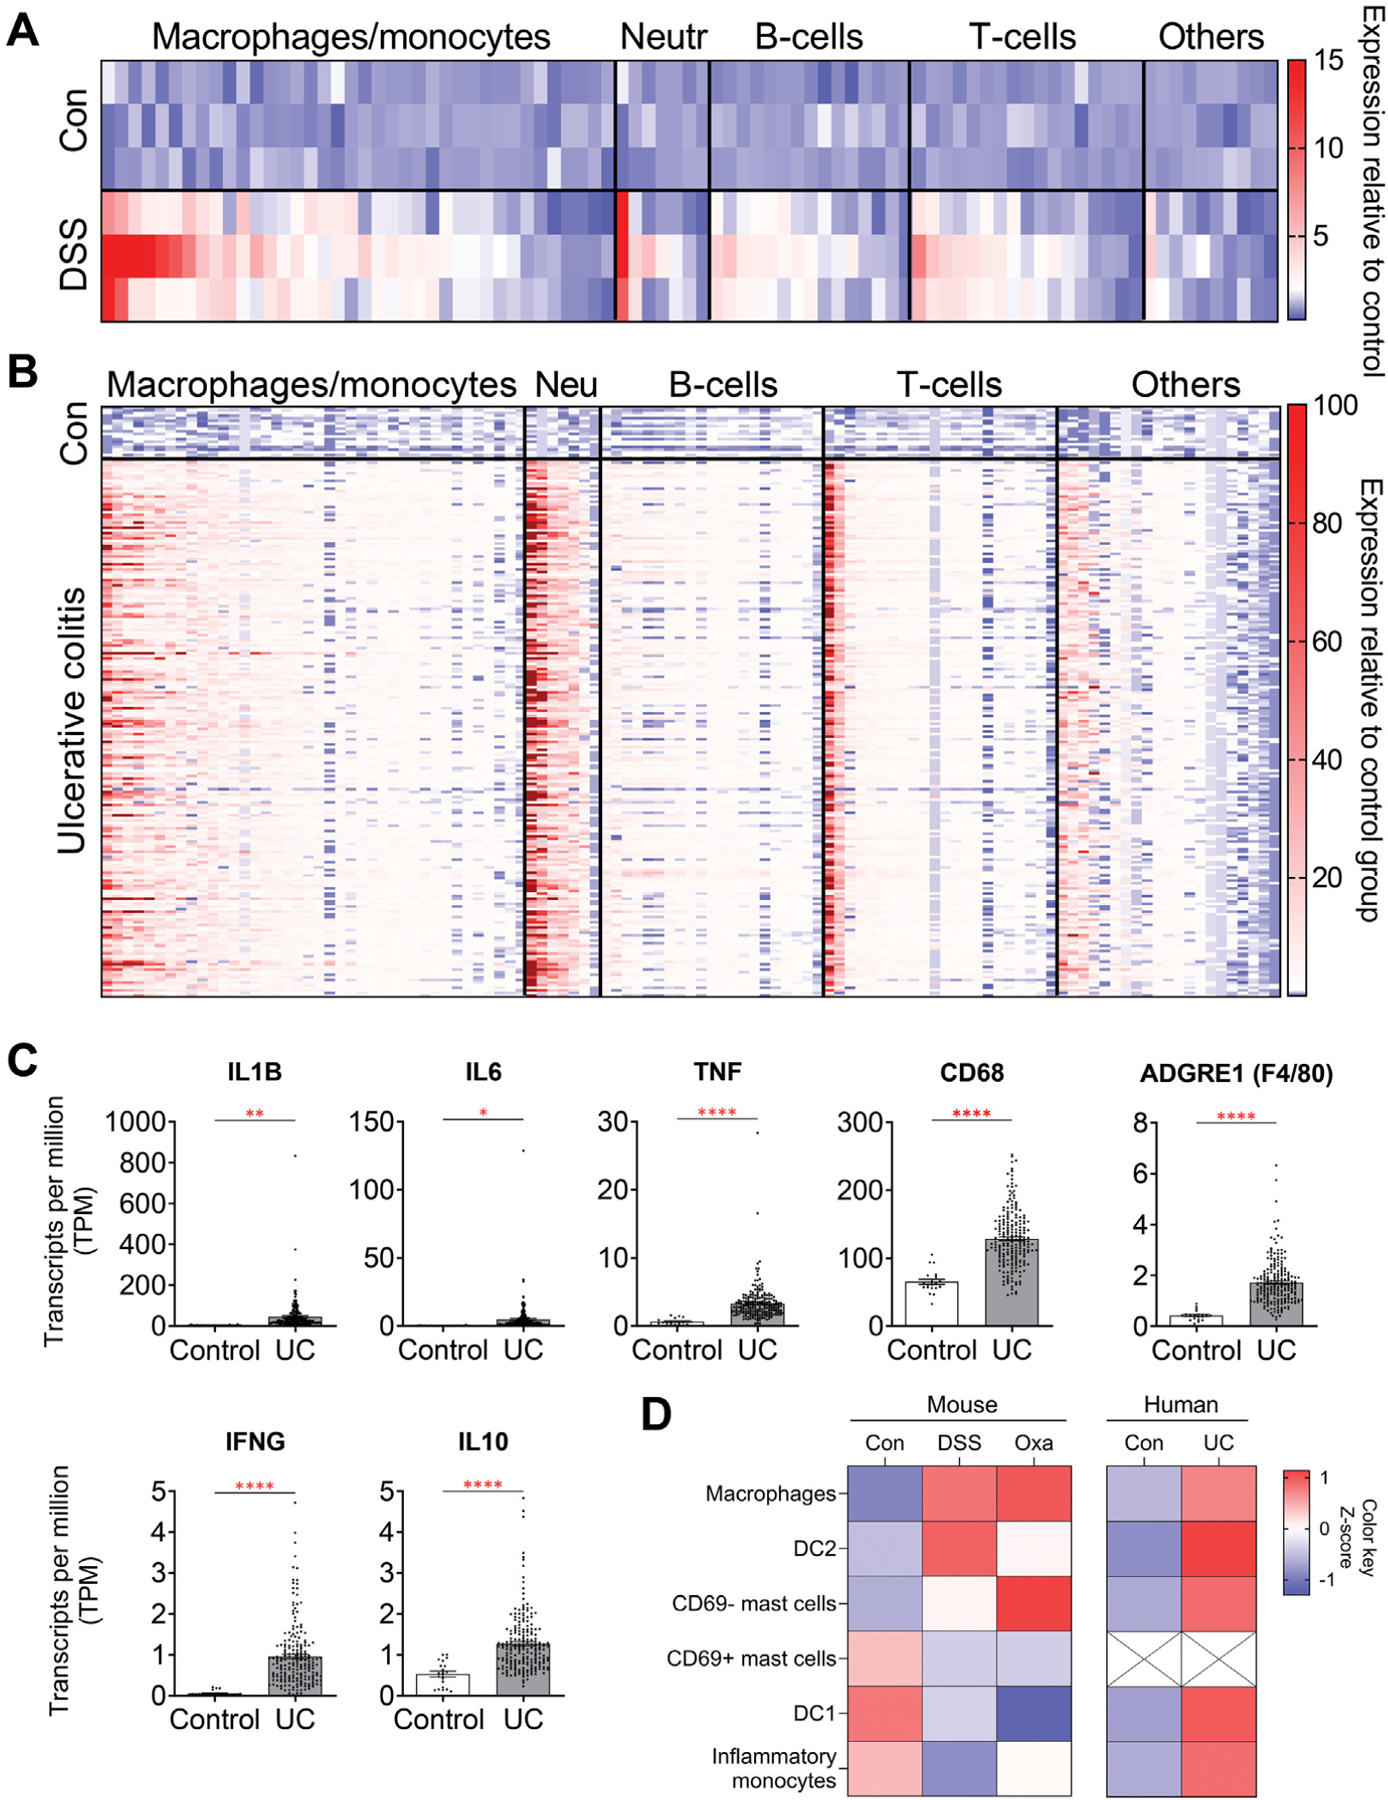
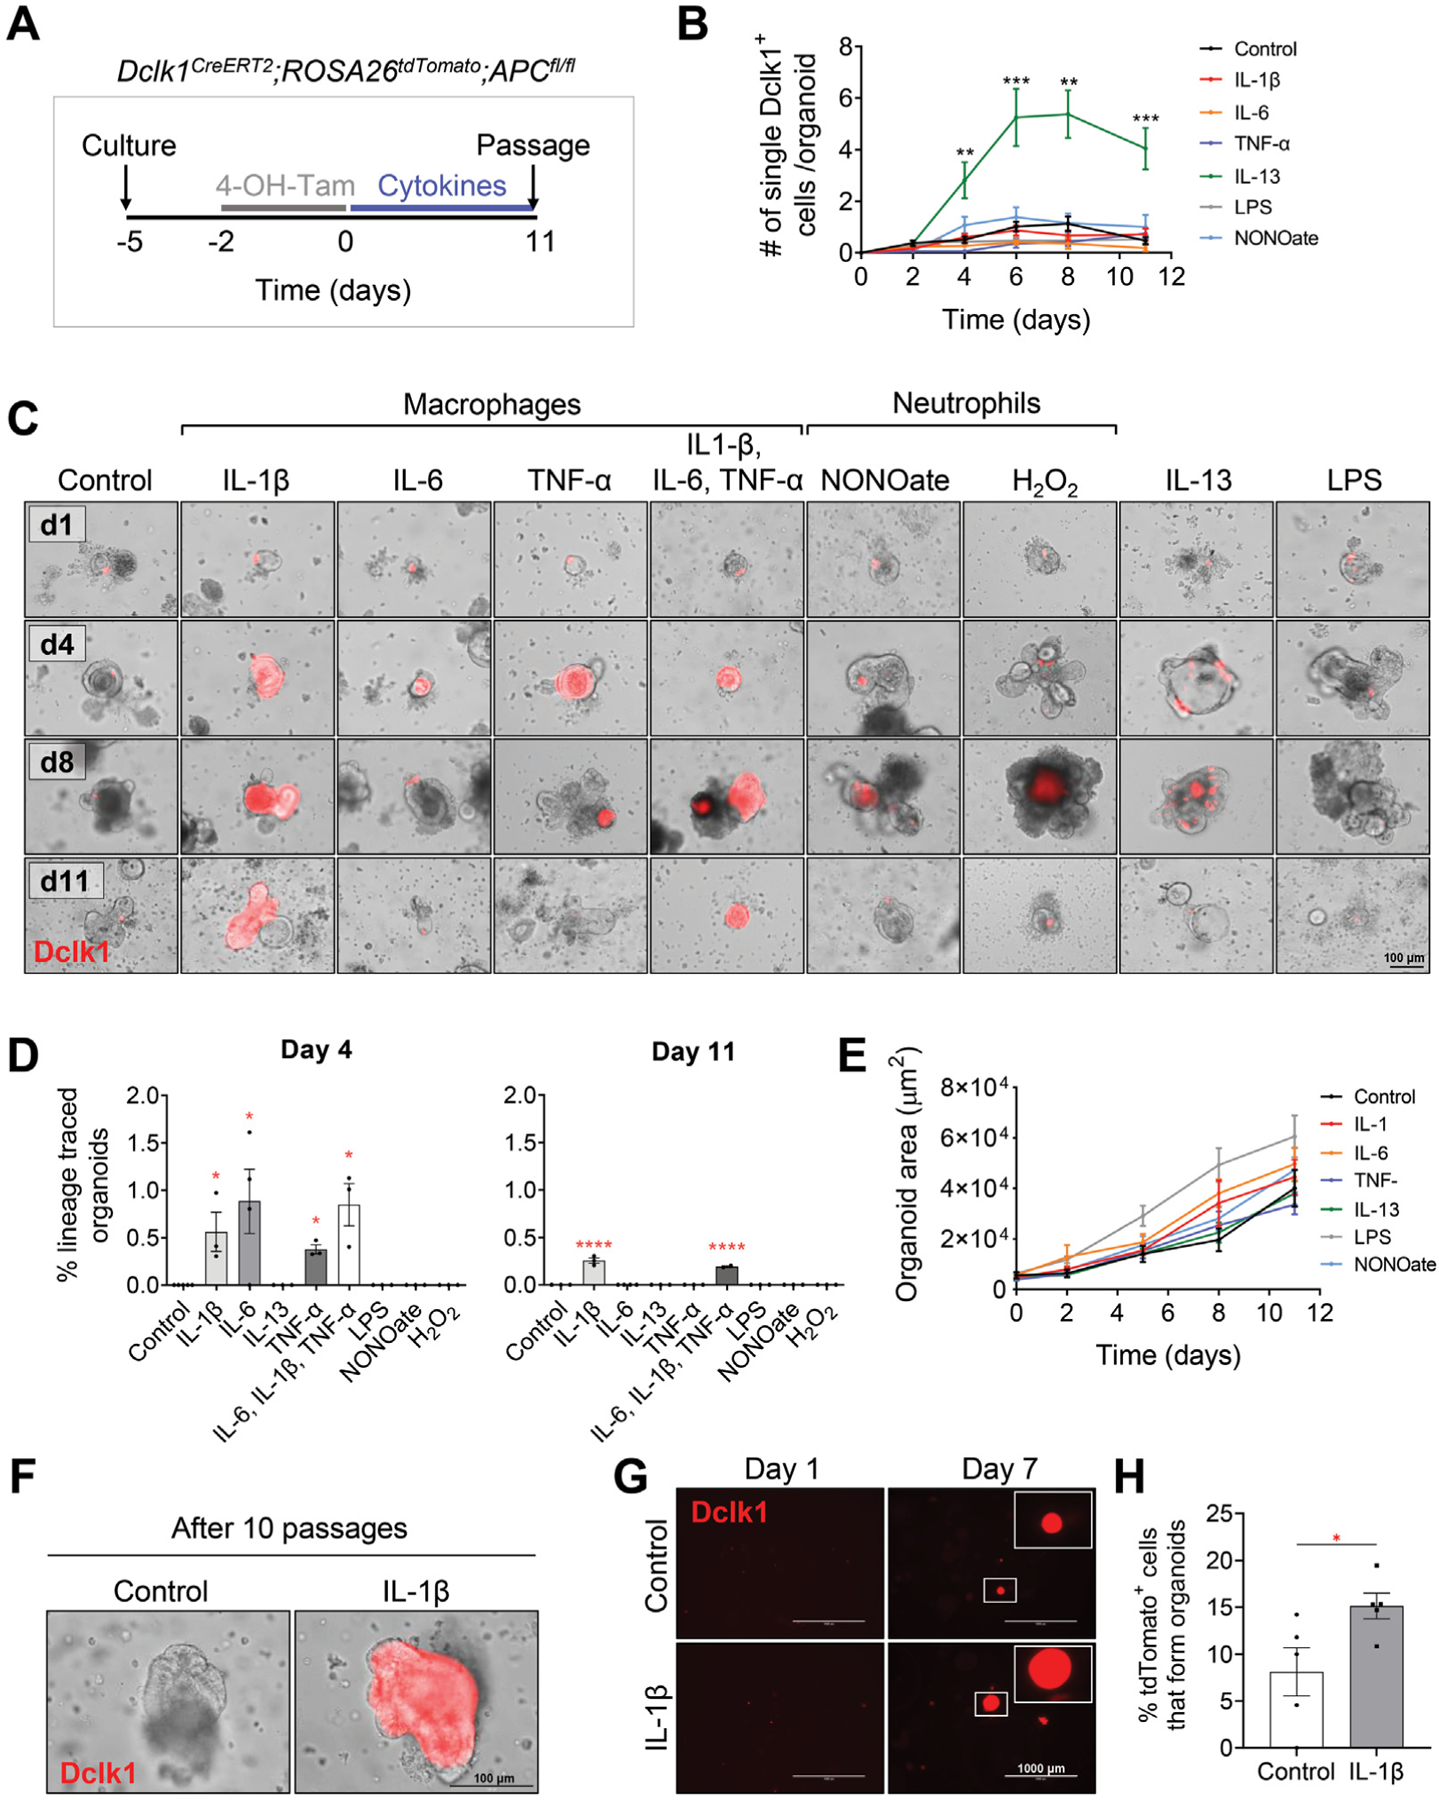
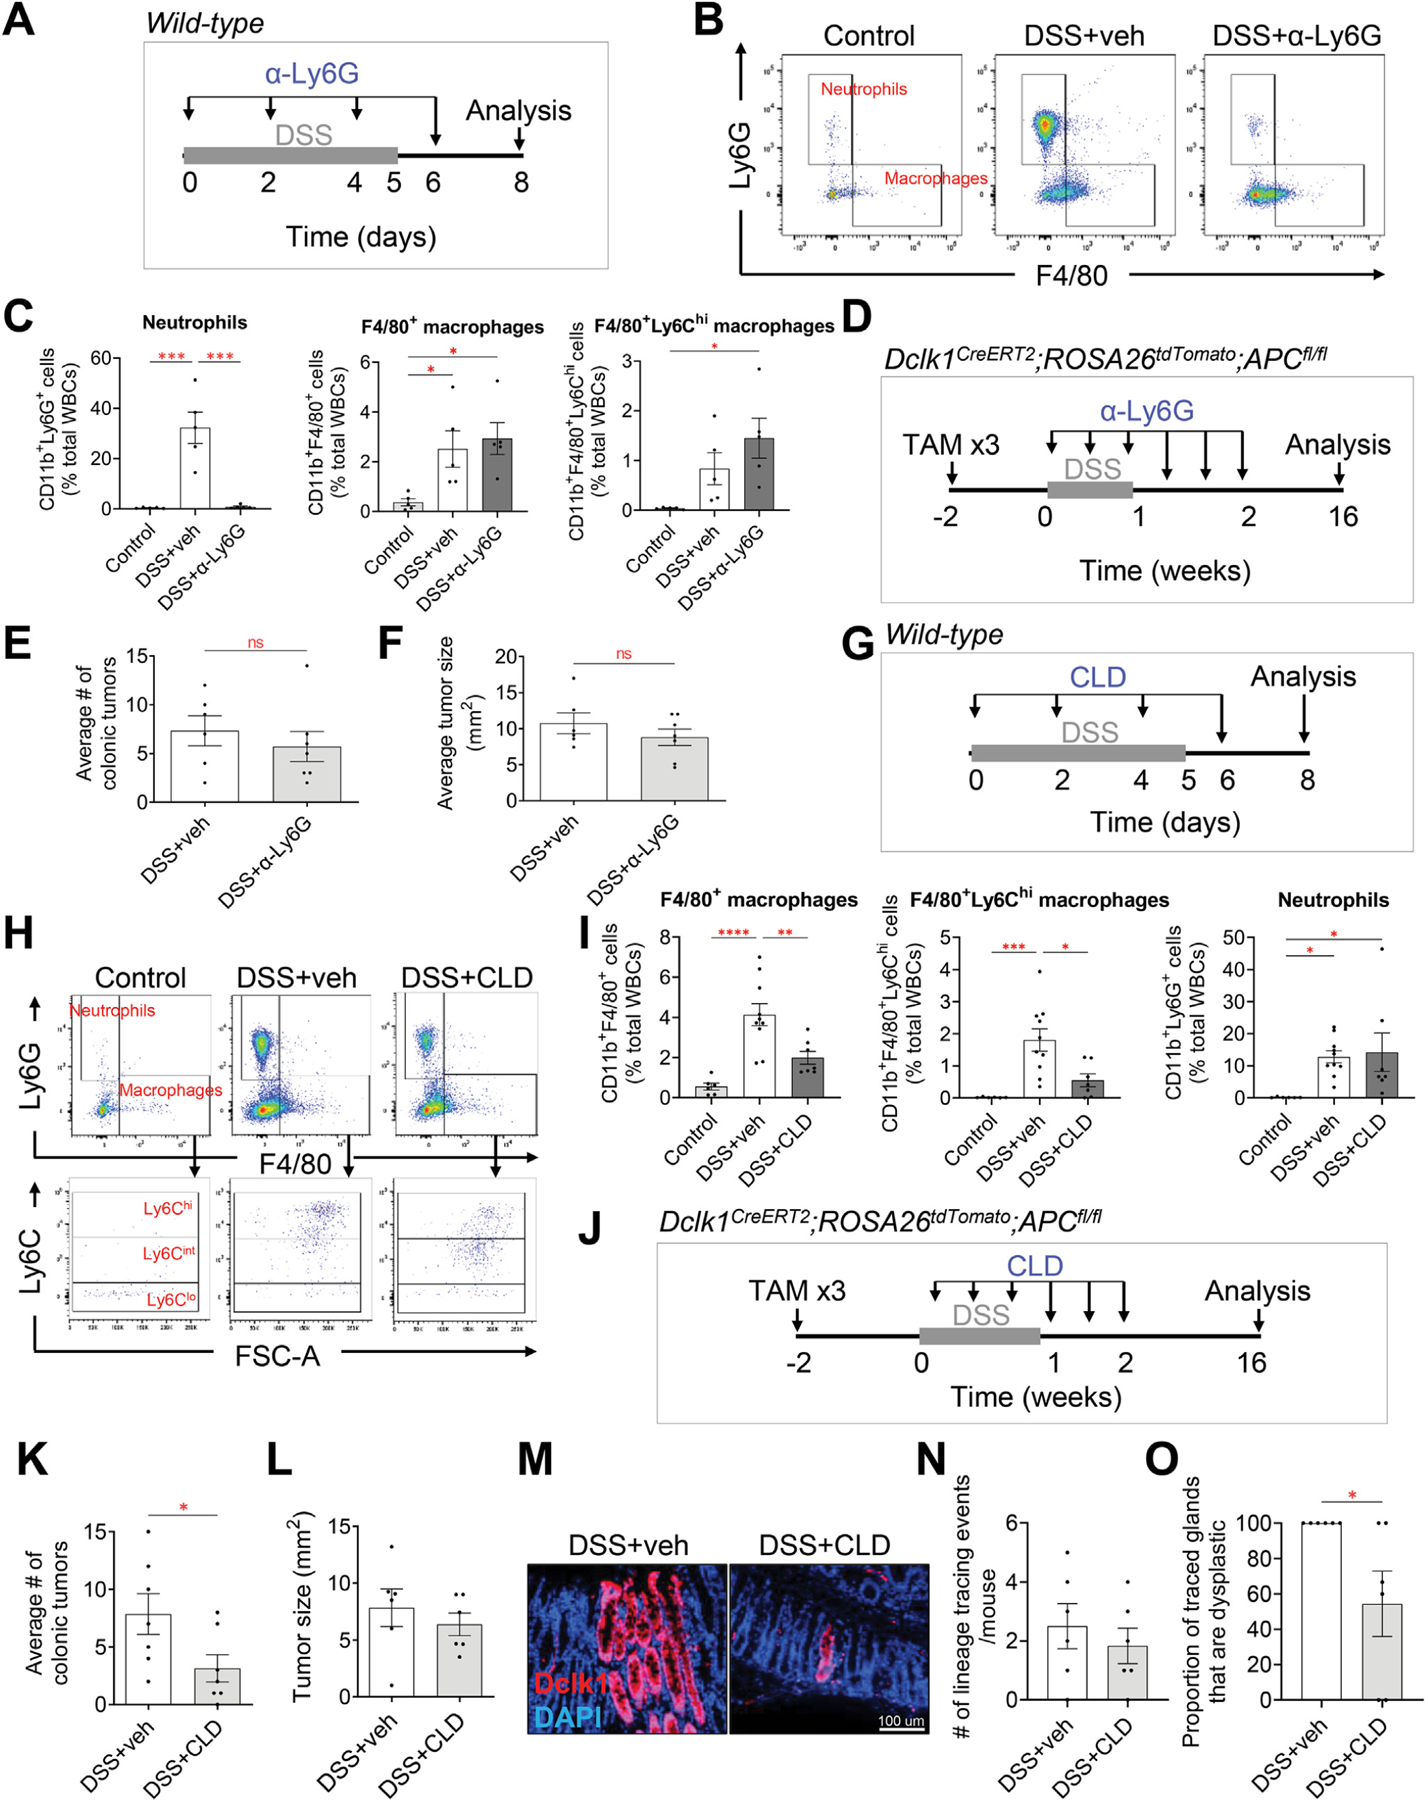
Results: DSS colitis reproducibly led to colonic tumors in both mouse models of colitis-associated cancer. In contrast, all other forms of colitis did not lead to cancer. When compared with the colitis not associated with tumorigenesis, DSS colitis was characterized by significantly increased CD11b+F4/80+Ly6Chigh macrophages and CD11b+Ly6G+ neutrophils. Interestingly, depletion of the CD11b+F4/80+Ly6Chigh macrophages inhibited tumorigenesis, whereas depletion of CD11b+Ly6G+ neutrophils had no effect on tumorigenesis. Furthermore, the macrophage-derived cytokines interleukin-1β, tumor necrosis factor-α, and interleukin-6 were significantly increased in DSS colitis and promoted stemness of Dclk1+ tuft cells that serve as the cellular origin of cancer.

Conclusions: We have identified CD11b+F4/80+Ly6Chigh macrophages as key mediators of cancer initiation in colitis-associated cancer. Development of new therapies that target these cells may provide an effective preventative strategy for colitis-associated cancer.

Keywords: AOM/DSS; Colitis; Colitis-Associated Cancer; Colorectal Cancer; Dclk1; Macrophages; Tuft Cells.


Conflict of interest statement

Conflicts of interest

The authors disclose no conflicts.

Figures

Figure 1.
Figure 1.
Colitis-associated tumorigenesis is dependent on the type of inflammatory response. (A) Experimental setup to assess the propensity of DSS, TNBS, oxazolone (Oxa), C rodentium (Citro), and doxorubicin (Doxo) to induce tumorigenesis in C57BL/6J wild-type mice treated with intraperitoneal injection of 10 mg/kg AOM. (BD) Gross pathology of the colon (B), average colonic tumor number per mouse (C), and percentage of mice (D) with colonic tumors in AOM-treated C57BL/6J wildtype mice treated with vehicle or various colitis-inducing agents (n ≥ 7 per group). (EG) Percent of initial weight (E), longitudinal colon length (F), and gross pathology of the colon (G) at peak point of inflammation from C57BL/6J wild-type mice treated with vehicle or various colitis-inducing agents. Data collected on day 8 for control, DSS, and C rodentium, day 3 for TNBS and oxazolone, and day 4 for doxorubicin (n ≥ 5 per group). (H) MPO activity measured from the distal colon (left) and mid-colon (right) at peak point of inflammation from C57BL/6J wild-type mice treated with vehicle or various colitis-inducing agents (n ≥ 6 per group). (IJ) Representative H&E-stained sections of the colon (I) and their associated histologic score (J) at peak point of inflammation from C57BL/6J wild-type mice treated with vehicle or various colitis-inducing agents (n ≥ 5 per group). (K) Measurement of the crypt height (from crypt base to the luminal side) averaged from distal to proximal colon from C57BL/6J wild-type mice treated with vehicle or various colitis-inducing agents (n ≥ 5 per group). Data in all bar graphs are presented as mean ± SEM. Asterisks above each bar indicate significant differences from the control group. *P < .05, **P < .01, ***P < .001, ****P < .0001.
Figure 2.
Figure 2.
Inflammatory responses differ among models of colitis. (A) Messenger RNA levels of inflammatory cytokines in the distal colonic tissues of C57BL/6J wild-type mice treated with various colitis-inducing agents, measured by means of quantitative reverse transcription polymerase chain reaction (n ≥ 6 per group). (B) Protein levels of inflammatory cytokines in the distal colonic tissues of C57BL/6J wild-type mice treated with various colitis-inducing agents (n = 5 per group). Data are shown as a heatmap, and cytokines are organized according to the associated immune cell type. (C) Representative high-power view of Ki67+ cells in the distal colonic tissues of C57BL/6J wild-type mice treated with various colitis-inducing agents. Scale bar: 100 μm. (D) Quantification of Ki67+ cells reveal increased number of proliferating cells in all colitis models compared with the control group and an increased number of proliferating cells in DSS-treated mice compared with other models of colitis (n ≥ 5 per group). Citro, C rodentium; Doxo, doxorubicin; Oxa, oxazolone. Data in all bar graphs are presented as mean ± SEM. Asterisks above each bar indicate significant differences from the control group. *P < .05, **P < .01, ***P < .001, ****P < .0001.
Figure 3.
Figure 3.
Tuft cells show stemness to give rise to colonic tumors in DSS-induced colitis. (A) Experimental setup to assess the ability of DSS, TNBS, oxazolone (Oxa), C rodentium (Citro), F nucleatum, and doxorubicin (Doxo) to induce tumorigenesis in Dclk1CreERT2;R26tdTomato;APCfl/fl mice treated with 3 injections of 6 mg/kg tamoxifen (TAM). (BD) Gross pathology of the colon (B), average colonic tumor number per mouse (C), and percentage of mice (D) with colonic tumors in tamoxifen-treated in Dclk1CreERT2;R26tdTomato;APCfl/fl mice treated with vehicle or various colitis-inducing agents (n ≥ 6 per group). (E) Representative images of the colonic crypts from Dclk1CreERT2;R26tdTomato;APCfl/fl mice. DAPI, 4′,6-diamidino-2-phenylindole. DSS induces Dclk1 lineage-labeled tumors, whereas Dclk1+ cells remaining as single cells in mice treated with TNBS, oxazolone, C rodentium, and doxorubicin. Scale bar: 50 μm. (FG) Representative immunofluorescence staining (F) and quantification (G) of Dclk1 in colonic tissues of C57BL/6J wild-type mice reveal reduced Dclk1+ cell number in DSS- and oxazolone-treated mice and increased Dclk1+ cell number in C rodentium–inoculated mice. Scale bar: 100 μm. Data in all bar graphs are presented as mean ± SEM. Asterisks above each bar indicate significant differences from the control group. *P < .05, **P < .01, ***P < .001, ****P < .0001.
Figure 4.
Figure 4.
Myeloid cell infiltration is increased in DSS-induced colitis. (A) Representative gating of CD4+ T cells, B cells, Cd11b+ myeloid cells, neutrophils, macrophages, and Ly6Chigh/int/low subset of macrophages from flow cytometric analysis of C57BL/6J wild-type mice treated with various colitis-inducing agents. Citro, C rodentium; Doxo, doxorubicin; Oxa, oxazolone. One representative from each experimental group is shown. (B) Quantification of each immune cell subset as defined in panel A identifying F4/80+Ly6Chigh macrophages and Ly6G+ neutrophils as myeloid cells that are increased in DSS-treated mice compared with other models of colitis. Data are expressed as the percentage of total white blood cells (n ≥ 5 per group). (C) Representative images of immunofluorescent staining of F4/80+ macrophages, CD4+ T cells, and CD45R+ B cells in the colonic tissues of mice treated with various colitis-inducing agents. Scale bar: 100 μm. Data in all bar graphs are presented as mean ± SEM. Asterisks above each bar indicate significant differences from the control group. *P < .05, **P < .01, ***P < .001, ****P < .0001.
Figure 5.
Figure 5.
DSS-induced colitis in mice has an inflammatory profile similar to that of patients with UC. (A) Expression profiles of inflammatory cytokines and chemokines from colonic tissues of mice treated with 2.5% DSS for 5 days and analyzed on day 8. Data were derived from Gene Expression Omnibus (GEO) data set GSE131032 and normalized to control samples (n = 3 in each group). (B) Expression profiles of inflammatory cytokines and chemokines from rectal mucosal biopsies collected before treatment in pediatric patients with new-onset UC. Data were derived from GEO data set GSE109142 and normalized to control samples (n = 20 healthy controls, n = 206 patients with UC). Results in panels A and B highlight the similarities in elevated cytokines associated with myeloid cells between DSS-treated mice and patients with UC. (C) Cytokines known to be associated with colonic inflammation and that were differentially regulated in our DSS-treated mice were also confirmed to be differentially regulated in patients with UC. Data were derived from GEO data set GSE109142. (D) Abundance of myeloid cells in mouse models of colitis and patients with UC, estimated using a gene signature matrix derived from previously published single-cell RNA-sequencing data sets of patients with UC. Data in all bar graphs are presented as mean ± SEM. *P < .05, **P < .01, ***P < .001, ****P < .0001.
Figure 6.
Figure 6.
Macrophage-secreted cytokines induce lineage tracing from tuft cells in vitro. (A) Experimental setup to assess the effects of incubating inflammatory cytokines/agents with intestinal organoids cultured from proximal intestinal tissues of Dclk1CreERT2;R26tdTomato;APCfl/fl mice. (B) Quantification of Dclk1+ cells in organoids incubated with the indicated treatments. Data are collected from 3 biological replicates and are expressed as the number of single tdTomato+ cell per organoid. LPS, lipopolysaccharide. (C, D) Representative images of organoids (C) and quantification of traced organoids on days 4 and 11 (D) identify macrophage-secreted cytokines as the important factors for Dclk1+ tracing. Traced organoids were quantified as the percentage of organoids displaying entire tdTomato+ crypt tracing over the total number of organoids with detectable tdTomato+ cells. (E) Quantification of the organoid area represented as μm2 over time. Morphology and growth of organoids are not different between each group. (F) Dclk1+ tracing induced by incubation with IL-1β is maintained for over 10 passages. (G) Representative images of single cell–derived Dclk1CreERT2;R26tdTomato;APCfl/fl organoids on days 1 and 7 following culture in the presence of vehicle vs IL-1β, and (H) quantification of tdTomato+ cell–derived organoids 7 days after culture in vehicle vs IL-1β. Data in all bar graphs are presented as mean ± SEM. Asterisks above each bar indicate significant differences from the control group. *P < .05, **P < .01, ***P < .001, ****P < .0001.
Figure 7.
Figure 7.
Depletion of Ly6G+ neutrophils does not affect colitis-associated tumorigenesis, whereas depletion of F4/80+Ly6Chigh cells significantly reduces colitis-associated tumorigenesis. (A) Illustration of the experimental protocol outlining α-Ly6G antibody–mediated neutrophil depletion in DSS-induced wild-type mice. (B) Representative gating of neutrophils and F4/80+ macrophages from flow cytometric analysis. One representative from each experimental group is shown. veh, vehicle. (C) Quantification of neutrophils and macrophages, as defined in Figure 4. α-Ly6G antibody is specific to neutrophils and is 98% effective. Data are expressed as the percentage of total white blood cells (n = 5 per group). (D) Illustration of the experimental protocol outlining α-Ly6G antibody–mediated neutrophil depletion in Dclk1CreERT2;R26tdTomato;APCfl/fl mice given tamoxifen (TAM) and DSS. (E, F) Neutrophil depletion does not affect colitis-associated tumorigenesis and does not affect the growth of the tumors, as indicated by the average colonic tumor number per mouse (E), and average size of the tumors (F) (n = 6 control: n = 7 α-Ly6G). (G) Illustration of the experimental protocol outlining CLD liposome–mediated macrophage depletion in DSS-induced wild-type mice. (H) Representative gating of neutrophils, F4/80+ macrophages, and Ly6Chigh/int/low subset of macrophages from flow cytometric analysis. One representative from each experimental group is shown. (I) Quantification of neutrophils and macrophages, as defined in Figure 4. CLD is specific to F4/80+Ly6Chigh subset of macrophages and is 69% effective. Data are expressed as the percentage of total white blood cells (n = 5 per group). (J) Illustration of the experimental protocol outlining CLD-mediated F4/80+Ly6Chigh macrophage depletion in Dclk1CreERT2;R26tdTomato;APCfl/fl mice given tamoxifen and DSS. (KL) CLD prevents colitis-associated tumorigenesis and does not affect the growth of the tumors as indicated by the average colonic tumor number per mouse (K), and average size of the tumors (L) (n = 7 per group). (MO) Representative images of Dclk1 lineage–traced glands (M), the associated quantification of tdTomato+–traced glands (N), and the proportion of traced crypts that are dysplastic (O) in the healthy colonic tissues at the 16-week time point. Data are expressed as the percentage of total number of mice. Data in all bar graphs are presented as mean ± SEM. Asterisks above each bar indicate significant differences from the control group. *P < .05, **P < .01, ***P < .001, ****P < .0001.

References

    1. GLOBOCAN 2020. Colorectal Cancer. International Agency for Research on Cancer, World Health Organization. Accessed January 25, 2023. https://gco.iarc.fr/today/data/factsheets/cancers/10_8_9-Colorectum-fact....
    1. Ullman TA, Itzkowitz SH. Intestinal inflammation and cancer. Gastroenterology 2011;140:1807–1816. - PubMed
    1. Eaden JA, Abrams KR, Mayberry JF. The risk of colorectal cancer in ulcerative colitis: a meta-analysis. Gut 2001;48:526–535. - PMC - PubMed
    1. Axelrad JE, Lichtiger S, Yajnik V. Inflammatory bowel disease and cancer: the role of inflammation, immuno-suppression, and cancer treatment. World J Gastroenterol 2016;22:4794–4801. - PMC - PubMed
    1. Neufert C, Becker C, Neurath MF. An inducible mouse model of colon carcinogenesis for the analysis of sporadic and inflammation-driven tumor progression. Nat Protoc 2007;2:1998–2004. - PubMed

Publication types