. 2023 Jan 12;14(1):19.
doi: 10.1038/s41419-023-05553-1.

Pericentromeric satellite lncRNAs are induced in cancer-associated fibroblasts and regulate their functions in lung tumorigenesis

Affiliations

Pericentromeric satellite lncRNAs are induced in cancer-associated fibroblasts and regulate their functions in lung tumorigenesis

Natella I Enukashvily et al. Cell Death Dis. .

Abstract

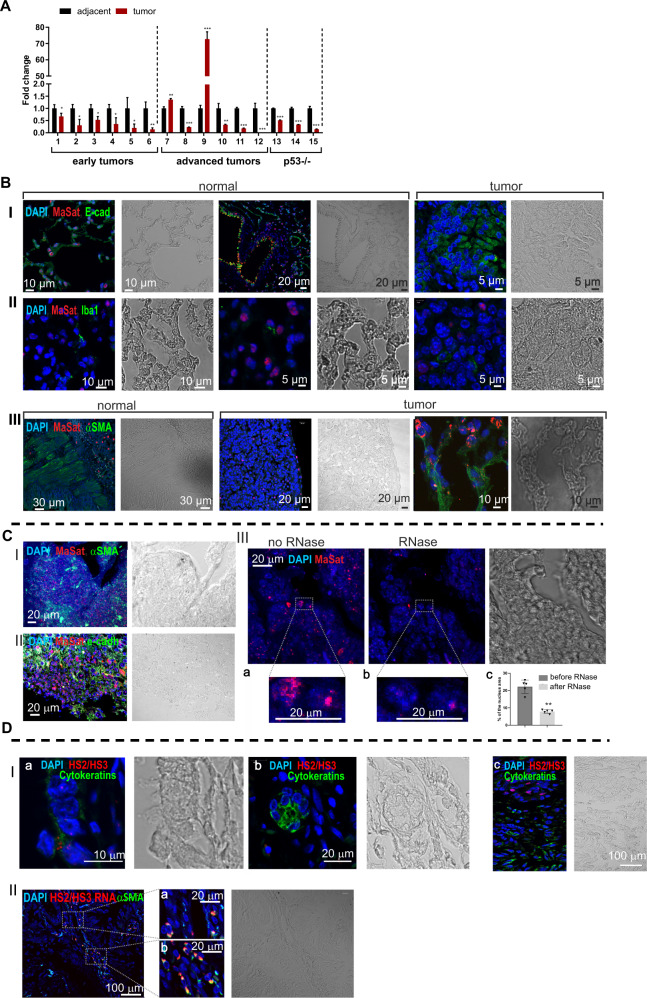
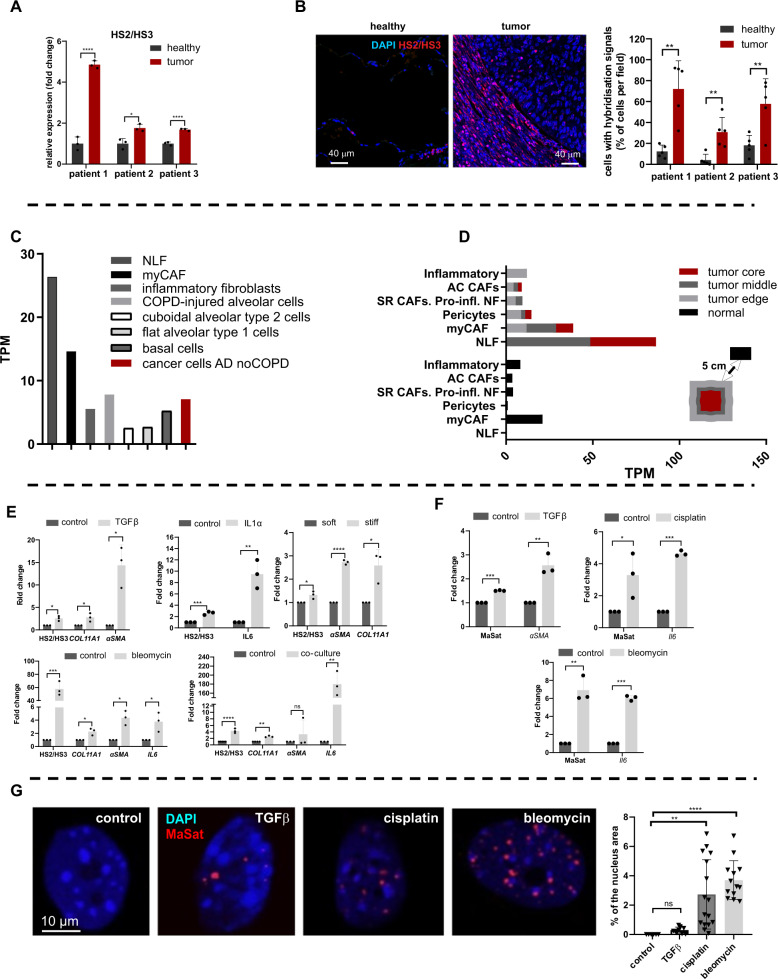
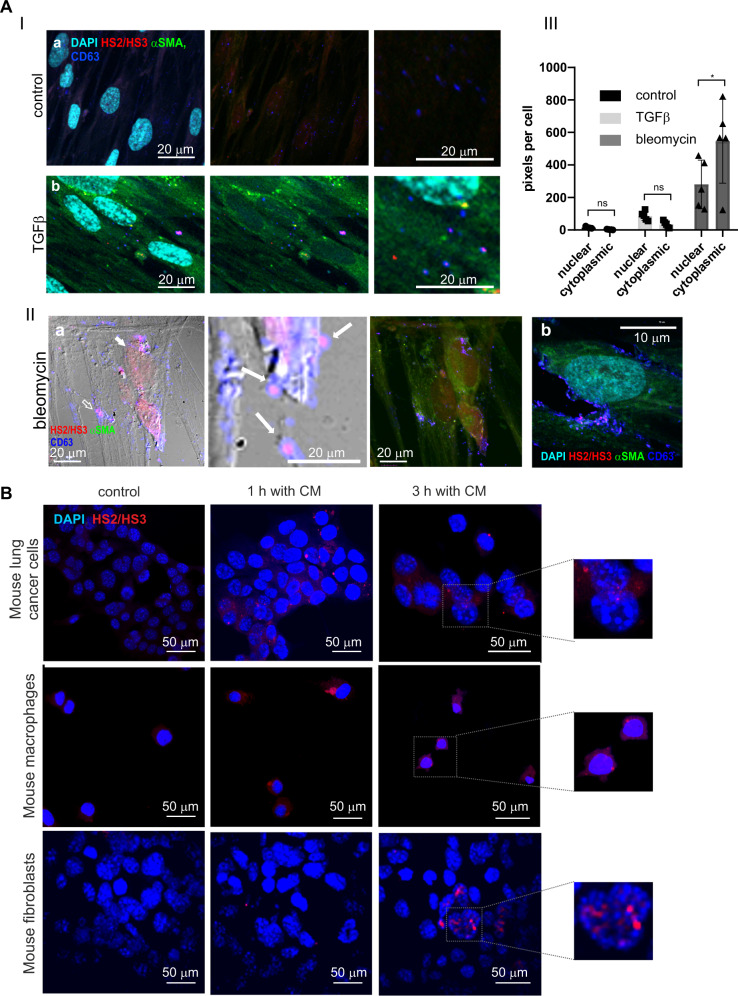
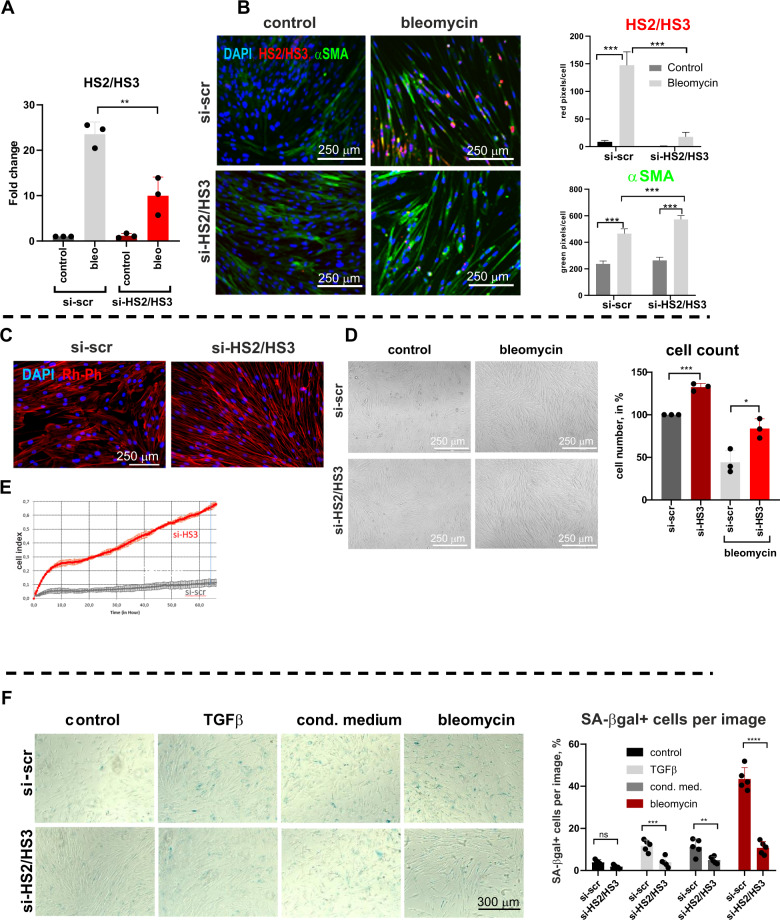
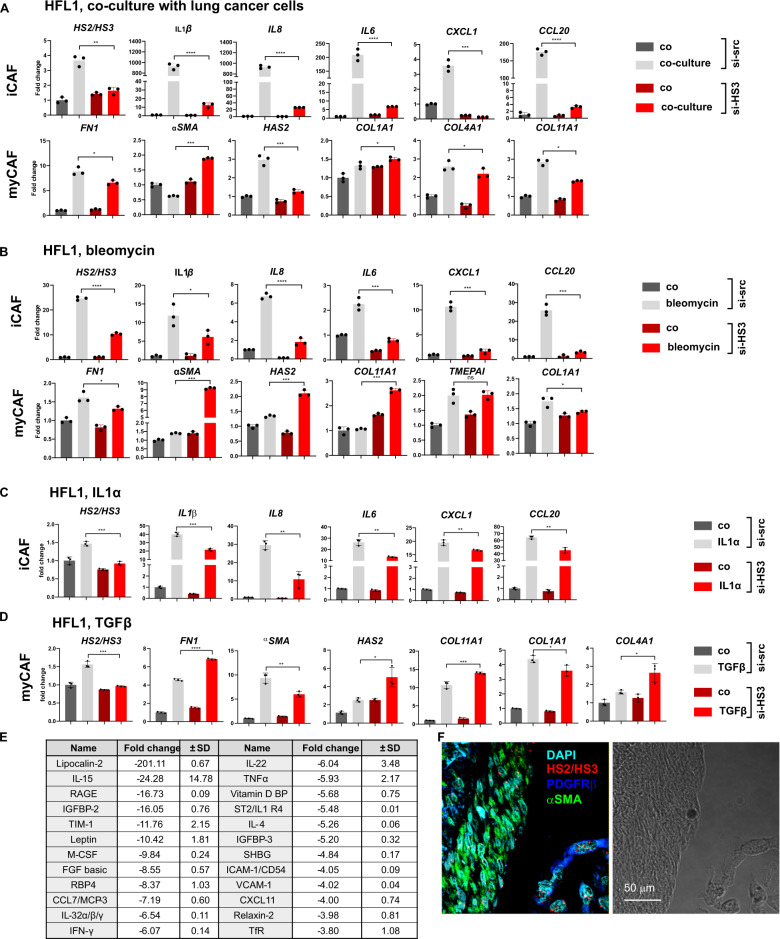
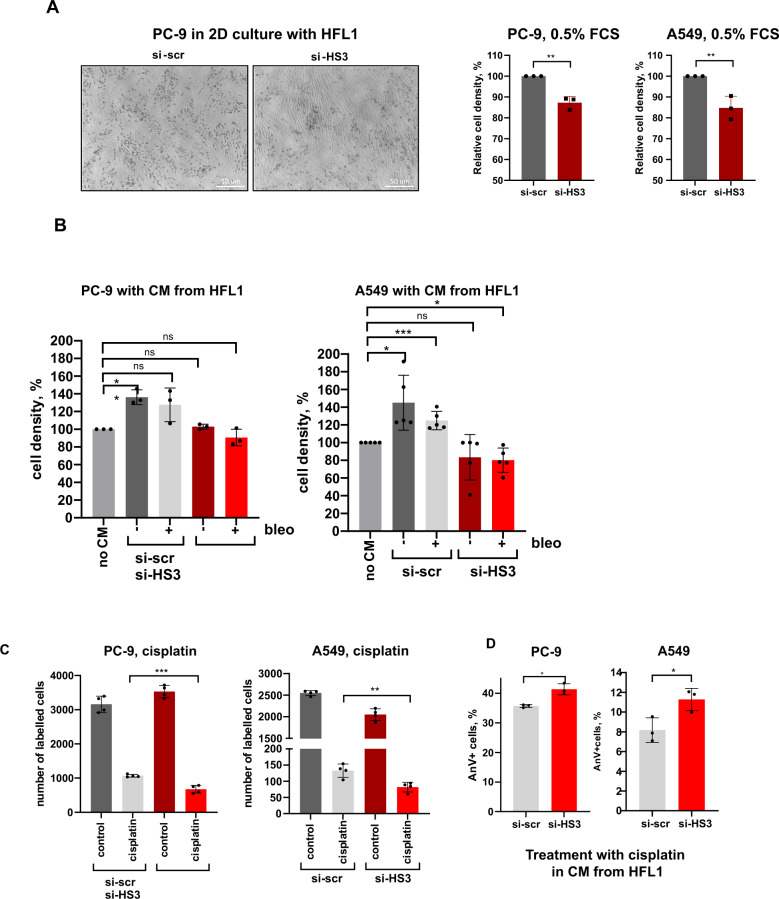
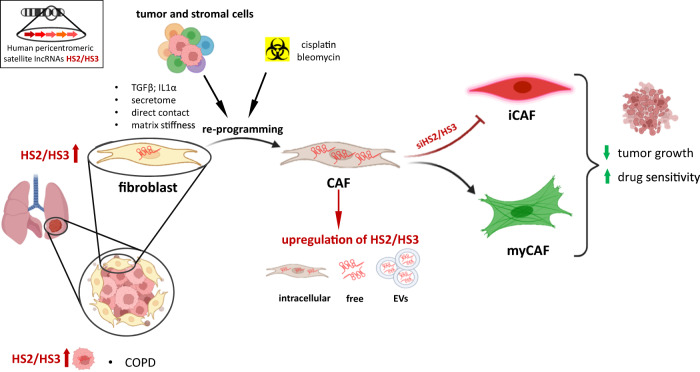
The abnormal tumor microenvironment (TME) often dictates the therapeutic response of cancer to chemo- and immuno-therapy. Aberrant expression of pericentromeric satellite repeats has been reported for epithelial cancers, including lung cancer. However, the transcription of tandemly repetitive elements in stromal cells of the TME has been unappreciated, limiting the optimal use of satellite transcripts as biomarkers or anti-cancer targets. We found that transcription of pericentromeric satellite DNA (satDNA) in mouse and human lung adenocarcinoma was observed in cancer-associated fibroblasts (CAFs). In vivo, lung fibroblasts expressed pericentromeric satellite repeats HS2/HS3 specifically in tumors. In vitro, transcription of satDNA was induced in lung fibroblasts in response to TGFβ, IL1α, matrix stiffness, direct contact with tumor cells and treatment with chemotherapeutic drugs. Single-cell transcriptome analysis of human lung adenocarcinoma confirmed that CAFs were the cell type with the highest number of satellite transcripts. Human HS2/HS3 pericentromeric transcripts were detected in the nucleus, cytoplasm, extracellularly and co-localized with extracellular vesicles in situ in human biopsies and activated fibroblasts in vitro. The transcripts were transmitted into recipient cells and entered their nuclei. Knock-down of satellite transcripts in human lung fibroblasts attenuated cellular senescence and blocked the formation of an inflammatory CAFs phenotype which resulted in the inhibition of their pro-tumorigenic functions. In sum, our data suggest that satellite long non-coding (lnc) RNAs are induced in CAFs, regulate expression of inflammatory genes and can be secreted from the cells, which potentially might present a new element of cell-cell communication in the TME.


Conflict of interest statement

The authors declare no competing interests.

Figures

Fig. 1
Fig. 1. Transcription of satellite DNA in CAFs in mouse and human lung cancer.
A RT-qPCR analysis of MaSat transcription in mouse lung tumors (red bars) and adjacent tissue (black bars). Cut tissues were obtained from mice bearing mutated KrasG12D at the age of 10-14 weeks (early tumors), late stages with advanced lung cancer (33-47 weeks old), or from p53-deficient mice at the terminal stage of life. The numbers on the X-axis correspond to the individual mice (animal number). Each sample is a pool of ≥3 individual tumors or adjacent tissue from the same tumor lung. Data are mean ± SD. *p < 0.05; **p < 0.01; ***p < 0.001. B DNA-RNA FISH of MaSat transcripts on histological sections of lungs from KrasG12D mice 10–14 weeks of age. MaSat transcripts (red), epithelial E-cadherin (green, panel I), macrophage marker Iba1 (green, panel II), fibroblast marker αSMA (green, panel III). Scale bars are shown in the images. C. DNA-RNA FISH of MaSat transcripts on histological sections of lungs from KrasG12D 33–47-week-old mice. MaSat transcripts (red), fibroblast marker αSMA (green, panel I) epithelial marker E-cadherin (green, panel II). The images in panel III show the same field before (a) and after (b) RNase treatment (see material and methods; panel III). The hybridization signal could be removed almost completely by RNase treatment. Representative images (in dotted rectangles) of treated and untreated nuclei are shown at higher magnification. The nuclei in all images are counterstained by DAPI (blue). Scale bars are shown in the images. The results of RNase treatment quantification (see Supplemental material and methods, Microscopy section) of 5 randomized fields (cell number ∼150–200 per field) is shown in (panel III, c). Y-axis—percentage of the nucleus area occupied by FISH signals. Mean and standard deviations are plotted along with the individual values used for calculations. **p < 0.01. D Panel I. HS2/HS3 transcripts (red) in human adenocarcinoma sections stained with the CKMN AB specific to a wide spectrum of cytokeratines (green). The corresponding phase-contrast images are shown. (a) normal airway epithelium, (b) small adenocarcinoma nodule, (c) adenocarcinoma with papillary growth pattern. The nuclei are counterstained by DAPI (blue). Scale bars are shown in the images. Panel II. HS2/HS3 transcripts (red pseudocolor) in human adenocarcinoma sections stained with anti-αSMA antibodies (green pseudolor). The corresponding phase-contrast image is shown. At the right—fragments (a) and (b) represent the areas inside the dotted rectangles at higher magnification. The nuclei are counterstained by DAPI (blue). Scale bars are shown in the images. For each panel a representative image of no less than 10 scanned areas is shown.
Fig. 2
Fig. 2. Transcription of satellite DNA is induced in lung cancer-associated fibroblasts in vitro.
A RT-qPCR analysis of HS2/HS3 transcripts in bulk tumor tissue and corresponsing healthy adjacent tissue of three NSCLC patients. B Sections of healthy adjacent (left image) and tumor (right image) tissues probed with HS2/HS3 (red). The nuclei in all images are counterstained by DAPI (blue). Scale bars (40 µm) are shown in the images. Total magnification—×400. The results of DNA-RNA FISH quantification for three patients are shown in the graph. Five fields of view were taken for the quantification of each slide. C HS2/HS3 transcript quantity in NLF—normal lung fibroblasts, myCAF, inflammatory fibroblasts, epithelial and cancer cells (adenocarcinoma without COPD) was calculated for transcriptomes that we reassembled from single-cell RNAseq raw data published by Lambrechts et al. [11]. Quantification was performed for each cell cluster as a whole regardless of its origin from normal or tumor tissue. Data of quantification is shown as TPM value plotted on the Y-axis. D HS2/HS3 content in fibroblast subpopulation transcriptomes was calculated for cells obtained from the tumor core, middle and edge area, and non-malignant (‘normal’) adjacent tissue from the same resection specimen at maximal distance (>5 cm) from the tumor. Stress-response CAF—SR CAFs; proinflammatory normal fibroblasts—Pro-iNF; activated CAF—AC CAFs. Markers are shown in Table S1. E qRT-qPCR analysis of HS2/HS3 transcripts and CAF markers as positive controls in serum-starved and activated human lung fibroblasts (HFL1) untreated (control) or treated for 2 days with 10 ng/ml TGFβ1, 10 ng/ml IL1α, 30 μg/ml bleomycin, co-cultured with human lung cancer cells PC-9 or grown on soft and stiff matrixes. Data are mean from three independent experiments ± SD (n = 3). *p < 0.05; **p < 0.01; ***p < 0.001, F RNA level of MaSat or marker genes αSMA or IL6 in primary serum-starved mouse lung fibroblasts treated with 20 ng/ml TGFβ1 (left graph) or with 2 μg/ml cisplatin or 30 μg/ml bleomycin; n = 3. Y-axis—fold change. Data are mean from three independent experiments ± SD. ***p < 0.001. G MaSat transcripts were visualized by DNA-RNA FISH (red) in primary mouse lung fibroblasts as in (F). Representative nuclei are shown. The results of quantification of ≥ 12 fields (Materials and methods, Microscopy section) are shown in the graph. The nuclei are counterstained by DAPI (blue).
Fig. 3
Fig. 3. Extracellular localization of HS2/HS3 satellite transcripts in activated human lung fibroblasts and human HS2/HS3 transfer to mouse cells.
A Panel I. HS2/HS3 transcription in serum-starved HFL1 fibroblasts left untreated (a) or after treatment for 4 d with 20 ng/ml TGFβ1 (b). Fixed fibroblasts were co-stained with HS2/HS3 probe (red), anti-αSMA antibodies (green) and CD63 (extracellular vesicles marker, blue). The nuclei are counterstained with DAPI (turquoise). Right image - intracellular CD63+ vesicles at higher magnification. Scale bars (20 μm) are shown in the images. Total magnification – x400. The results of immuno-FISH quantification of ≥12 fields are shown in the graph. Panel II. HS2/HS3 transcription (red) in serum-starved HFL1 fibroblasts after treatment with bleomycin. Cells were co-stained with anti-αSMA (green) and anti-CD63 (blue) antibodies. (a) cells with the intranuclear-cytoplasmic pattern of HS2/HS3 transcripts distribution; (b) A cell with cytoplasmic pattern of HS2/HS3 transcripts distribution. The nuclei are counterstained by DAPI (turquoise). Scale bars—(Ia) 20 µm, (IIb)—10 µm. Total magnification – x400. Panel III. The FISH images (5 randomized fields with cell number ≥150 in each of them) were quantified (see Supplemental material and methods, Microscopy section) to access the ratio between nucleoplasmic and cytoplasmic signals. The number of pixels occupied by FISH signals in cytoplasm and nuclei was calculated and plotted on the Y-axis Mean and standard deviations are plotted along with the individual values used for calculations. ns—non-significant (p > 0.05), *p < 0.05. B Mouse lung cancer cells, mouse BMD macrophages and MEF cells were serum-starved for 2 d and left untreated (control) or treated for 1 h or 3 h with conditioned media collected from bleomycin-treated serum-starved human HFL1 cells. Human HS2/HS3 transcripts were visualized by DNA-RNA FISH with DYZ probe (red). Representative images (in dotted rectangles) of cells after 3 h treatment are shown at higher magnification for better presentation of human HS2/HS3 intranuclear signals in mouse cells. For each panel a representative image of no less than 10 scanned areas is shown. The nuclei are counterstained by DAPI (blue). Scale bars 50 µm.
Fig. 4
Fig. 4. Knock-down of HS2/HS3 attenuates senescence of human lung fibroblasts.
qRT-PCR analysis (A) or immune DNA-RNA FISH (B) of HS2/HS3 (red) and αSMA (green) in HFL1 transfected with scrambled siRNA or siRNA targeting human HS2/HS3 were serum starved and left untreated or treated for 4 d with 30 μg/ml bleomycin. Mean/SD from three independent experiments is shown. C HFL1 cells were transfected with siRNA, serum-starved for 6 days and stained with rhodamine-phalloidin (Rh-Ph). One out of five representative images is shown. D Brightfield image of HFL1 cells 6 d after transfection with siRNAs, serum starved untreated or treated with bleomycin. Cell number of cells grown for 4 d at 0.5% FCS media is presented at the graph (right); n = 3, 3 independent experiments. E xCELLigence real-time cell analysis (RTCA) dual purpose (DP) system (Agilent, USA) -recorded growth of primary human adult lung fibroblasts transfected with si-scr or si-HS2/HS3 and treated with bleomycin. F SA-βgal staining of starved HFL1 cells treated for 4 d with TGFβ, conditioned media from A549 tumor cells or 30 μg/ml bleomycin. One out of five representative images for each treatment is shown. Percentage of SA-βgal-positive cells per image has been calculated from 5 independent images and shown in the graph. Scale bars are shown in the images.
Fig. 5
Fig. 5. HS2/HS3 satellite transcripts are involved in building inflammatory phenotype of CAFs.
qRT-PCR analysis of iCAF and myCAF genes in HFL1 cells transfected with scrambled siRNA or siHS2/HS3 serum-starved and co-cultured with PC-9 tumor cells (A) or treated with 30 μg/ml bleomycin for 4 d (B) or with 10 ng/ml IL1α (C) or 10 ng/ml TGFβ1 (D). Y-axis—fold change of relative expression (n = 3; mean ± SD). Data of one out of three independent experiments are shown. *p < 0.05; **p < 0.01; ***p < 0.001. E Summary of cytokine/chemokine level quantification in conditioned media collected from serum-starved si-scrambled or si-HS2/HS3 transfected HFL1 and treated with bleomycin for 4 d. Fold change and SD has been obtained as ratio of relative levels in si-scrabled sample versus si-HS2/HS3 transfected sample. None of cytokines was found to be upregulated in si-HS2/HS3 versus si-scrambled fibroblasts. Original membrane image is presented at Fig. S8A. F HS2/HS3 transcripts (red) in human adenocarcinoma sections stained with αSMA (myCAF, green) or PDGFRβ (iCAF, green).
Fig. 6
Fig. 6. HS2/HS3 satellite transcripts regulate pro-tumorigenic functions of CAFs.
A A549 and PC-9 cells were grown for 4 d in 0.5% FSC media in 2D contact coculture with HFL1 cells transfected either with si-scrambled (si-scr) or si-HS2/HS3 (si-HS3) RNAs. A representative photo for coculture of PC-9 cells with distinct round morphology is included. Number of tumor cells (measured as relative cell density) from 3 independent experiments is shown at the graph (absolute number of cells from one representative experiment is in Fig. S9A). B Serum-starved A549 or PC-9 tumor cells were grown in the presence of conditioned media collected from activated HFL1 cells or pre-treated with bleomycin. Relative cell number (%) from three (PC-9) and five (A549) independent experiments is presented. The photo of cells is in Fig. S9B, the absolute number of cells from one representative experiment is in Fig. S9C. C. A549 and PC-9 cells were grown for 4 d in 2D-coculture with HFL1 cells transfected either with si-scr or si-HS2/HS3 in the presence of 1 μg/ml cisplatin in media with 5% FCS. The graph shows the absolute number of cells from one out of three independent experiments. D. Percentage of AnnexinV+ PC-9 or A549 cells treated for 48 h with 1 μg/ml cisplatin in the presence of conditioned media collected from activated HFL1.
Fig. 7
Fig. 7. Graphical abstract.
Transcription of pericentromeric satellite DNA is upregulated predominantly in cancer-associated fibroblasts in NSCLC or also in tumor cells in NSCLC patients with chronic obstructive pulmonary disease (COPD). Direct contact with tumor cells, matrix stiffness, TGFβ or IL1α in the tumor secretome re-program normal fibroblasts into CAFs and induce expression of satellite lncRNAs located in the nucleus, in the cytoplasm or secreted as free lncRNAs or packed in extracellular vesicles (EVs). HS2/HS3 is induced in both types of activated fibroblasts: myofibroblastic (myCAFs) and inflammatory (iCAFs). HS2/HS3 RNAs regulate the development of an inflammatory phenotype of CAFs supporting tumor growth. Depleting HS2/HS3 transcripts with siRNA impairs pro-tumorigenic functions of iCAFs, but not myCAFs, suppressing the proliferation of tumor cells and sensitizing cancer cells to chemotherapeutics.

References

    1. Altorki NK, Markowitz GJ, Gao D, Port JL, Saxena A, Stiles B, et al. The lung microenvironment: an important regulator of tumour growth and metastasis. Nat Rev Cancer. 2019;19:9–31. doi: 10.1038/s41568-018-0081-9. - DOI - PMC - PubMed
    1. Chen Z, Fillmore CM, Hammerman PS, Kim CF, Wong KK. Non-small-cell lung cancers: a heterogeneous set of diseases. Nat Rev Cancer. 2014;14:535–46. doi: 10.1038/nrc3775. - DOI - PMC - PubMed
    1. Brichkina A, Bertero T, Loh HM, Nguyen NTM, Emelyanov A, Rigade S, et al. P38MAPK builds a hyaluronan cancer niche to drive lung tumorigenesis. Genes Dev. 2016;30:2623–36. doi: 10.1101/gad.290346.116. - DOI - PMC - PubMed
    1. Caetano MS, Zhang H, Cumpian AM, Gong L, Unver N, Ostrin EJ, et al. IL6 blockade reprograms the lung tumor microenvironment to limit the development and progression of K-ras-mutant lung cancer. Cancer Res. 2016;76:3189–99. doi: 10.1158/0008-5472.CAN-15-2840. - DOI - PMC - PubMed
    1. Navab R, Strumpf D, Bandarchi B, Zhu C-Q, Pintilie M, Ramnarine VR, et al. Prognostic gene-expression signature of carcinoma-associated fibroblasts in non-small cell lung cancer. Proc Natl Acad Sci. 2011;108:7160–65. doi: 10.1073/pnas.1014506108. - DOI - PMC - PubMed

Publication types