. 2023 Jan 12;13(1):662.
doi: 10.1038/s41598-022-26588-y.

Genetic complementation fosters evolvability in complex fitness landscapes

Affiliations

Genetic complementation fosters evolvability in complex fitness landscapes

Ernesto Segredo-Otero et al. Sci Rep. .

Abstract

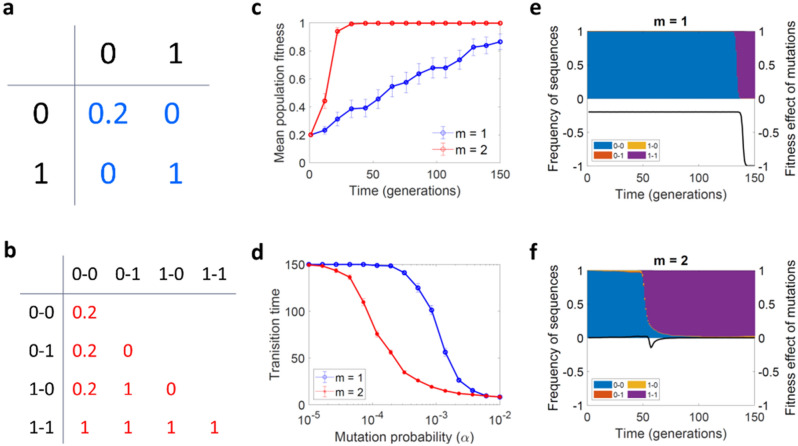
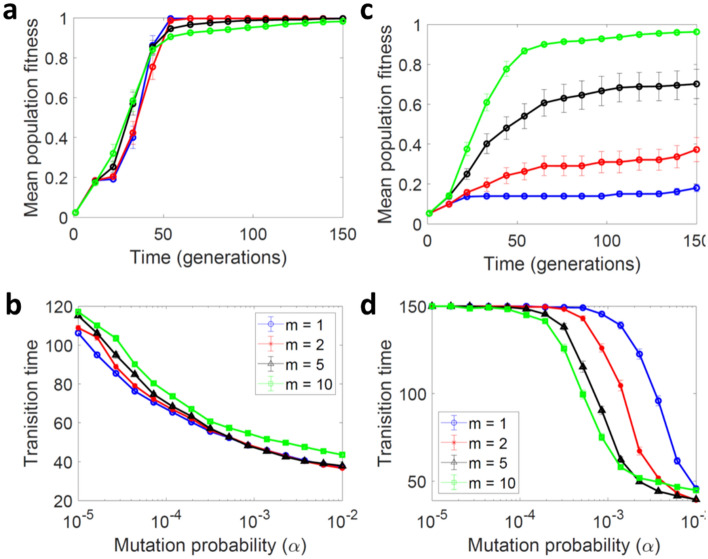
The ability of natural selection to optimize traits depends on the topology of the genotype-fitness map (fitness landscape). Epistatic interactions produce rugged fitness landscapes, where adaptation is constrained by the presence of low-fitness intermediates. Here, we used simulations to explore how evolvability in rugged fitness landscapes is influenced by genetic complementation, a process whereby different sequence variants mutually compensate for their deleterious mutations. We designed our model inspired by viral populations, in which genetic variants are known to interact frequently through coinfection. Our simulations indicate that genetic complementation enables a more efficient exploration of rugged fitness landscapes. Although this benefit may be undermined by genetic parasites, its overall effect on evolvability remains positive in populations that exhibit strong relatedness between interacting sequences. Similar processes could operate in contexts other than viral coinfection, such as in the evolution of ploidy.


Conflict of interest statement

The authors declare no competing interests.

Figures

Figure 1
Figure 1
Definitions of genetic complementation. The simplest, two-locus two-allele system is shown. The two alleles are shown in orange and white. (a) Arbitrarily defined landscape that assigns a fitness value to each individual sequence. (bd) Different rules for determining the fitness of pairs of complementing sequences. (b) Full trans-complementation, in which group fitness is determined by the fittest allele combination. (c) Average trans-complementation, in which group fitness equals the average fitness of all allele combinations. (d) Full cis-complementation, in which group fitness is determined by the fittest sequence. (e) Average cis-complementation, in which group fitness equals the average fitness of individual sequences.
Figure 2
Figure 2
Genetic trans-complementation promotes evolvability in a two-sequence, two-locus, two-allele model. (a) Fitness values for each of the four possible sequences. (b) Fitness values for each of the 10 possible two-by-two interactions. (c) Evolution of mean population fitness in the presence (red) or absence (blue) of trans-complementation between pairs of sequences. (d) Average number of generations required for the population to reach a mean fitness higher than 0.95 as a function of the mutation rate, α. (ef) Individual simulations showing the frequency of each sequence (0–0, 0–1, 1–0, and 1–1) and the average fitness effect of individual mutations (black line) as a function of time. Parameters S = 10,000, and in c and ef, α = 0.001. In cd, we show the average and SEM from 100 simulations.
Figure 3
Figure 3
Effect of trans-complementation on evolvability in the presence of genetic parasites. A two-sequence, two-loci, two-allele model was used, allowing for genetic parasites.(ac) Random groups. (df) Kin groups (i.e. restricting interactions to sequences derived from a common parental group). (a, d) Average number of generations required for the population to reach a mean fitness higher than 0.95 as a function of the mutation rate, α, for non-interacting sequences (blue, in (a) we show the same as in Fig. 2d), groups of helper sequences with no parasites (red, in (a) we show the same as in Fig. 2d), and groups of helpers allowing for parasites (black). (b, e) Association between intra-group genetic diversity (black) and mean population fitness (blue). In each panel, a single simulation is shown to illustrate the association between these two variables. Intra-group genetic diversity (black) was calculated as the fraction of polymorphic alleles within groups, the alleles being “0 helper”, “1 helper” or parasite. (c, f) Fraction of genetic parasites as a function of time in the same individual simulations. Parameters S = 10,000, αC = 0.001, βC = 5 and in bc and ef: α = 0.001. In a and d we show average and SEM values obtained from 100 replicate simulations.
Figure 4
Figure 4
Effects of cis-complementation on evolvability. (a) Fitness values for each of the four possible sequences. (b) Fitness values for each of the 10 possible two-by-two interactions, calculated as the fitness of the best sequence present. (c) Evolution of mean population fitness in the presence (red) or absence (blue) of cis-complementation between pairs of sequences. (d) Average number of generations required for the population to reach a mean fitness higher than 0.95, as a function of the mutation rate, α. (ef) Individual simulations showing the frequency of each sequence (0–0, 0–1, 1–0, and 1–1) and the average fitness effect of individual mutations (black line) as a function of time. Parameters S = 10,000, αC = 0.001 and βC = 5. and in c and ef, α = 0.001. In cd we show the average and SEM from 100 simulations, with the kin-groups transmission method.
Figure 5
Figure 5
Genetic trans-complementation promotes evolvability in complex fitness landscapes. (a–b): Smooth fitness landscape (K = 1). (cd): Rugged fitness landscape (K = 4). (a, c) Evolution of mean population fitness over time in simulations with non-interacting sequences (blue), and in the presence of full trans-complementation in groups of size m = 2 (red), m = 5 (black) and m = 10 (green). (b, d) Average number of generations required for the system to reach a mean population fitness higher than 0.95, as a function of the mutation rate, α. Genetic parasites were allowed, but populations were structured in kin groups. Parameters S = 10,000, αC = 0.001 and βC = 5, α = 0.001 (in a and c). The mean and SEM values from 100 simulations are shown.
Figure 6
Figure 6
Trans-complementation fosters exploration of complex fitness landscapes. (a) Mean population fitness as a function of the mean Hamming distance of the population to the optimum over 10 individual simulations. (b) Average Hamming distance of the population to the optimum, as a function of time. (c) Average fitness effect of mutations as a function of time. For each type of plot, the four graphs show the results obtained with four different m-values, as indicated. A full trans-complementation model with parasites and kin groups was used. Parameters N = 5, K = 4, S = 10,000, α = 0.0005, αC = 0.001 and βC = 5.

References

    1. Payne JL, Wagner A. The causes of evolvability and their evolution. Nat. Rev. Genet. 2019;20:24–38. doi: 10.1038/s41576-018-0069-z. - DOI - PubMed
    1. Fragata I, Blanckaert A, Dias Louro MA, Liberles DA, Bank C. Evolution in the light of fitness landscape theory. Trends Ecol. Evol. 2019;34:69–82. doi: 10.1016/j.tree.2018.10.009. - DOI - PubMed
    1. Kondrashov DA, Kondrashov FA. Topological features of rugged fitness landscapes in sequence space. Trends Genet. 2015;31:24–33. doi: 10.1016/j.tig.2014.09.009. - DOI - PubMed
    1. Gros P-A, Le Nagard H, Tenaillon O. The evolution of epistasis and its links with genetic robustness, complexity and drift in a phenotypic model of adaptation. Genetics. 2009;182:277–293. doi: 10.1534/genetics.108.099127. - DOI - PMC - PubMed
    1. Weinreich DM, Delaney NF, Depristo MA, Hartl DL. Darwinian evolution can follow only very few mutational paths to fitter proteins. Science. 2006;312(5770):111–114. doi: 10.1126/science.1123539. - DOI - PubMed

Publication types