. 2023 Jan;55(1):44-53.
doi: 10.1038/s41588-022-01270-1. Epub 2023 Jan 12.

Genomic atlas of the plasma metabolome prioritizes metabolites implicated in human diseases

Affiliations

Genomic atlas of the plasma metabolome prioritizes metabolites implicated in human diseases

Yiheng Chen et al. Nat Genet. 2023 Jan.

Abstract

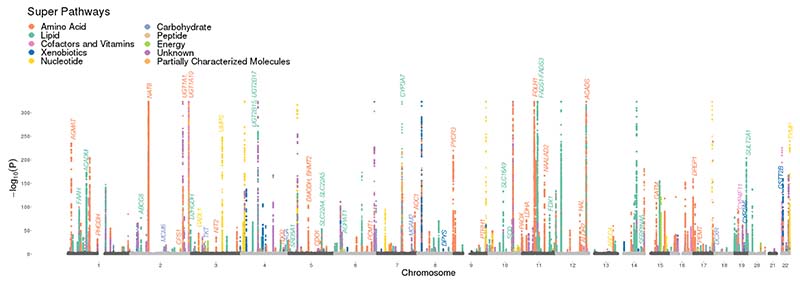
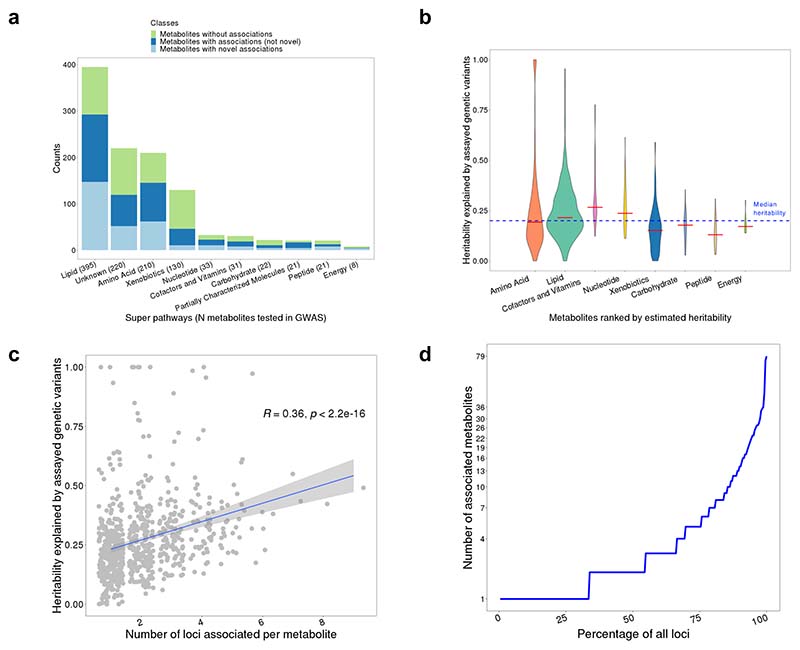
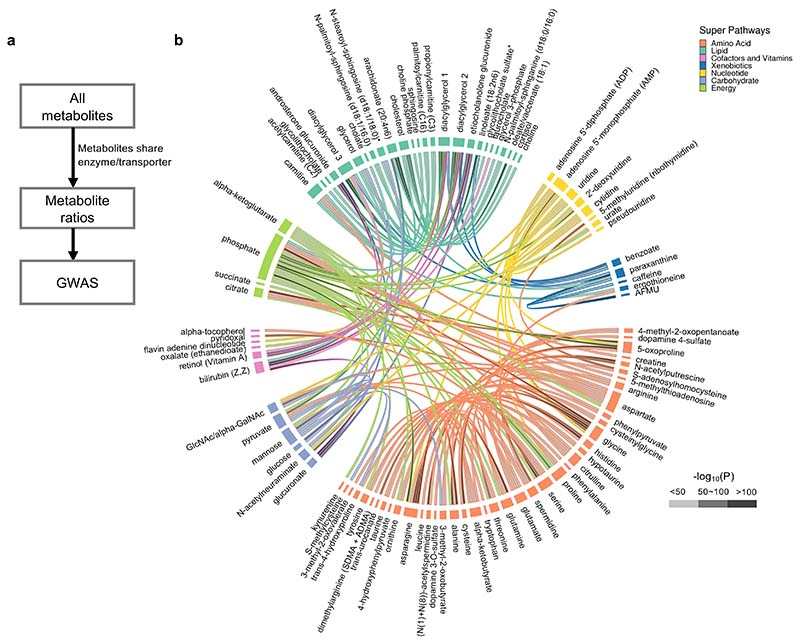
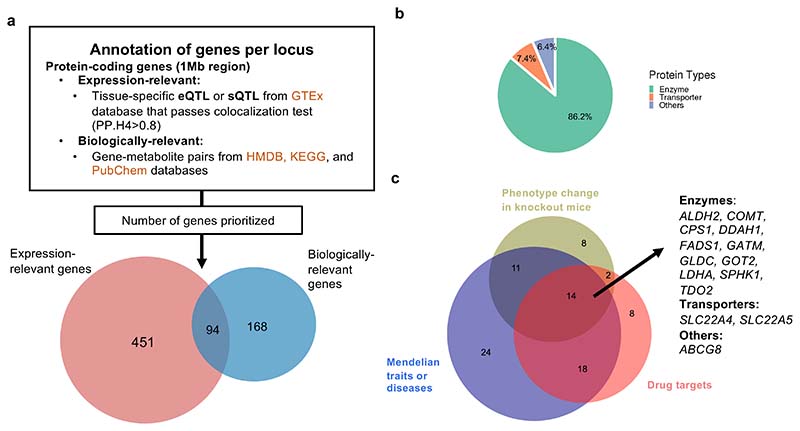
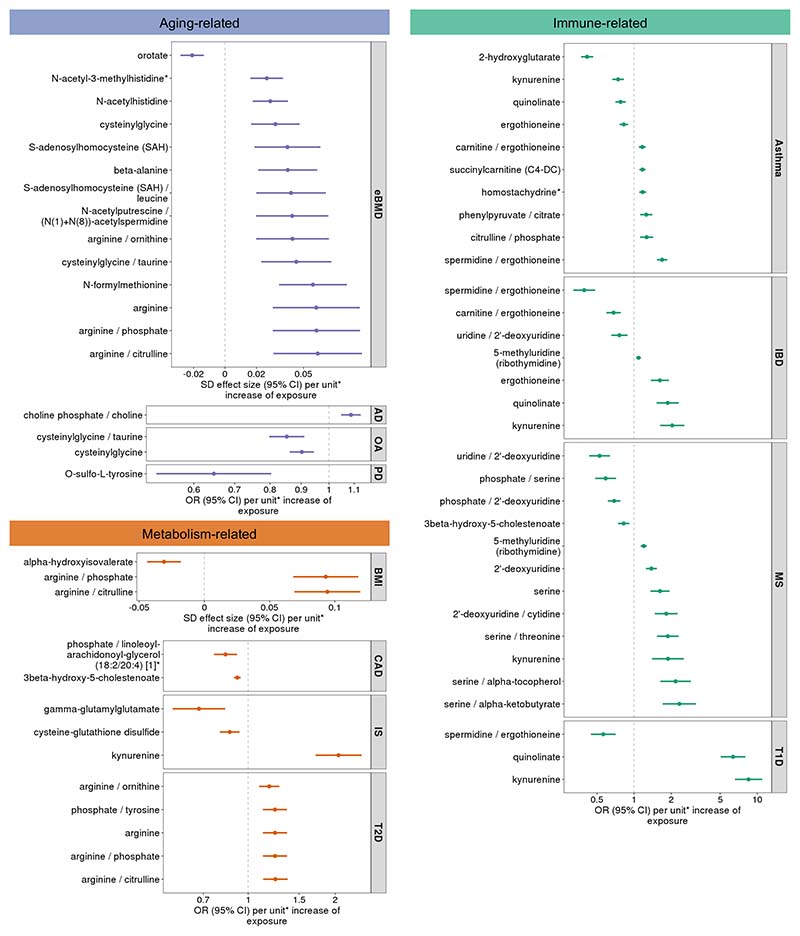
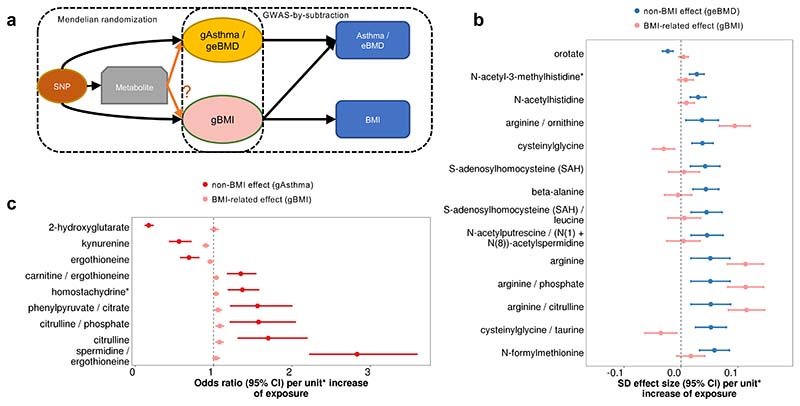
Metabolic processes can influence disease risk and provide therapeutic targets. By conducting genome-wide association studies of 1,091 blood metabolites and 309 metabolite ratios, we identified associations with 690 metabolites at 248 loci and associations with 143 metabolite ratios at 69 loci. Integrating metabolite-gene and gene expression information identified 94 effector genes for 109 metabolites and 48 metabolite ratios. Using Mendelian randomization (MR), we identified 22 metabolites and 20 metabolite ratios having estimated causal effect on 12 traits and diseases, including orotate for estimated bone mineral density, α-hydroxyisovalerate for body mass index and ergothioneine for inflammatory bowel disease and asthma. We further measured the orotate level in a separate cohort and demonstrated that, consistent with MR, orotate levels were positively associated with incident hip fractures. This study provides a valuable resource describing the genetic architecture of metabolites and delivers insights into their roles in common diseases, thereby offering opportunities for therapeutic targets.


Conflict of interest statement

Competing Interests JBR has served as an advisor to GlaxoSmithKline and Deerfield Capital. JBR’s institution has received investigator-initiated grant funding from Eli Lilly, GlaxoSmithKline and Biogen for projects unrelated to this research. JBR is the CEO of 5 Prime Sciences (http://www.5primesciences.com). TL and VF are employees of 5 Prime Sciences. YF consults for Fulcrum Genomics, 5 Prime Sciences, and Demetria. TN has received speaking fees from Boehringer Ingelheim and AstraZeneca. All other authors declare that there are no conflicts of interest. The opinions expressed in this manuscript are the authors’ own and do not reflect the views of the Canadian Longitudinal Study on Aging.

Figures

Figure 1
Figure 1. Summary of associations of metabolite levels and genetic loci.
A Manhattan plot displaying chromosomal positions (x axis) of significant associations (p < 6.85x10⁻¹⁰, accounting for multiple testing, y axis). Colors indicate metabolite super pathways. P values were obtained from genome-wide summary statistics from linear regression models using genetic variants as predictors and metabolite levels as outcomes. Effector genes identified for corresponding loci are annotated.
Figure 2
Figure 2. Genetic architecture of metabolite levels.
a, Classification of tested metabolites with or without genetic associations in each metabolite super pathway. “Metabolites with novel associations” include metabolites that have at least one novel association. “Metabolites with associations (not novel)” include metabolites that only have independent variant-metabolite associations that are known. b, Distribution of heritability explained by assayed genotypes for metabolites in each super pathway (red lines indicate the median heritability of metabolites in each super pathway and blue dashed line indicates the median heritability for all tested metabolites). c, Distribution of variant-based heritability of metabolites, compared to the number of associated loci. Each point represents a different metabolite. The Spearman’s correlation coefficient is shown. The exact p value (two-sided) for the correlation coefficient is 2.4x10⁻²². 95% confidence interval around linear regression line were plotted. d, Distribution of number of associated metabolites per locus, demonstrating the pleiotropy of genetic effects on metabolites.
Figure 3
Figure 3. Summary of metabolite ratio GWAS results.
a, Construction of metabolite ratios for GWAS. b, Super pathway membership of metabolite ratio pairs with GWAS associations. The color of the connection line indicates the super pathway of the first metabolite (numerator of the ratio) of the metabolite pair that constructs the metabolite ratios. The grey scale gradient filling the connection line indicates the strength of the genetic association with darker color indicating stronger significance. For figure generation, five metabolite names were shortened. N-acetylglucosamine/N-acetylgalactosamine, GlcNAc/alpha-GalNAc; linoleoyl-arachidonoyl-glycerol (18:2/20:4) [1]*, diacylglycerol 1; linoleoyl-arachidonoyl-glycerol (18:2/20:4) [2]*, diacylglycerol 2; oleoyl-linoleoylglycerol (18:1/18:2) [2], diacylglycerol 3; 5-acetylamino-6-formylamino-3-methyluracil, AFMU.
Figure 4
Figure 4. Assignment of effector genes by using evidence from gene expression and biological knowledge.
a, Identification of effector genes. b, Classification of the 94 effector genes with strong expression and biological evidence by protein types. c, Evidence from drug targets, phenotypic changes observed in murine knockouts, and associated Mendelian traits or diseases for the 94 effector genes.
Figure 5
Figure 5. Forest plots showing effects (beta or OR estimates) and 95% confidence intervals from two-sample MR analyses.
Metabolites and metabolite ratios that have an estimated causal effect (with Bonferroni-corrected p < 0.05) and pass pleiotropy and reverse causation evaluations for twelve traits and diseases. MR estimates and p-values were calculated using inverse-variance weighted random effects test for instruments that contained more than one variant and Wald ratio test for instruments with one variant. *Metabolite unit: 1 standard deviation (SD) of log-normalized values. Metabolite ratio unit: 1 SD of inverse rank normalized values. Abbreviations: estimated bone mineral density (eBMD), Alzheimer’s disease (AD), osteoarthritis (OA), Parkinson’s disease (PD), body mass index (BMI), coronary artery disease (CAD), ischemic stroke (IS), type 2 diabetes (T2D), inflammatory bowel disease (IBD), multiple sclerosis (MS), type 1 diabetes (T1D). Specific sample sizes for each metabolite and trait can be found in Supplementary Tables 5, 11 and 16.
Figure 6
Figure 6. Comparison of estimated BMI-related and non-BMI effects on eBMD and Asthma.
a, Illustration of GWAS-by-subtraction models. b, Two-sample MR results showing the non-BMI (geBMD) and BMI-related (gBMI) effects (beta estimates) of MR prioritized metabolites and ratios for eBMD c, Two-sample MR results showing the non-BMI (gAsthma) and BMI-related (gBMI) effects (OR and beta estimates, respectively) of MR prioritized metabolites and ratios for asthma risk. *Metabolite unit: 1 SD of log-normalized values. Metabolite ratio unit: 1 SD of inverse normalized values. Specific sample sizes for each metabolite and trait can be found in Supplementary Tables 5, 11 and 16.

References

    1. Bar N, et al. A reference map of potential determinants for the human serum metabolome. Nature. 2020;588 - PubMed
    1. Lee W-J, Hase K. Gut microbiota–generated metabolites in animal health and disease. Nat Chem Biol. 2014;10:416–424. - PubMed
    1. Pietzner M, et al. Plasma metabolites to profile pathways in noncommunicable disease multimorbidity. Nat Med. 2021;27:471–479. - PMC - PubMed
    1. Wishart DS. Emerging applications of metabolomics in drug discovery and precision medicine. Nat Rev Drug Discov. 2016;15 - PubMed
    1. Long T, et al. Whole-genome sequencing identifies common-to-rare variants associated with human blood metabolites. Nat Genet. 2017;49 - PubMed

Publication types