. 2023 Feb;55(2):346-354.
doi: 10.1038/s41588-022-01278-7. Epub 2023 Jan 12.

A single-cell massively parallel reporter assay detects cell-type-specific gene regulation

Affiliations

A single-cell massively parallel reporter assay detects cell-type-specific gene regulation

Siqi Zhao et al. Nat Genet. 2023 Feb.

Abstract

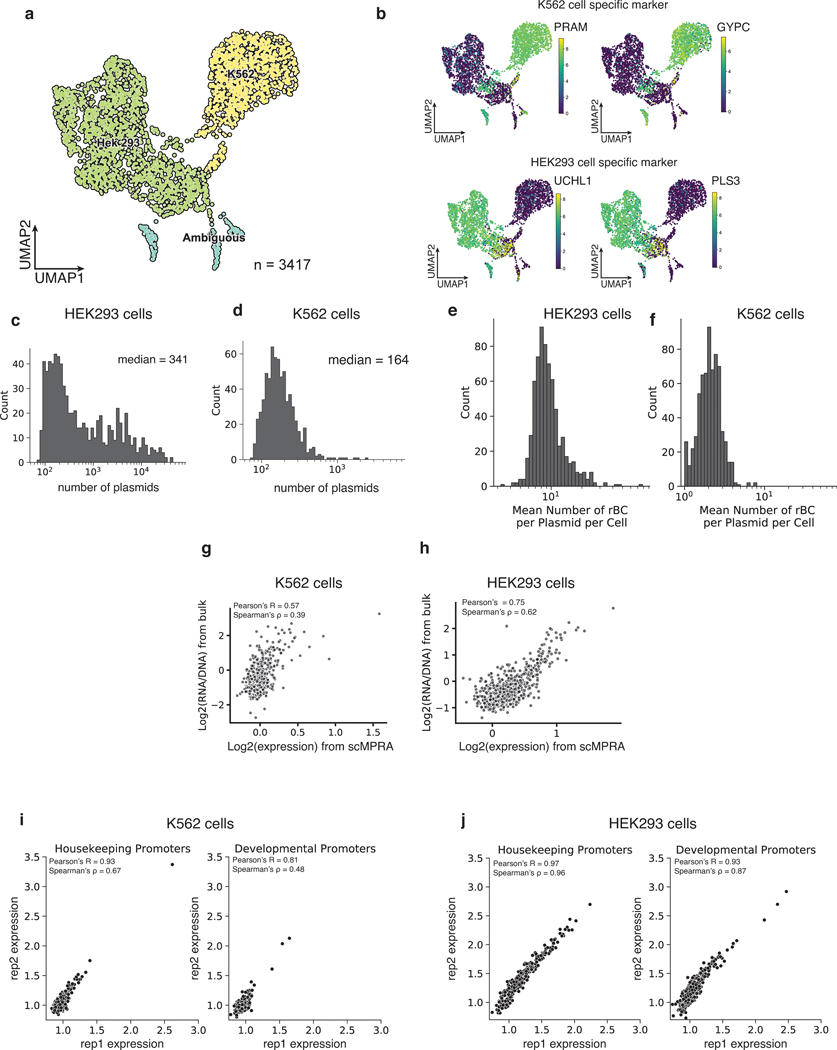
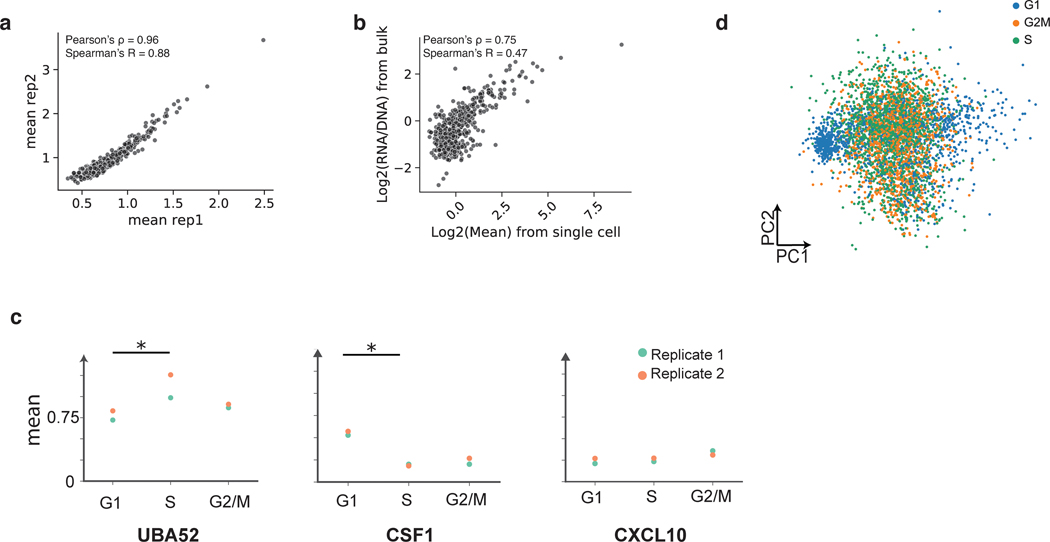
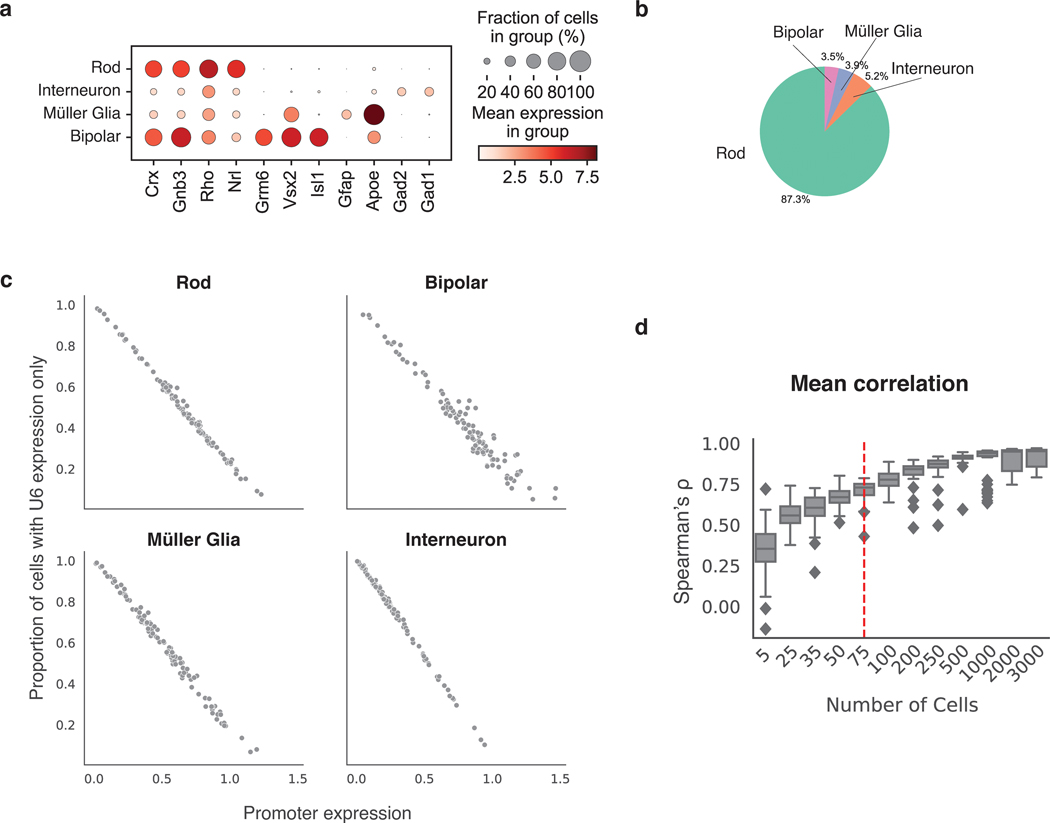
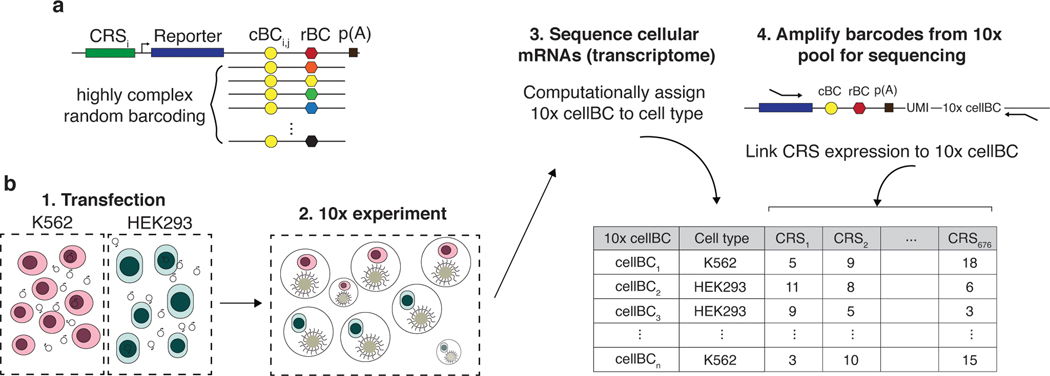
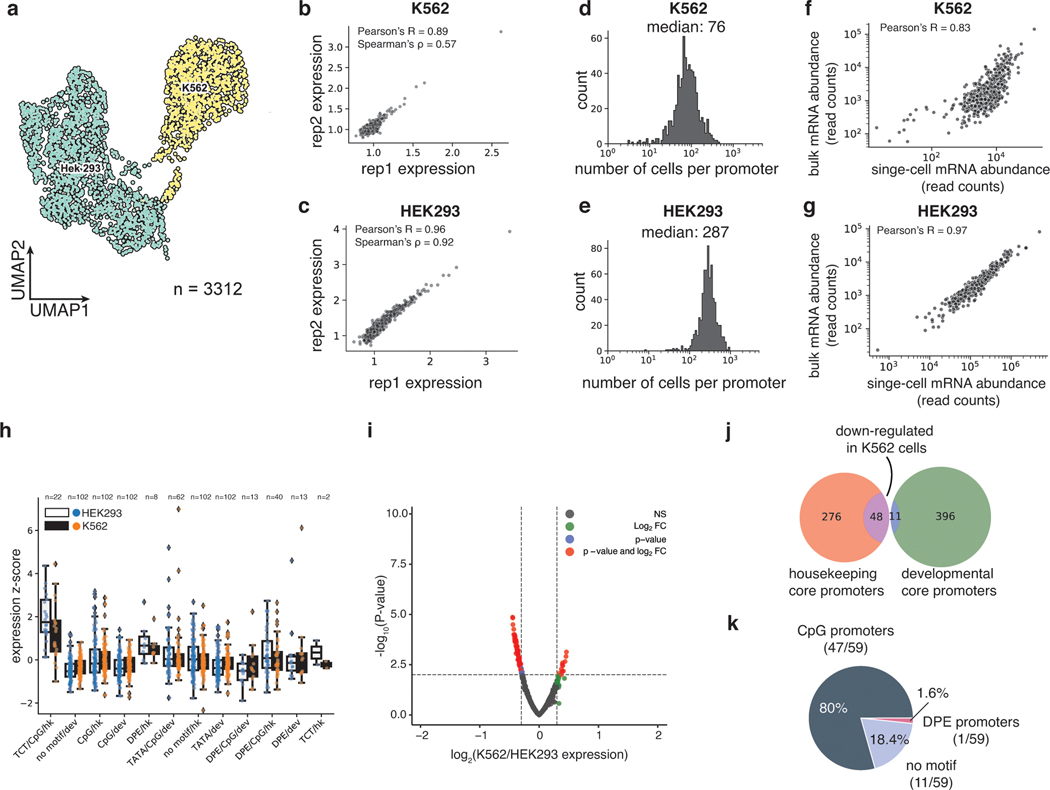
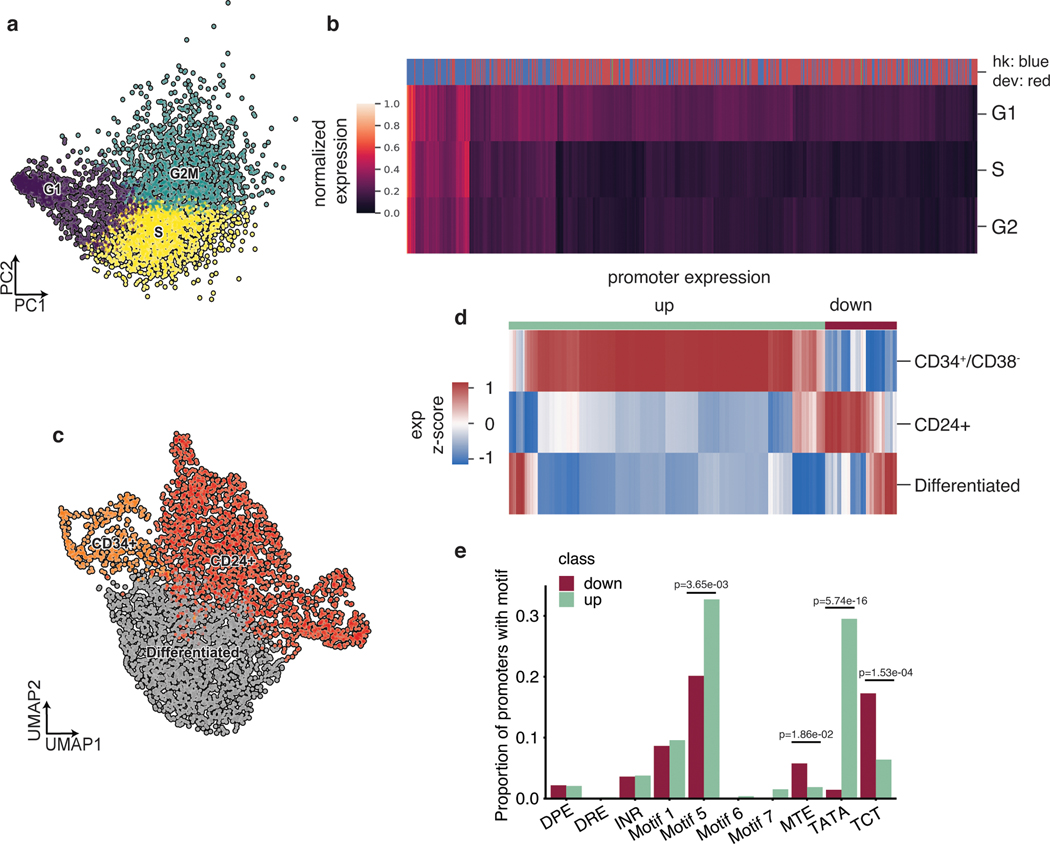
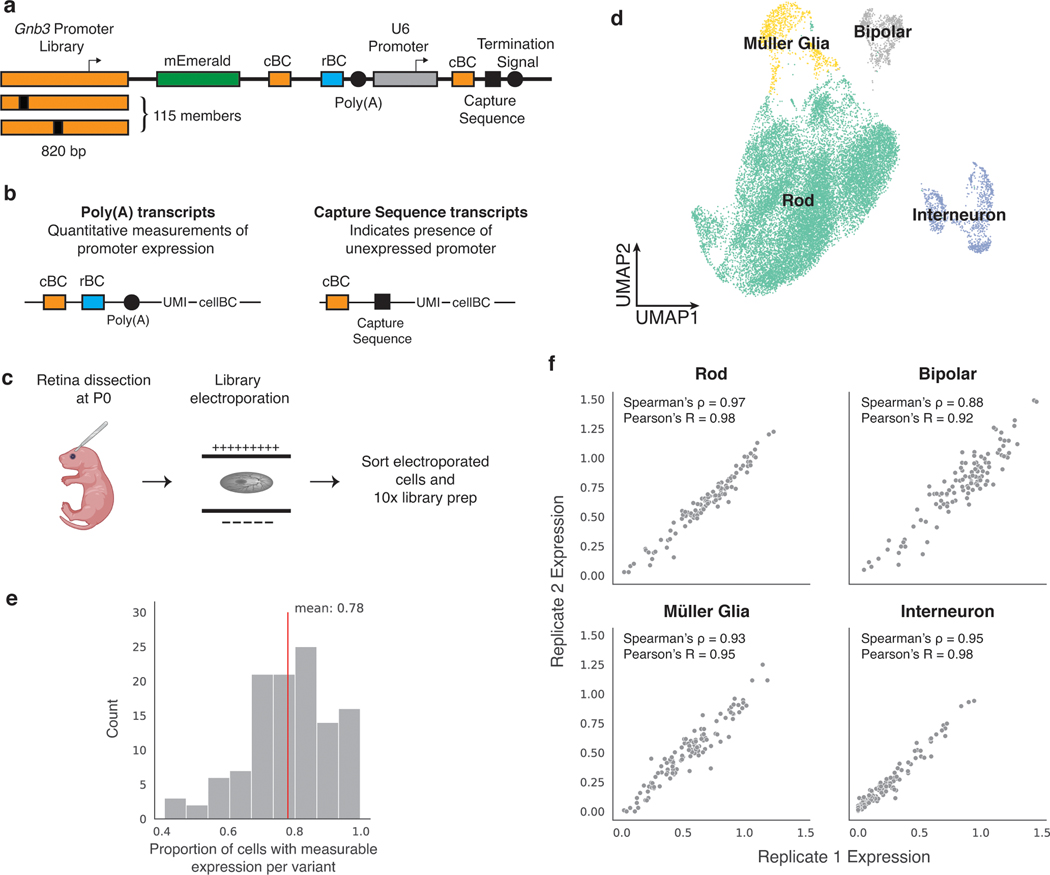
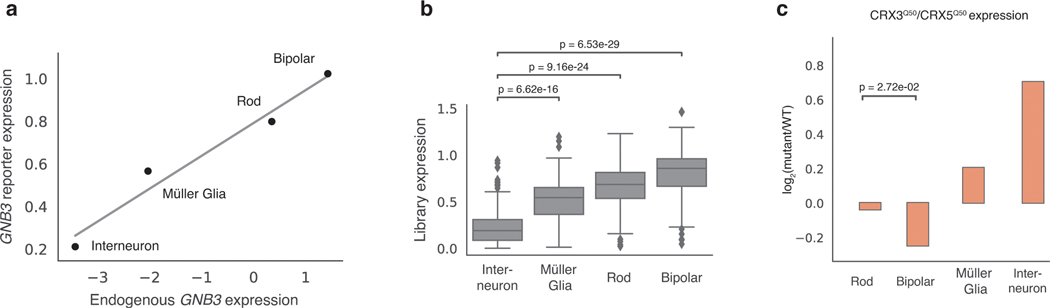
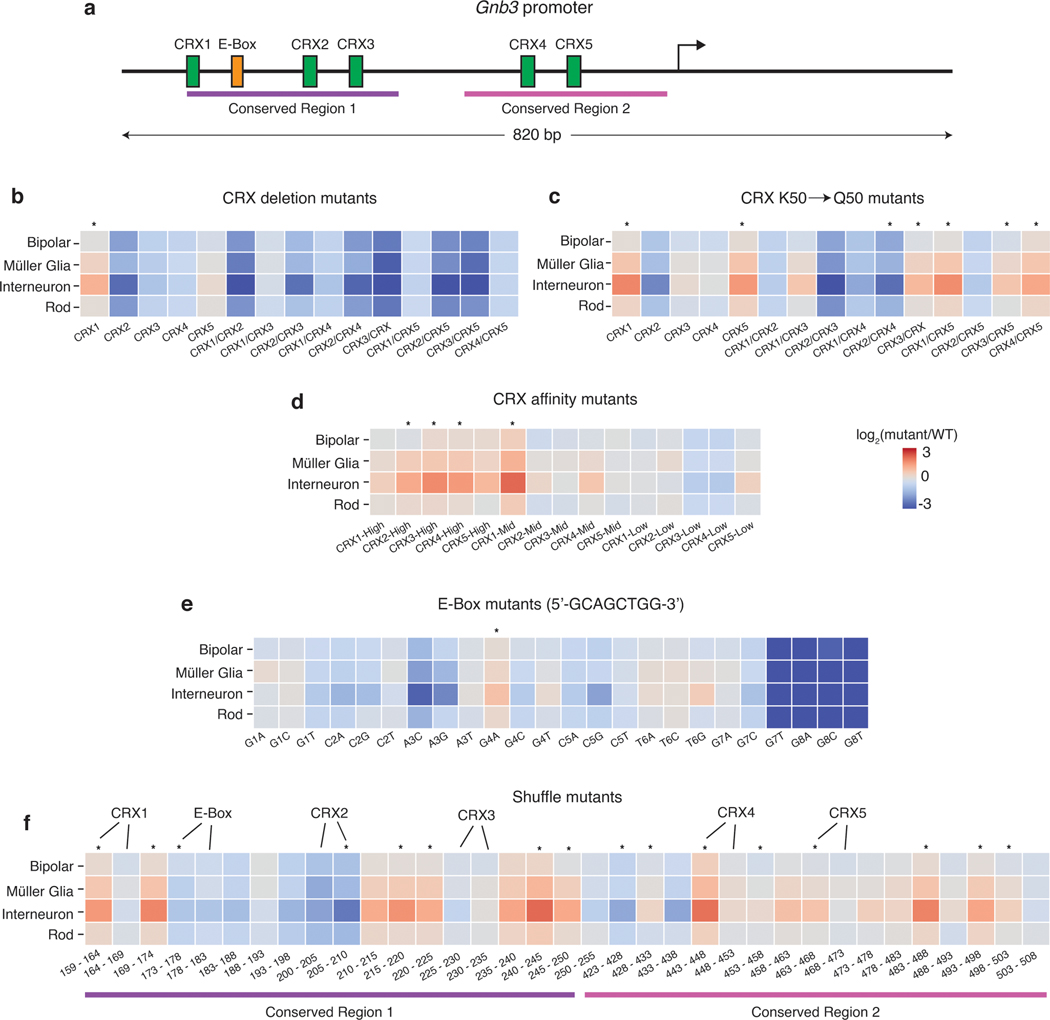
Massively parallel reporter gene assays are key tools in regulatory genomics but cannot be used to identify cell-type-specific regulatory elements without performing assays serially across different cell types. To address this problem, we developed a single-cell massively parallel reporter assay (scMPRA) to measure the activity of libraries of cis-regulatory sequences (CRSs) across multiple cell types simultaneously. We assayed a library of core promoters in a mixture of HEK293 and K562 cells and showed that scMPRA is a reproducible, highly parallel, single-cell reporter gene assay that detects cell-type-specific cis-regulatory activity. We then measured a library of promoter variants across multiple cell types in live mouse retinas and showed that subtle genetic variants can produce cell-type-specific effects on cis-regulatory activity. We anticipate that scMPRA will be widely applicable for studying the role of CRSs across diverse cell types.


Figures

Extended Data Fig. 1
Extended Data Fig. 1. scMPRA measures cell-type specific CRS activity
(a) UMAP of the single-cell transcriptome from the mixed-cell experiment. 105 out of 3417 cells (3%) are labeled by both K562 and HEK293 cell genes. (b) UMAP of the mixed-cell experiment with cells marked by other representative markers for K562 and HEK293 cell expression. (c,d) Histogram of the number of plasmids (unique cBC-rBC pairs) transfected into K562 cells and HEK293 cells. (e,f) Histogram of the mean number of rBC per cBC (CRS) per cell for K562 cells and HEK293 cells. (g,h) Correlation of bulk MPRA versus scMPRA where only the scMPRA data has been UMI normalized (i,j) Scatterplot of scMPRA reproducibility for housekeeping and developmental promoters in K562 cells and HEK293 cells.
Extended Data Fig. 2
Extended Data Fig. 2. scMPRA measures CRS activity in K562 cell substates
(a) Reproducibility for mean expression of core promoters in K562 cells. (b) Correlation of bulk and scMPRA (non-UMI corrected) in K562 cells (c) Different dynamics of expression. For UBA52, the promoter is most highly expressed in S phase, whereas for CSF1, the promoter is most highly expressed in G1 phase. For CXCL10, the promoter is expressed evenly through cell cycle (Stars indicate significance from two-sided Wilcoxon rank sum test, *: p < 0.05) (d) Cells no longer cluster together based on cell cycle genes after the effects of the cell cycle are removed.
Extended Data Fig. 3
Extended Data Fig. 3. Robust measurements of Gnb3 promoter library in ex vivo retina
(a) Expression of marker genes by scRNA-seq used to identify cell types in the retina. (b) Percentage of the total cells recovered represented by each retinal cell type. (c) Plot showing the relationship between the mean activity of a Gnb3 promoter variant in a given cell type (x-axis) and the proportion of cells in which that promoter variant is silent (y-axis). Individual cells in which a given Gnb3 variant is silent are identified as cells with U6-expressed cBC, but no Gnb3-expressed cBC. (d) The correlation between biological replicates (n=2) is plotted as a function of the number of cells used in the analysis. The bounds of the box represent the upper and lower quartiles respectively, and the center line represents the median. The whiskers extend to the maxima/minima except for points determined to be outliers using a method that is a function of the interquartile range.
Fig. 1.
Fig. 1.. scMPRA measures CRS at single-cell resolution.
(a) Each CRS reporter construct is barcoded with a cBC that specifies the identity of the CRS, and a highly complex rBC. The complexity of the cBC-rBC pair ensures that the probability of identical plasmids being introduced into the same cell is extremely low. (b) Experimental overview for scMPRA using the mixed-cell experiment as an example. K562 cells and HEK293 cells are transfected with the double-barcoded core promoter library. After 24 hours, cells were harvested and mixed for 10x scRNA-seq. Cell identities were obtained by sequencing the transcriptome, and single-cell expression of CRSs were obtained by quantifying the barcodes. The cell identity and CRSs expression (as measured by the cBC-rBC abundances) were linked by the shared 10x cell barcodes.
Fig. 2.
Fig. 2.. scMPRA detects cell type specific CRS activity.
(a) UMAP of the transcriptome from the mixed-cell scMPRA experiment. 3312 out of 3417 cells are assigned to either K562 or HEK293 cells and visualised here. (b,c) Reproducibility of replicate measurements of the mean expression from each core promoter in both K562 and HEK293 cells. (d,e) Histogram of the number of cells in which each core promoter was measured for HEK293 and K562 cells. (f,g) Correlations between scMPRA and bulk MPRA using mRNA abundances (cBC counts per cell) to make the two methods comparable. (h) Boxplot of the activities of core promoters from different categories in K562 (orange) and HEK293 (blue) cells. The promoter categories are taken from Haberle et al.. Because the average expression of all promoters were different between K562 and HEK293, we plotted each category according to its deviation from the average expression (z-score) of all promoters in each cell type. (i) Volcano plot for differential expression (DE) of core promoters in K562 and HEK293 cells. Red dots represent significantly DE reporters (two-sided Wald test adjusted p-value <0.01 and log2-fold change greater than 0.3). (j) Venn diagram of the functional characterization (housekeeping vs developmental) of down-regulated core promoters in K562 cells. Housekeeping promoters are enriched (p-value = 1.08×10⁻¹¹ from two-sided hypergeometric test). (k) Pie chart of the sequence features (CpG, DPE, TATA) of down-regulated core promoters. CpG promoters are enriched (p=2.18×10⁻⁶, two-sided hypergeometric test).
Fig. 3.
Fig. 3.. scMPRA detects sub-state-specific CRS activity.
(a) PCA plot of K562 cells (n = 4041) classified by their cell cycle scores. (b) Heatmap of core promoter activities in different cell cycle phases (Color bar indicates housekeeping (blue) vs developmental (red) promoters). Core promoter activities have been normalized within each cell cycle phase to highlight the differences between housekeeping and developmental promoters. (c) UMAP embedding of K562 cells with high proliferation (CD34+/CD38 and CD24+) and undifferentiated substates. (d) Hierarchical clustering showing two clusters (“up” and “down”) based on expression patterns in the three substates. The promoter (n = 672) activities are plotted as their z-score from the average across cell states to highlight the difference between cell states. (e) Proportion of promoters in the up and down clusters that contain the indicated core promoter motif. Significant p-values from a two-sided Fisher’s exact test are shown.
Fig. 4.
Fig. 4.. scMPRA design and workflow in mouse retina.
(a) Schematic of Gnb3 promoter library constructs. In addition to the cBC and rBC barcodes, the Gnb3 promoter library contains an additional cassette in which the constitutive U6 promoter expresses a second copy of the cBC with a capture sequence for isolating these transcripts on gel beads. (b) Two different types of transcripts produced from the Gnb3 promoter library to measure promoter expression and detect unexpressed promoters respectively. The two types of transcripts originating from the same cell share the same 10x cell barcodes (c) Experimental workflow for scMPRA in ex vivo mouse retinas. (d) UMAP of all cells (n = 22161) measured in scMPRA with four major cell types identified. (e) For each Gnb3 variant in the library, we determined the proportion of cells that contain barcoded poly(A) transcripts out of all the cells that contained the variant. (f) Reproducibility of promoter activities between biological replicates in each of the four major cell types (all 115 promoters were detected in every cell type).
Fig. 5.
Fig. 5.. scMPRA recapitulates Gnb3 expression patterns.
(a) The expression of the wild-type Gnb3 promoter in scMPRA reflects endogen]ous expression levels of Gnb3 in the respective cell types. The solid line represents the best fit linear regression. (b) The expression of the entire Gnb3 library (n=115 variants) in different cell types also follows endogenous Gnb3 expression (****: p-value < 0.0001, two-sided Mann-Whitney U test). (c) scMPRA recapitulates the effects of a known Gnb3 variant, where the CRX3Q50/CRX5Q50 variant reduces expression in bipolar cells specifically (*: p-value < 0.05, two-sided Welch’s t-test). All expression values are plotted as the mean of two biological replicates.
Fig. 6.
Fig. 6.. Mutations in the Gnb3 promoter display cell-type specific effects.
(a) Schematic of the Gnb3 promoter showing the location of the five CRX binding sites and the E-box. (b) Effects of individual and pairwise deletions of CRX binding sites. (c) Effects of individual and pairwise mutations of CRX K50 binding sites to Q50 binding sites. (d) Effects of changing CRX binding site affinities. (e) Effects of saturation mutagenesis of the E-box. (f) Effects of shuffle mutants in conserved regions of the Gnb3 promoter. Each region was split into 5bp windows and the nucleotides in each window were shuffled. Labels above the heatmap indicate locations where the mutations impact CRX or E-box binding sites. All plots show log2 fold changes of the mutant relative to WT Gnb3 expression in that cell type. Stars above the plot indicate a significant cell-type specific effect (p-value < 0.01) calculated by a one-way ANOVA using replicate measurements for each promoter without correction for multiple tests.

Comment in

References

    1. Schaub MA, Boyle AP, Kundaje A, Batzoglou S. & Snyder M. Linking disease associations with regulatory information in the human genome. Genome Res. 22, 1748–1759 (2012). - PMC - PubMed
    1. Maurano MT et al. Systematic localization of common disease-associated variation in regulatory DNA. Science 337, 1190–1195 (2012). - PMC - PubMed
    1. Hindorff LA et al. Potential etiologic and functional implications of genome-wide association loci for human diseases and traits. Proc. Natl. Acad. Sci. U. S. A. 106, 9362–9367 (2009). - PMC - PubMed
    1. Yang J. et al. Common SNPs explain a large proportion of the heritability for human height. Nat. Genet. 42, 565–569 (2010). - PMC - PubMed
    1. Vattikuti S, Guo J. & Chow CC Heritability and genetic correlations explained by common SNPs for metabolic syndrome traits. PLoS Genet. 8, e1002637 (2012). - PMC - PubMed

Publication types