. 2023 Feb;55(2):209-220.
doi: 10.1038/s41588-022-01276-9. Epub 2023 Jan 12.

Comprehensive multi-omic profiling of somatic mutations in malformations of cortical development

Collaborators, Affiliations

Comprehensive multi-omic profiling of somatic mutations in malformations of cortical development

Changuk Chung et al. Nat Genet. 2023 Feb.

Abstract

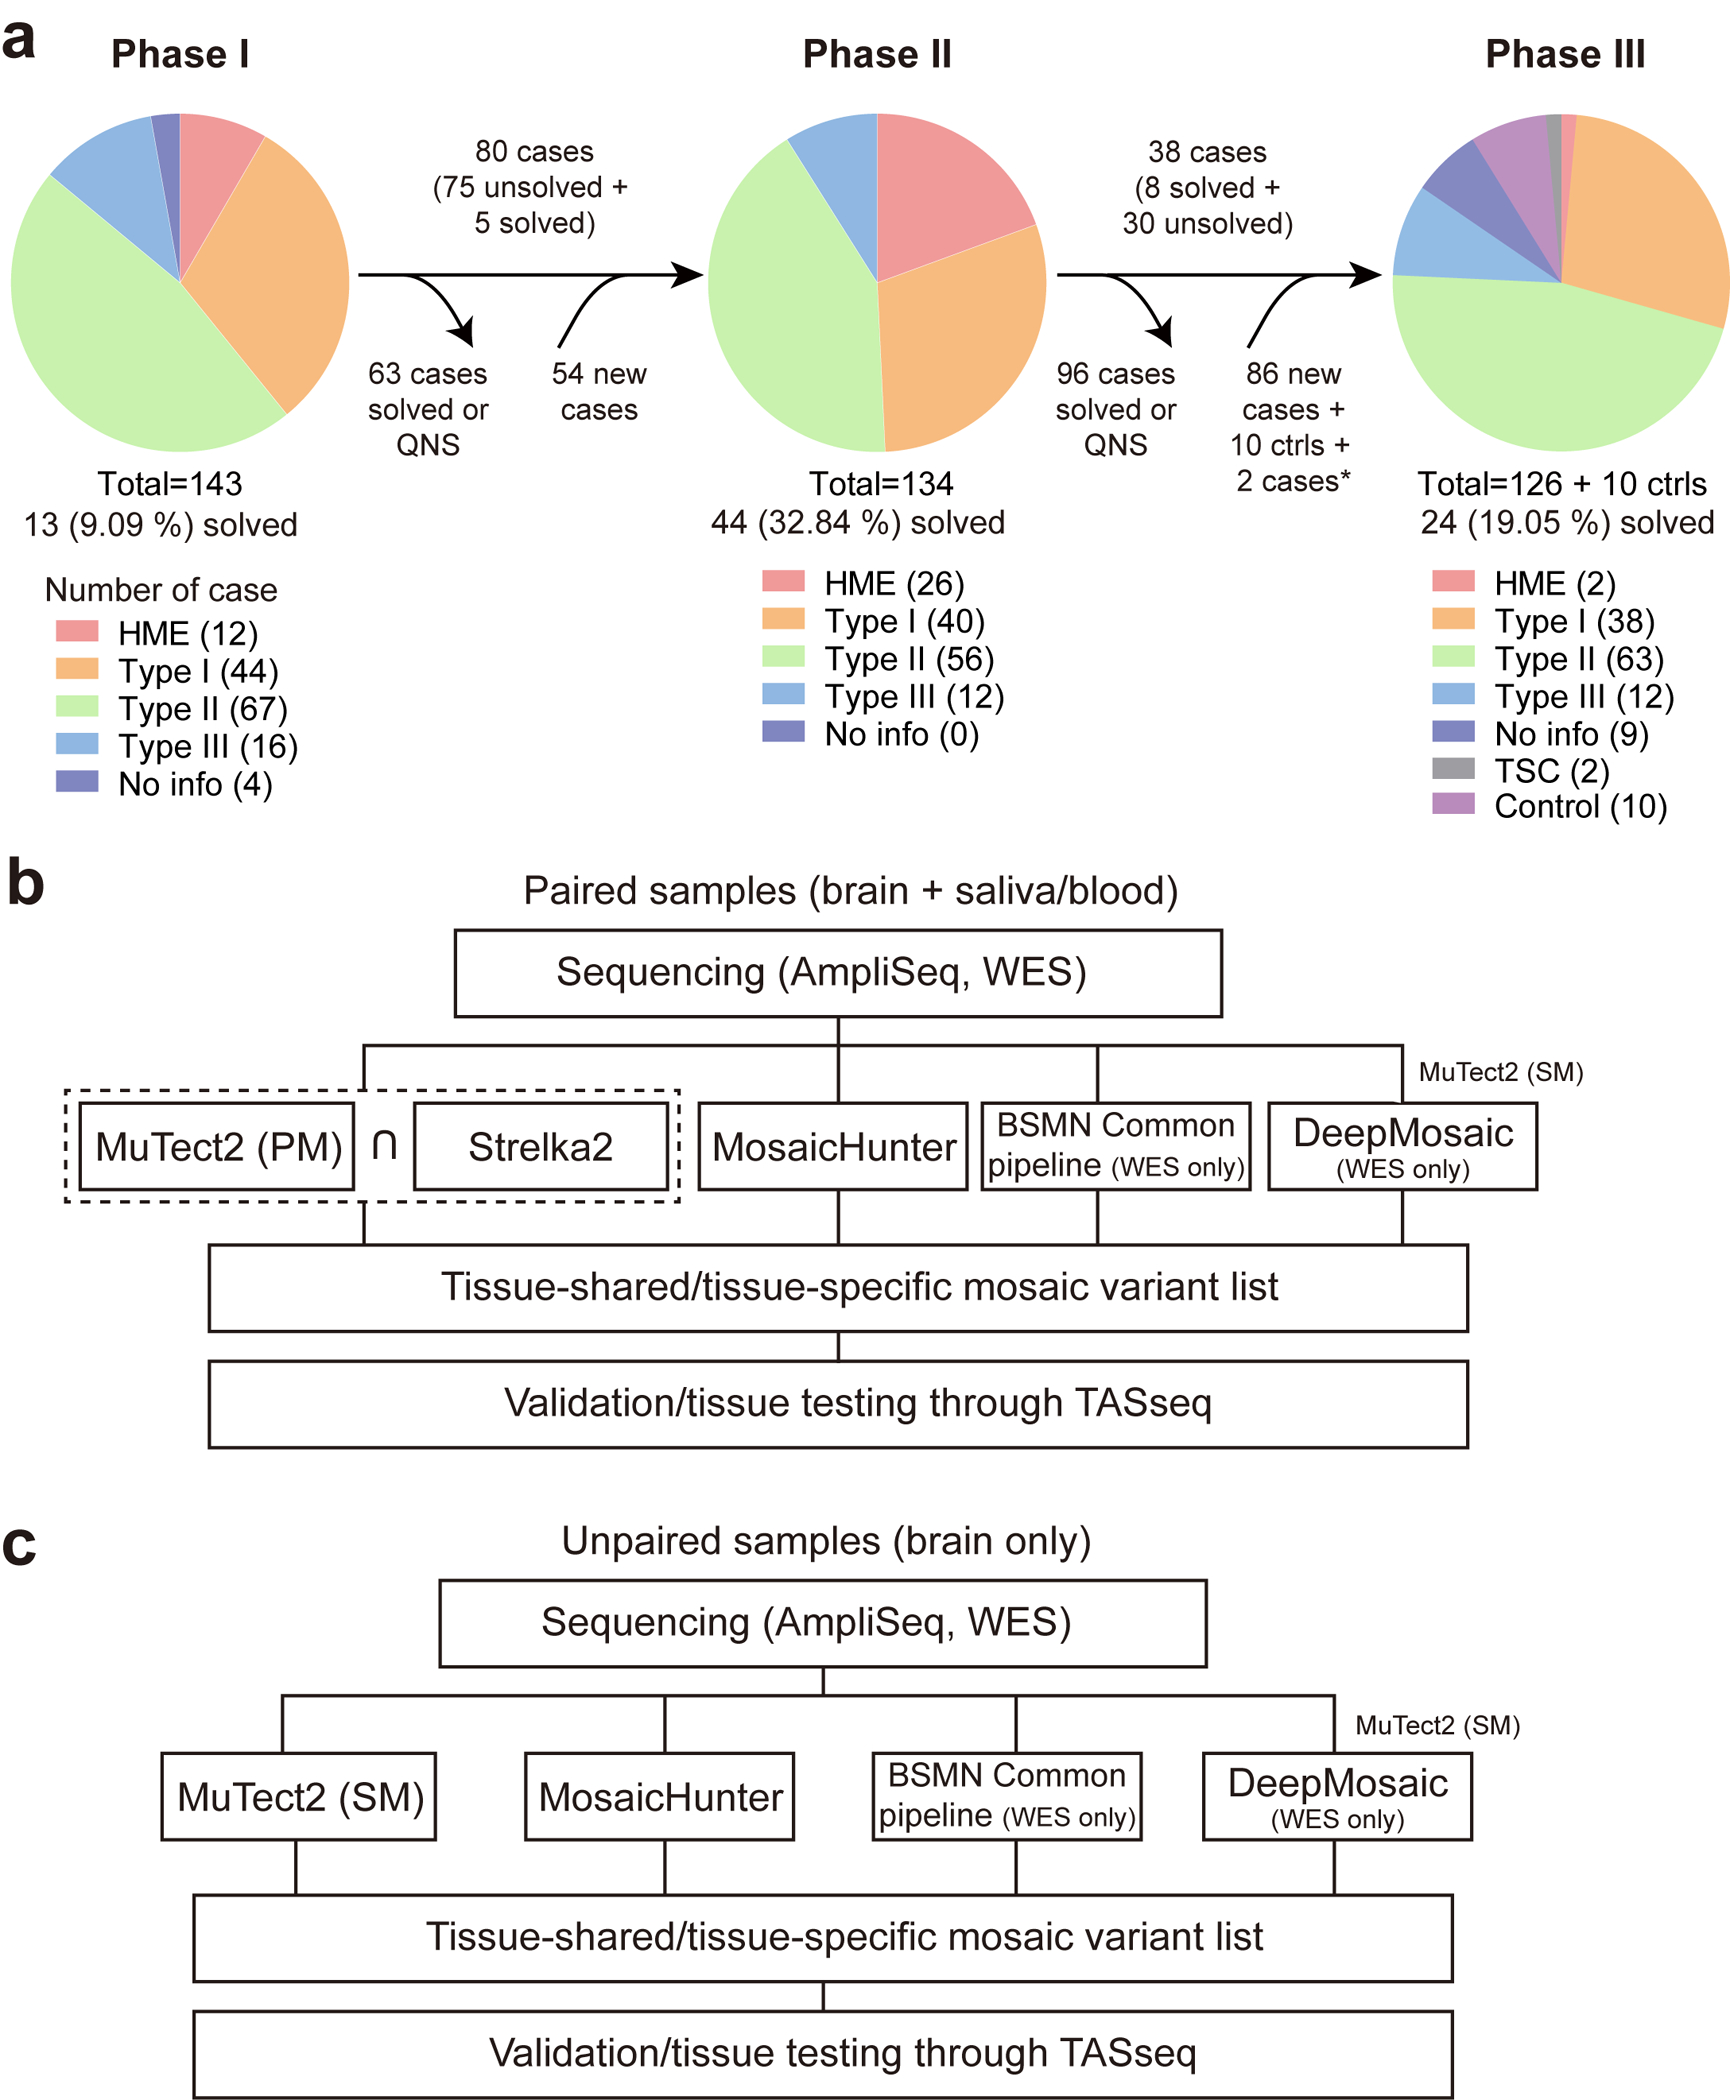
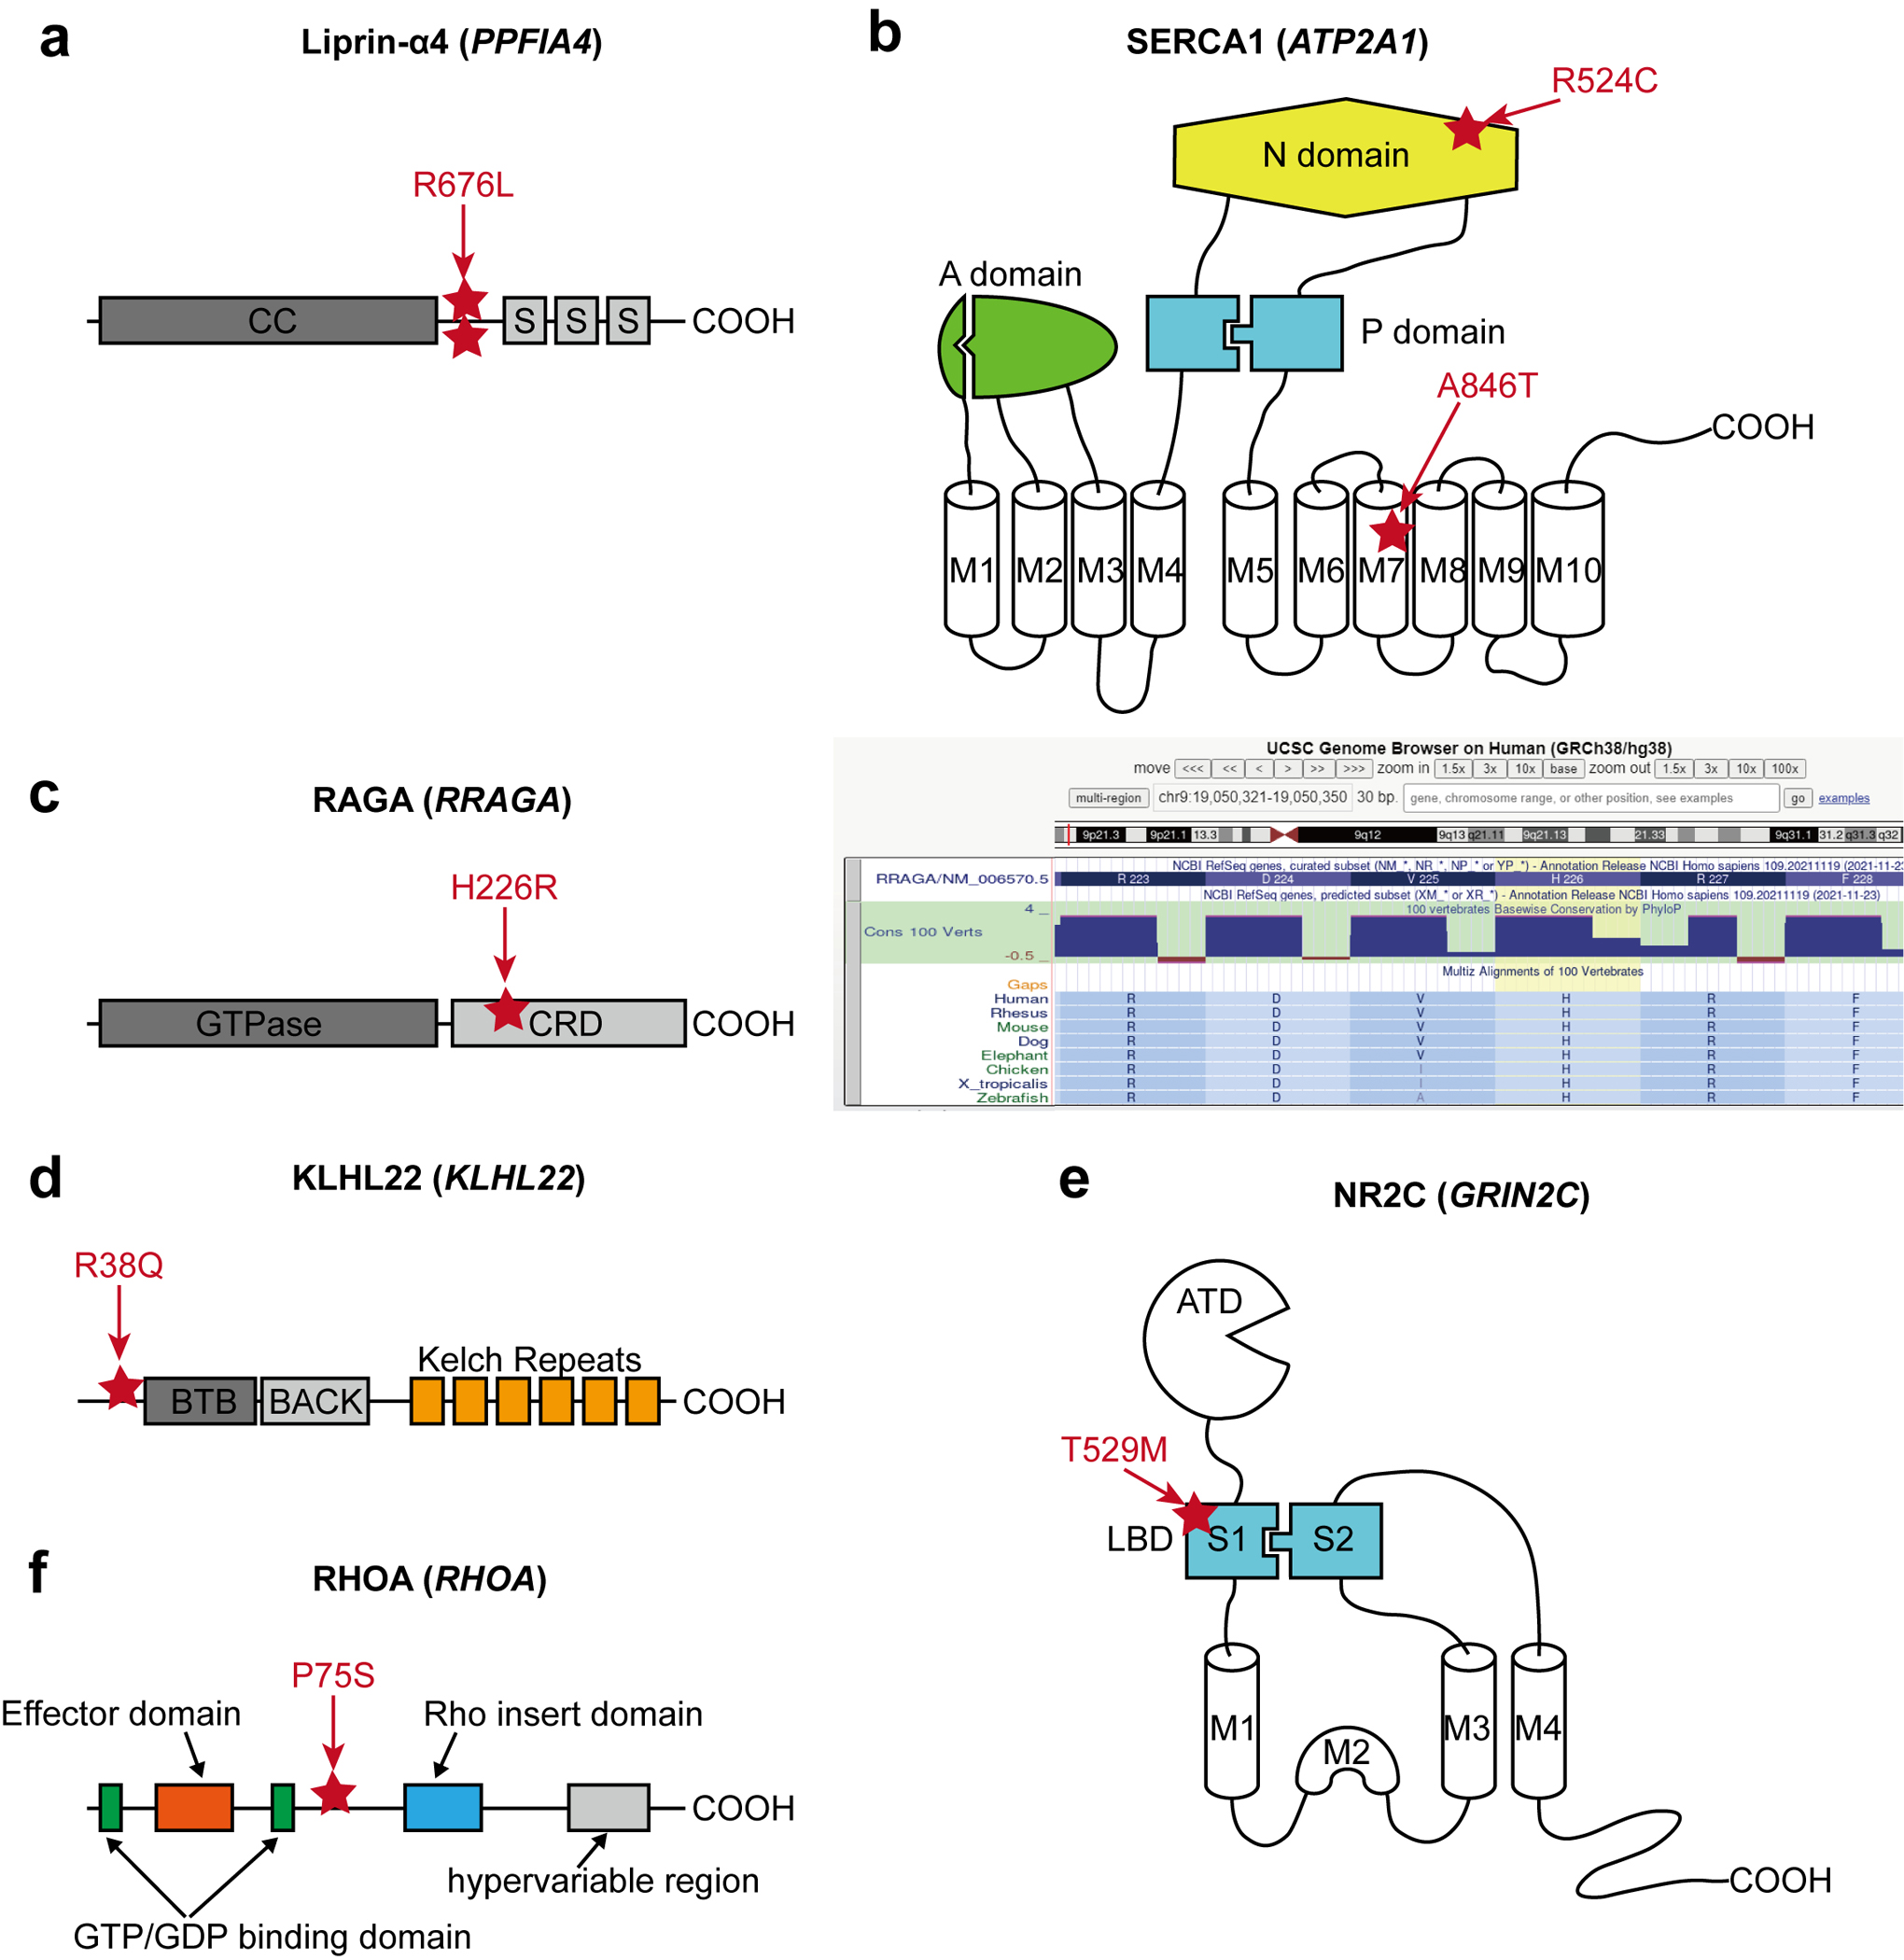
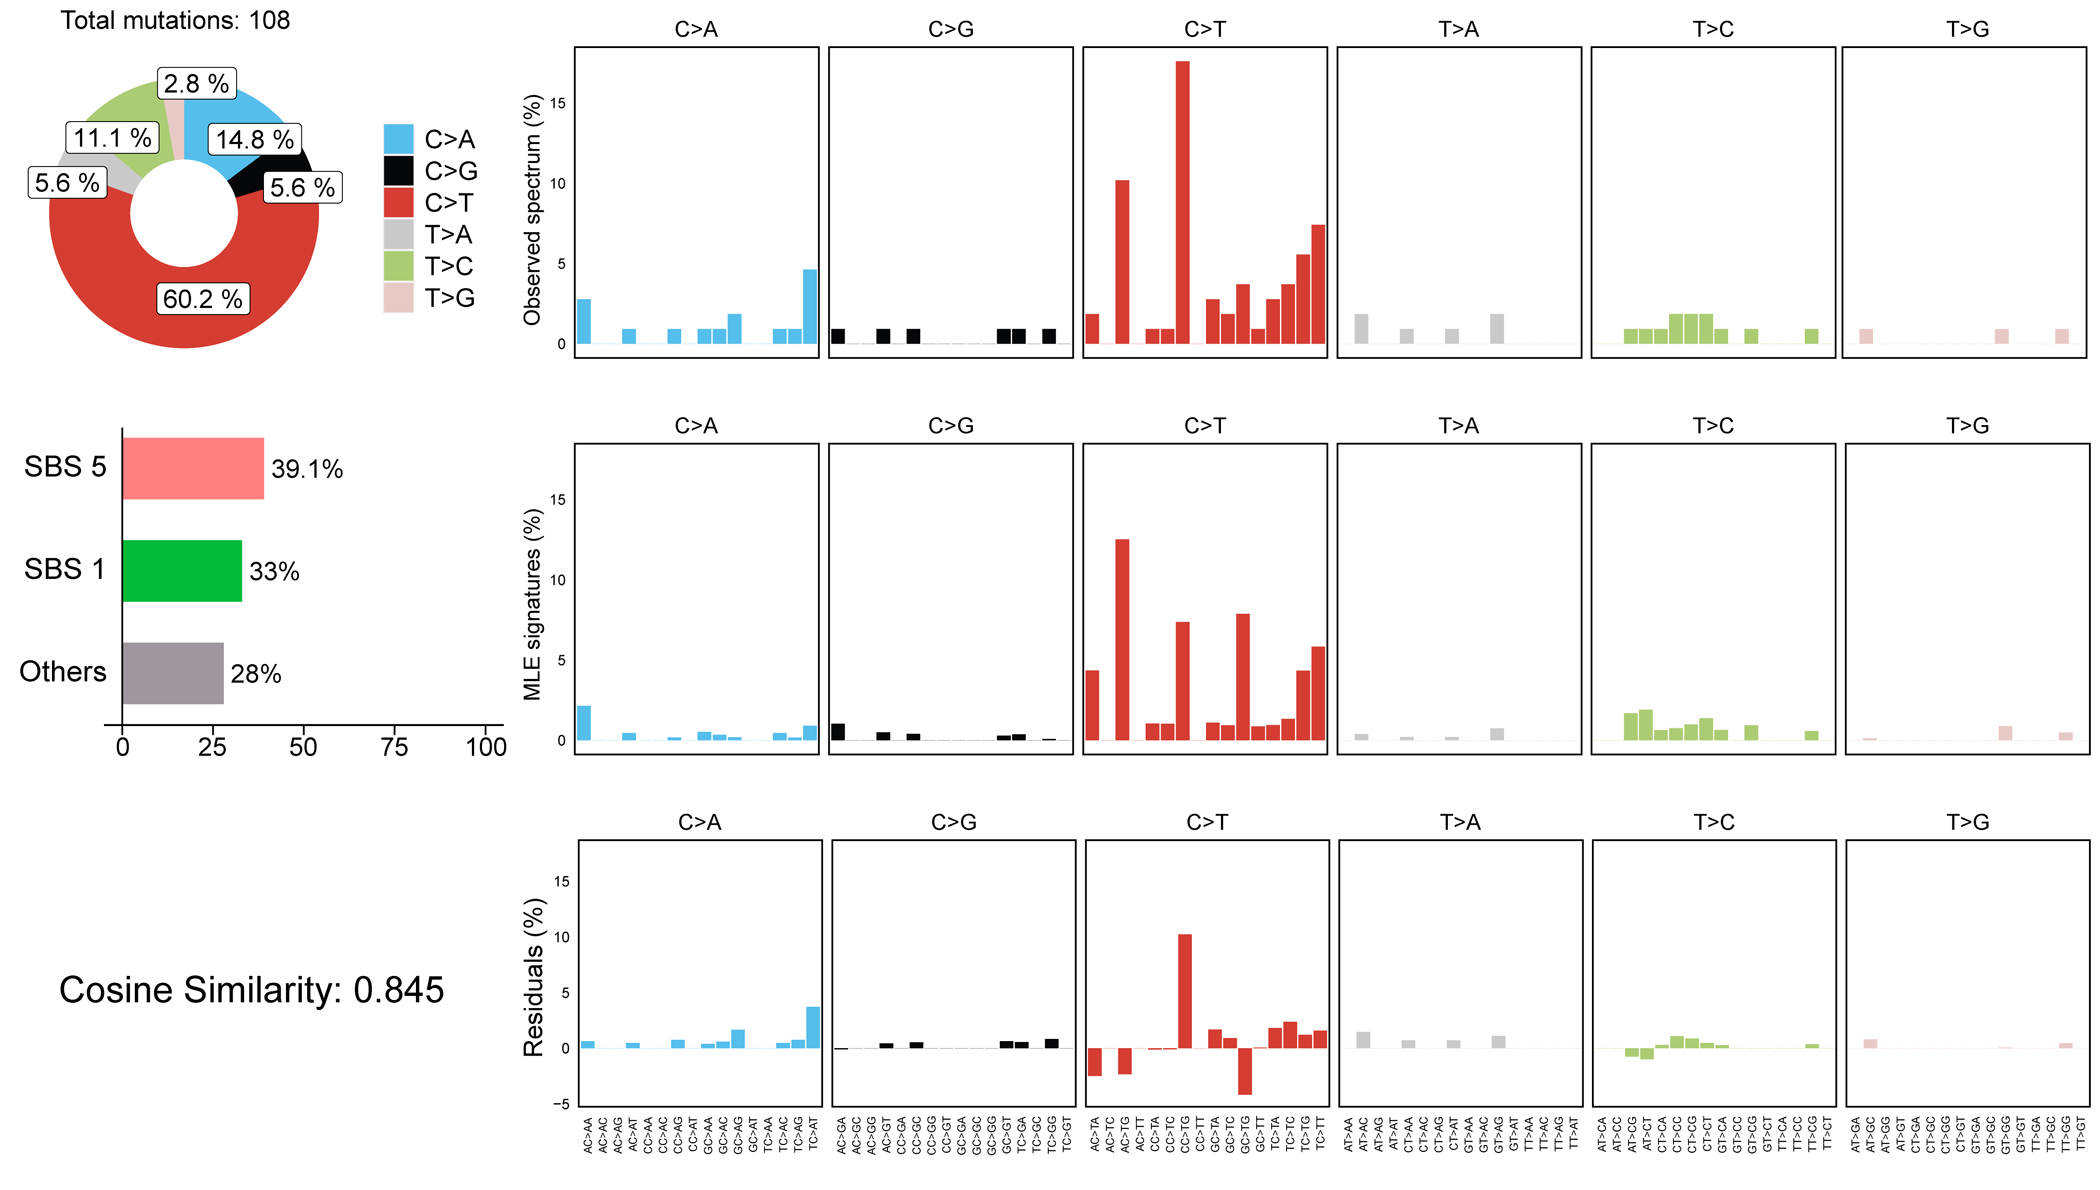
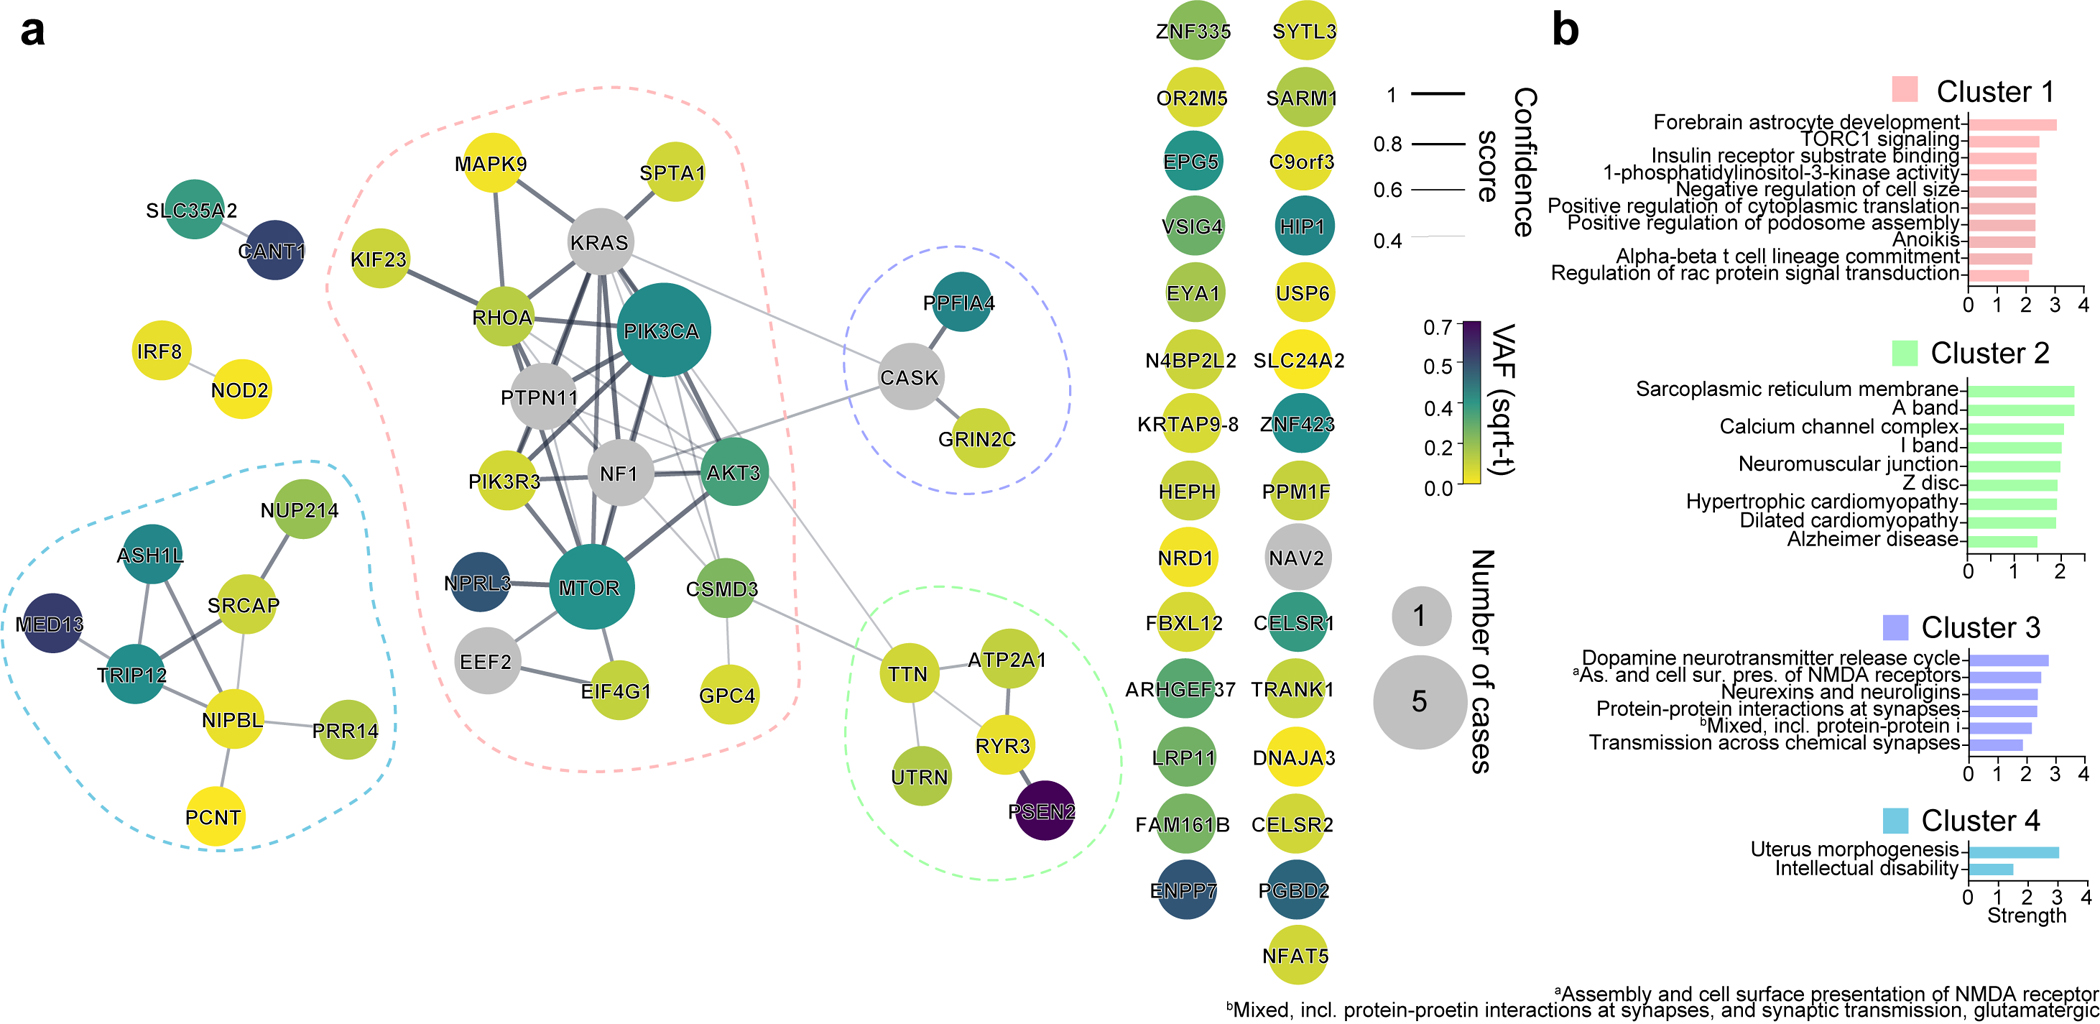
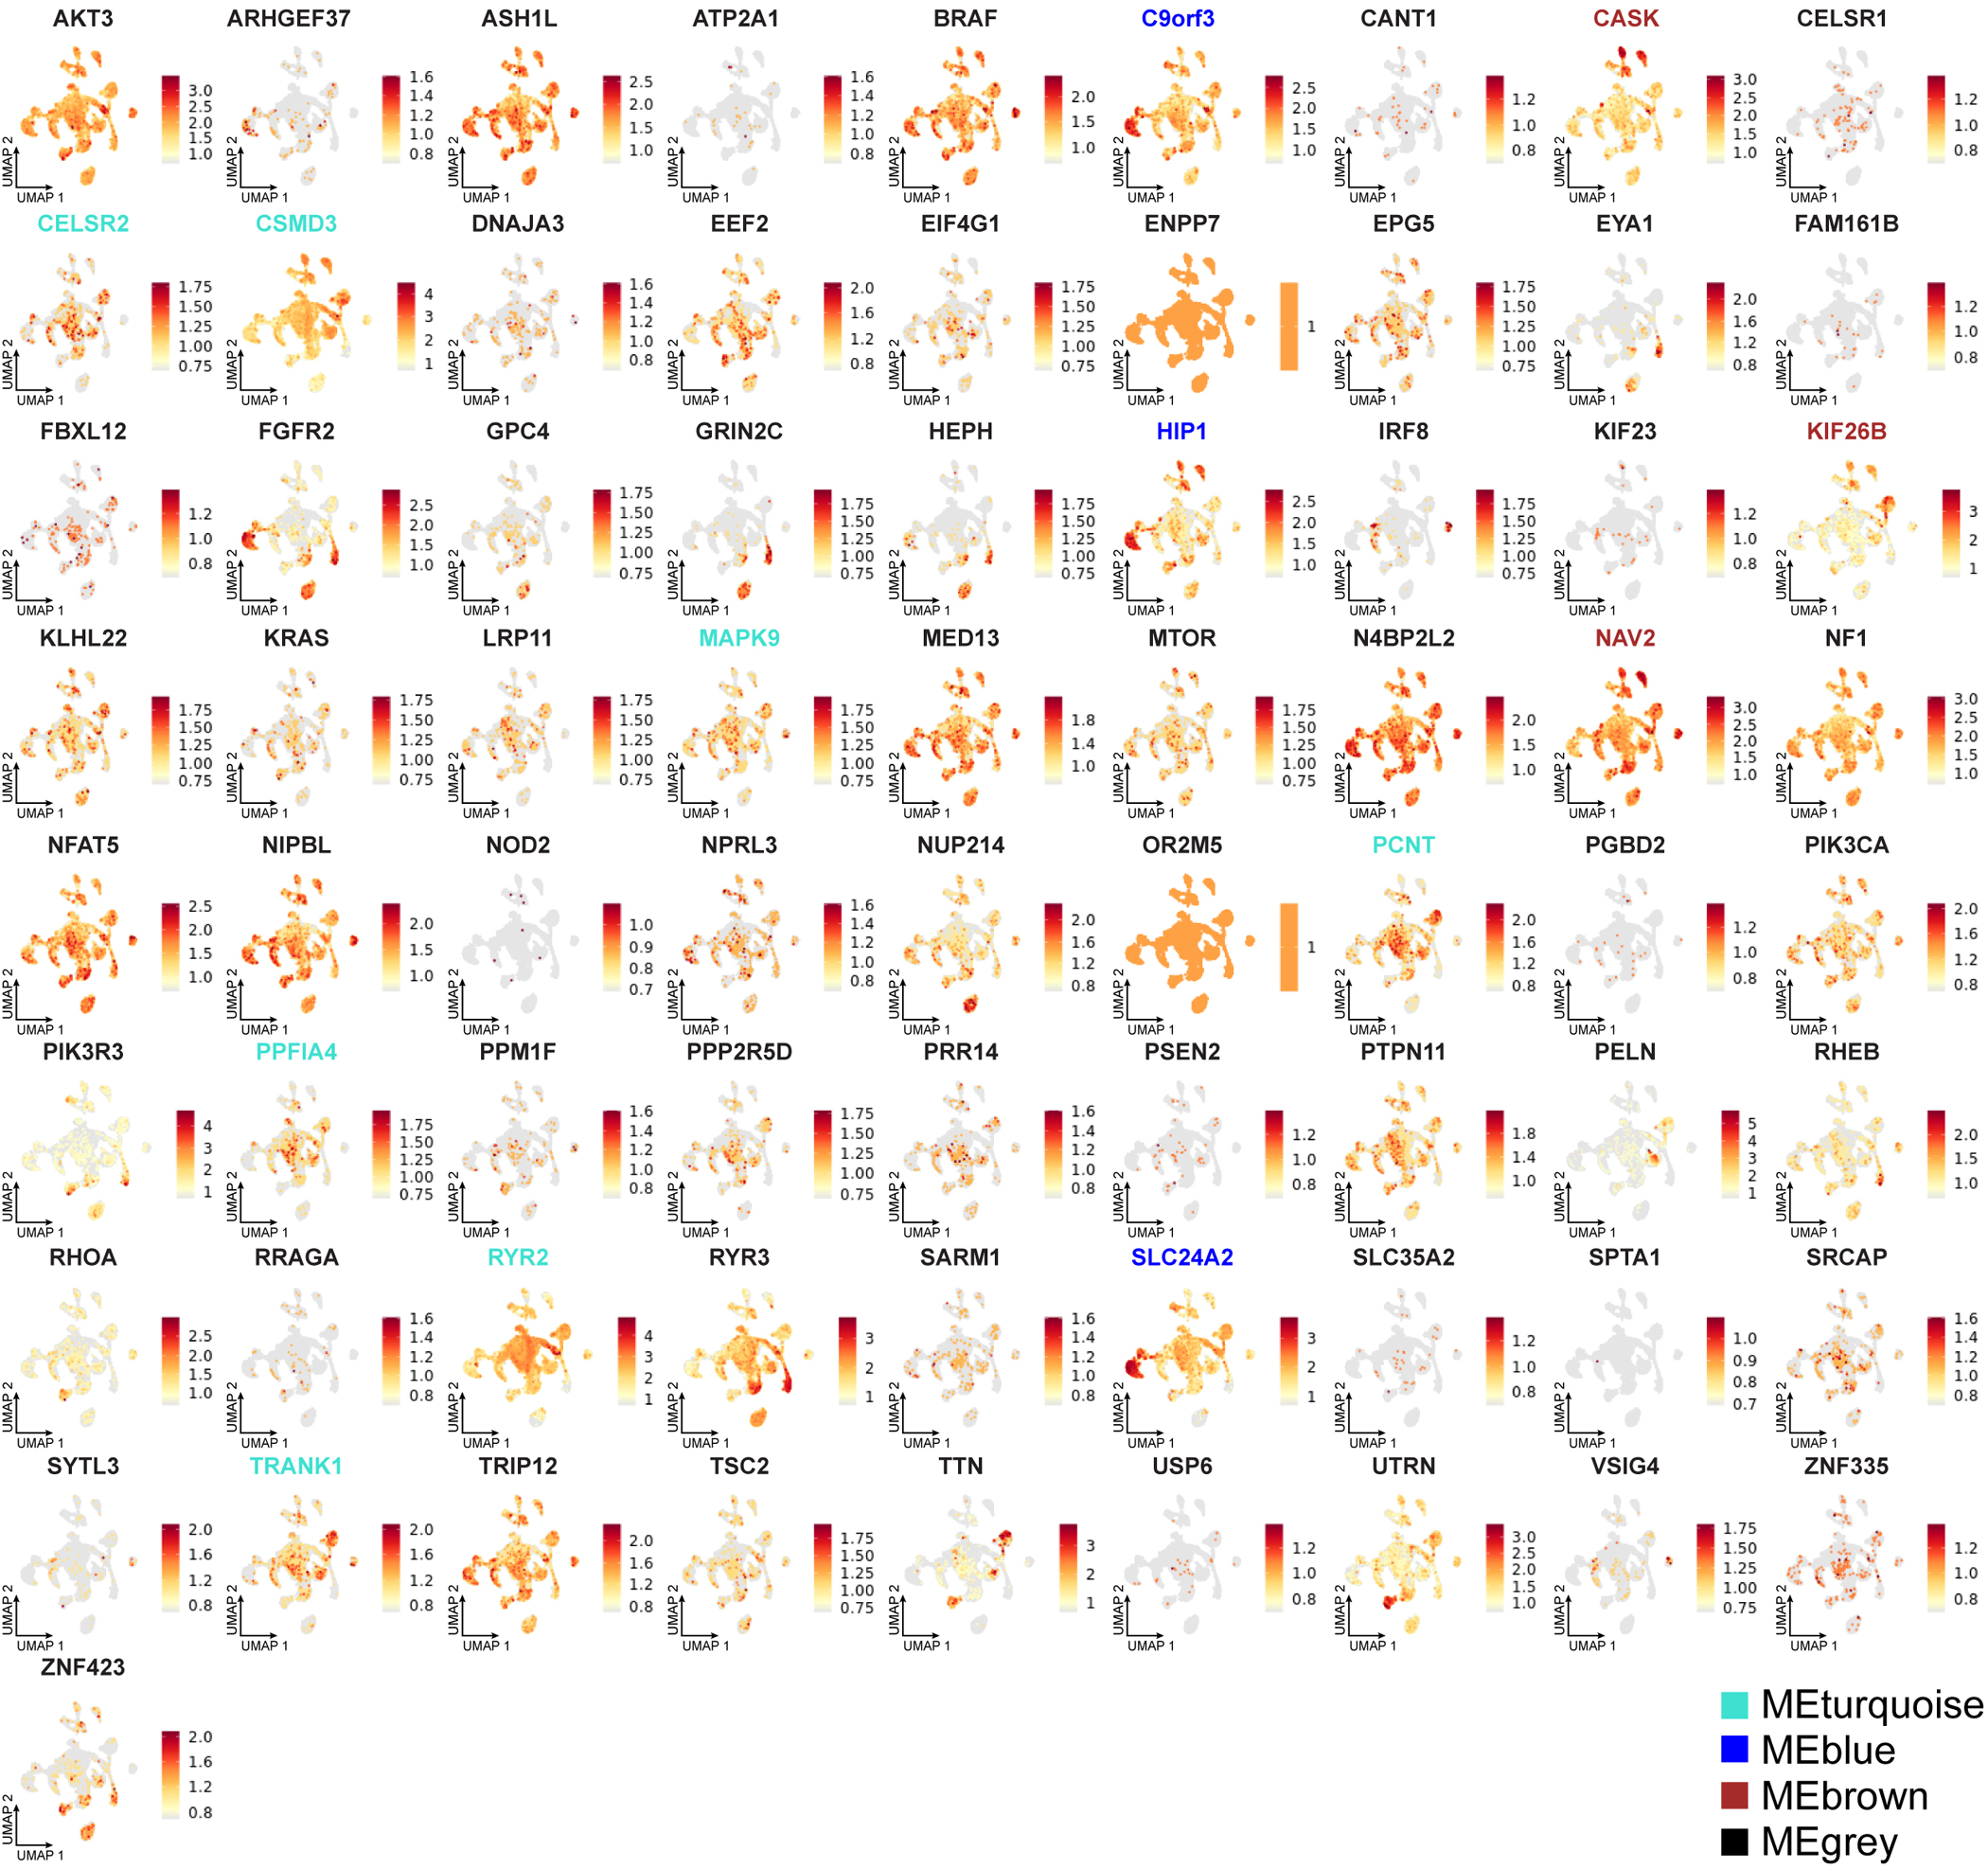
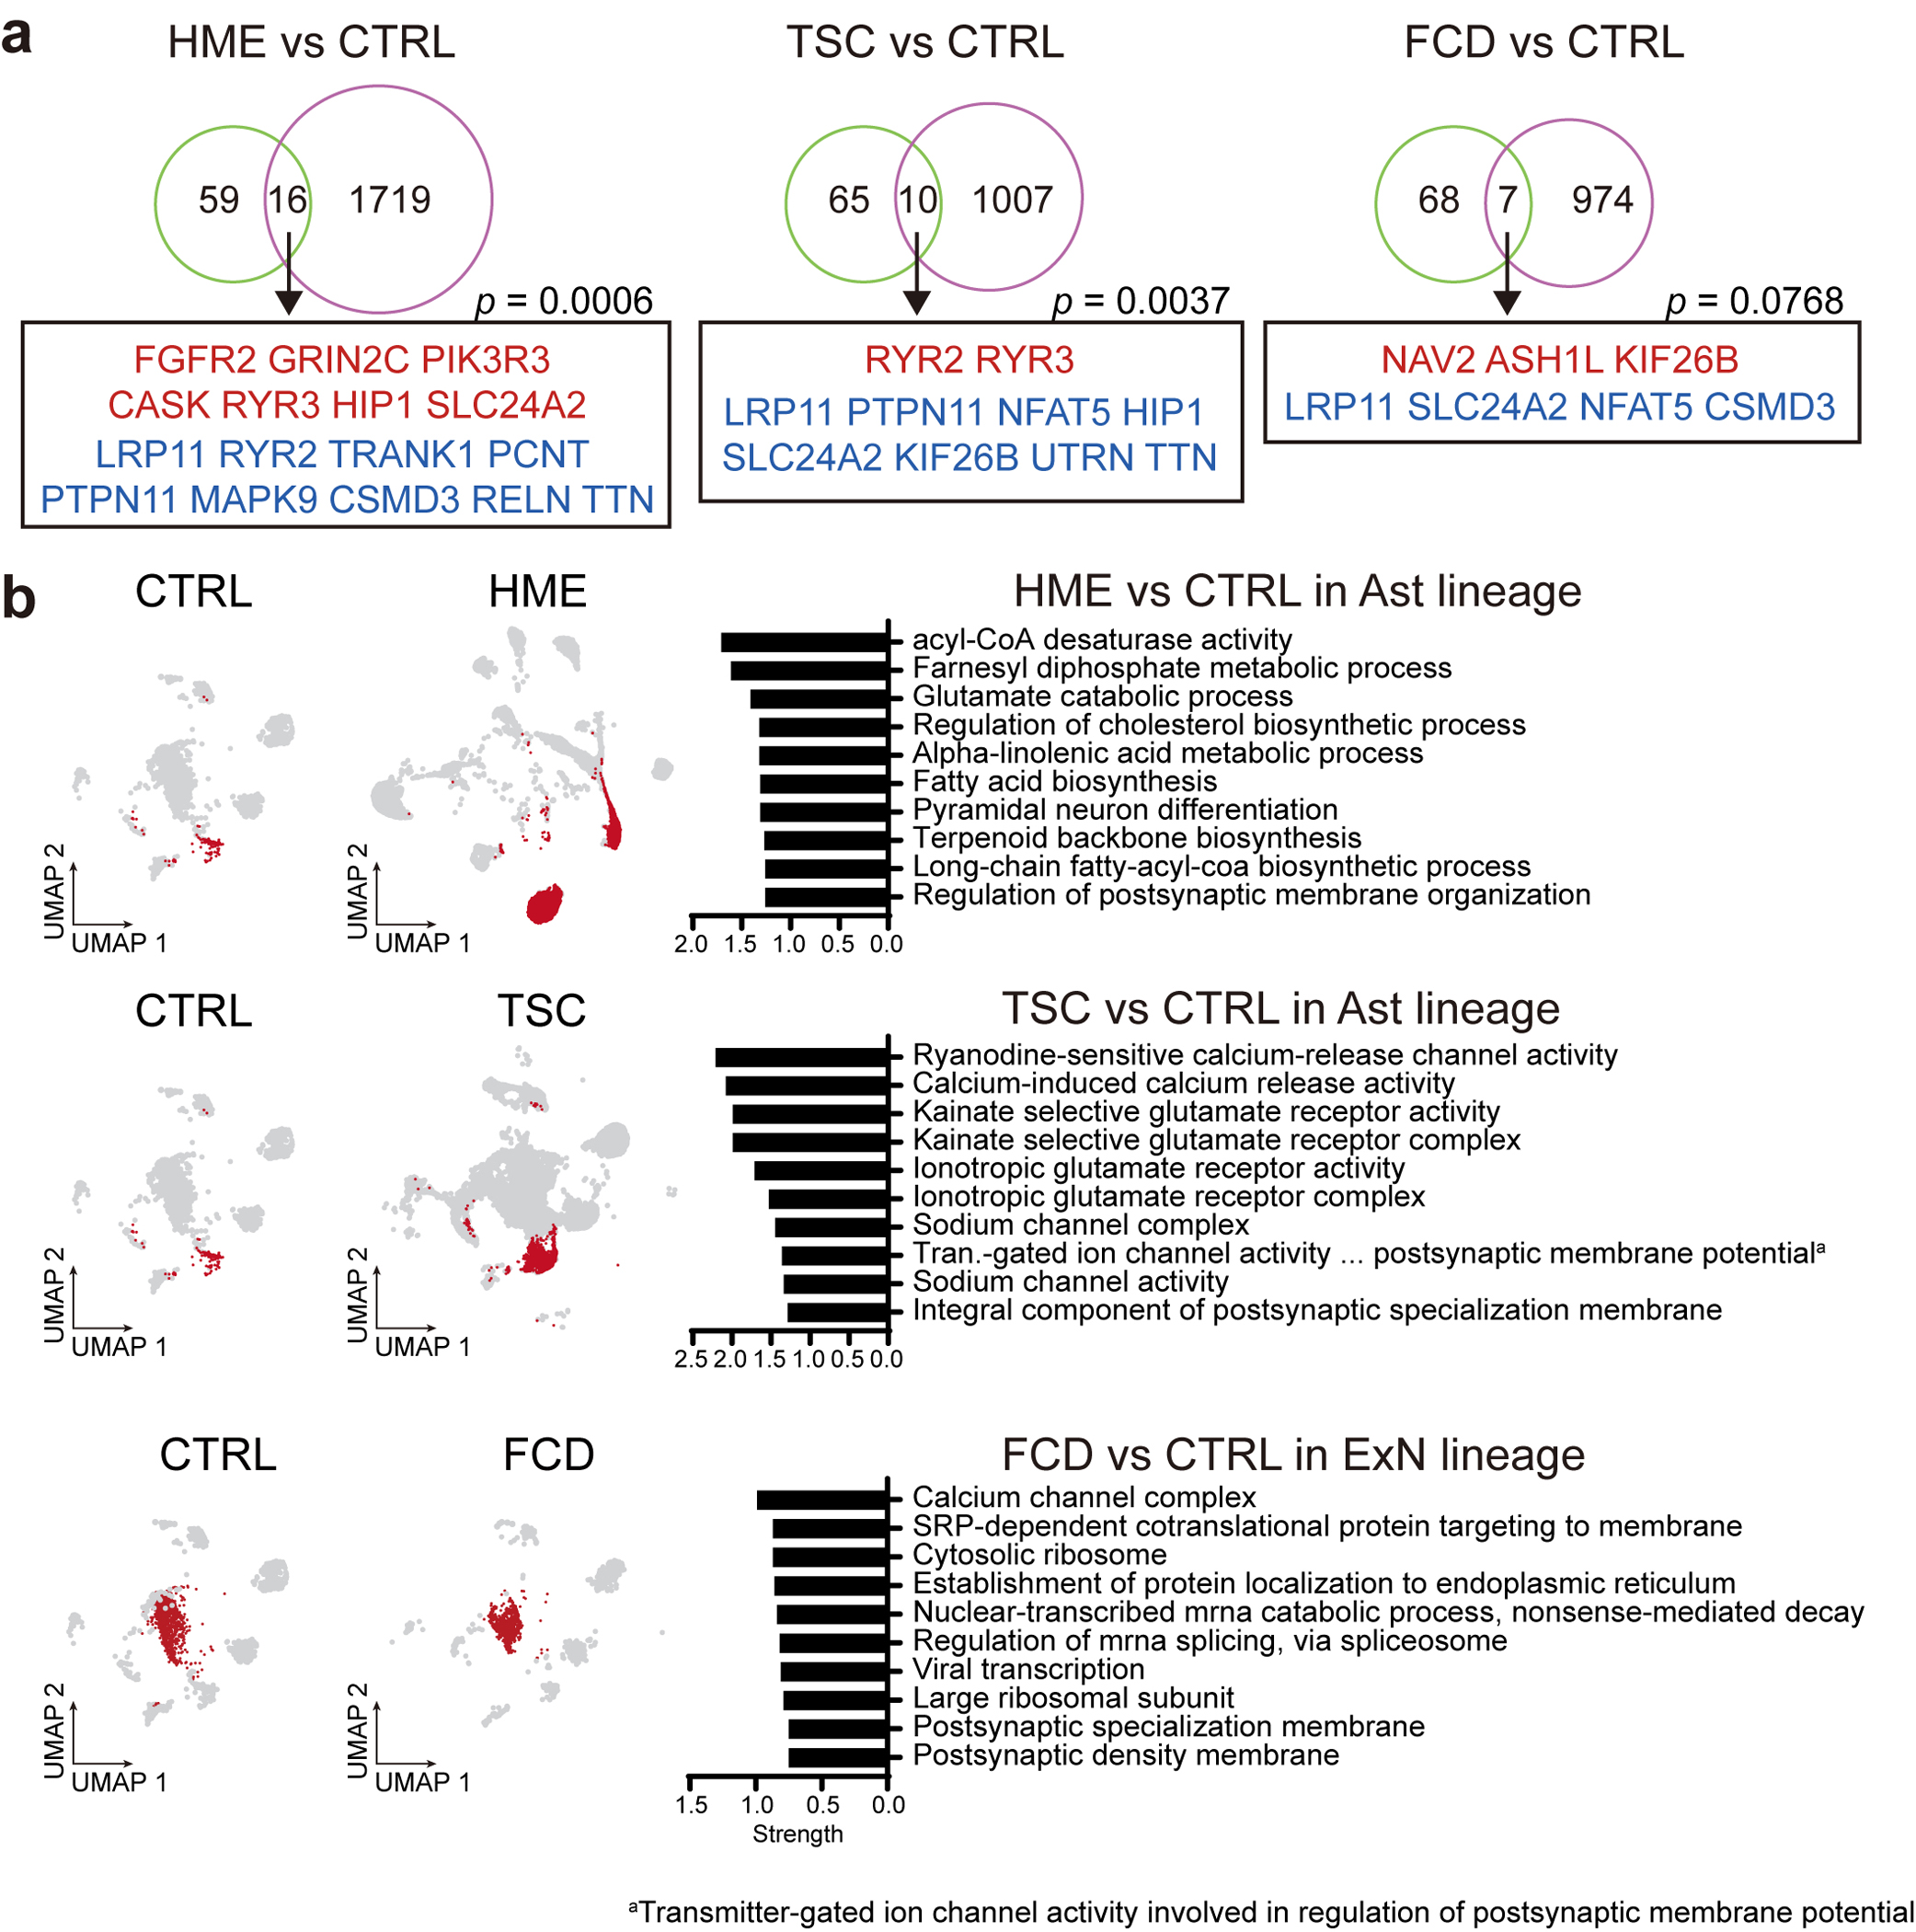
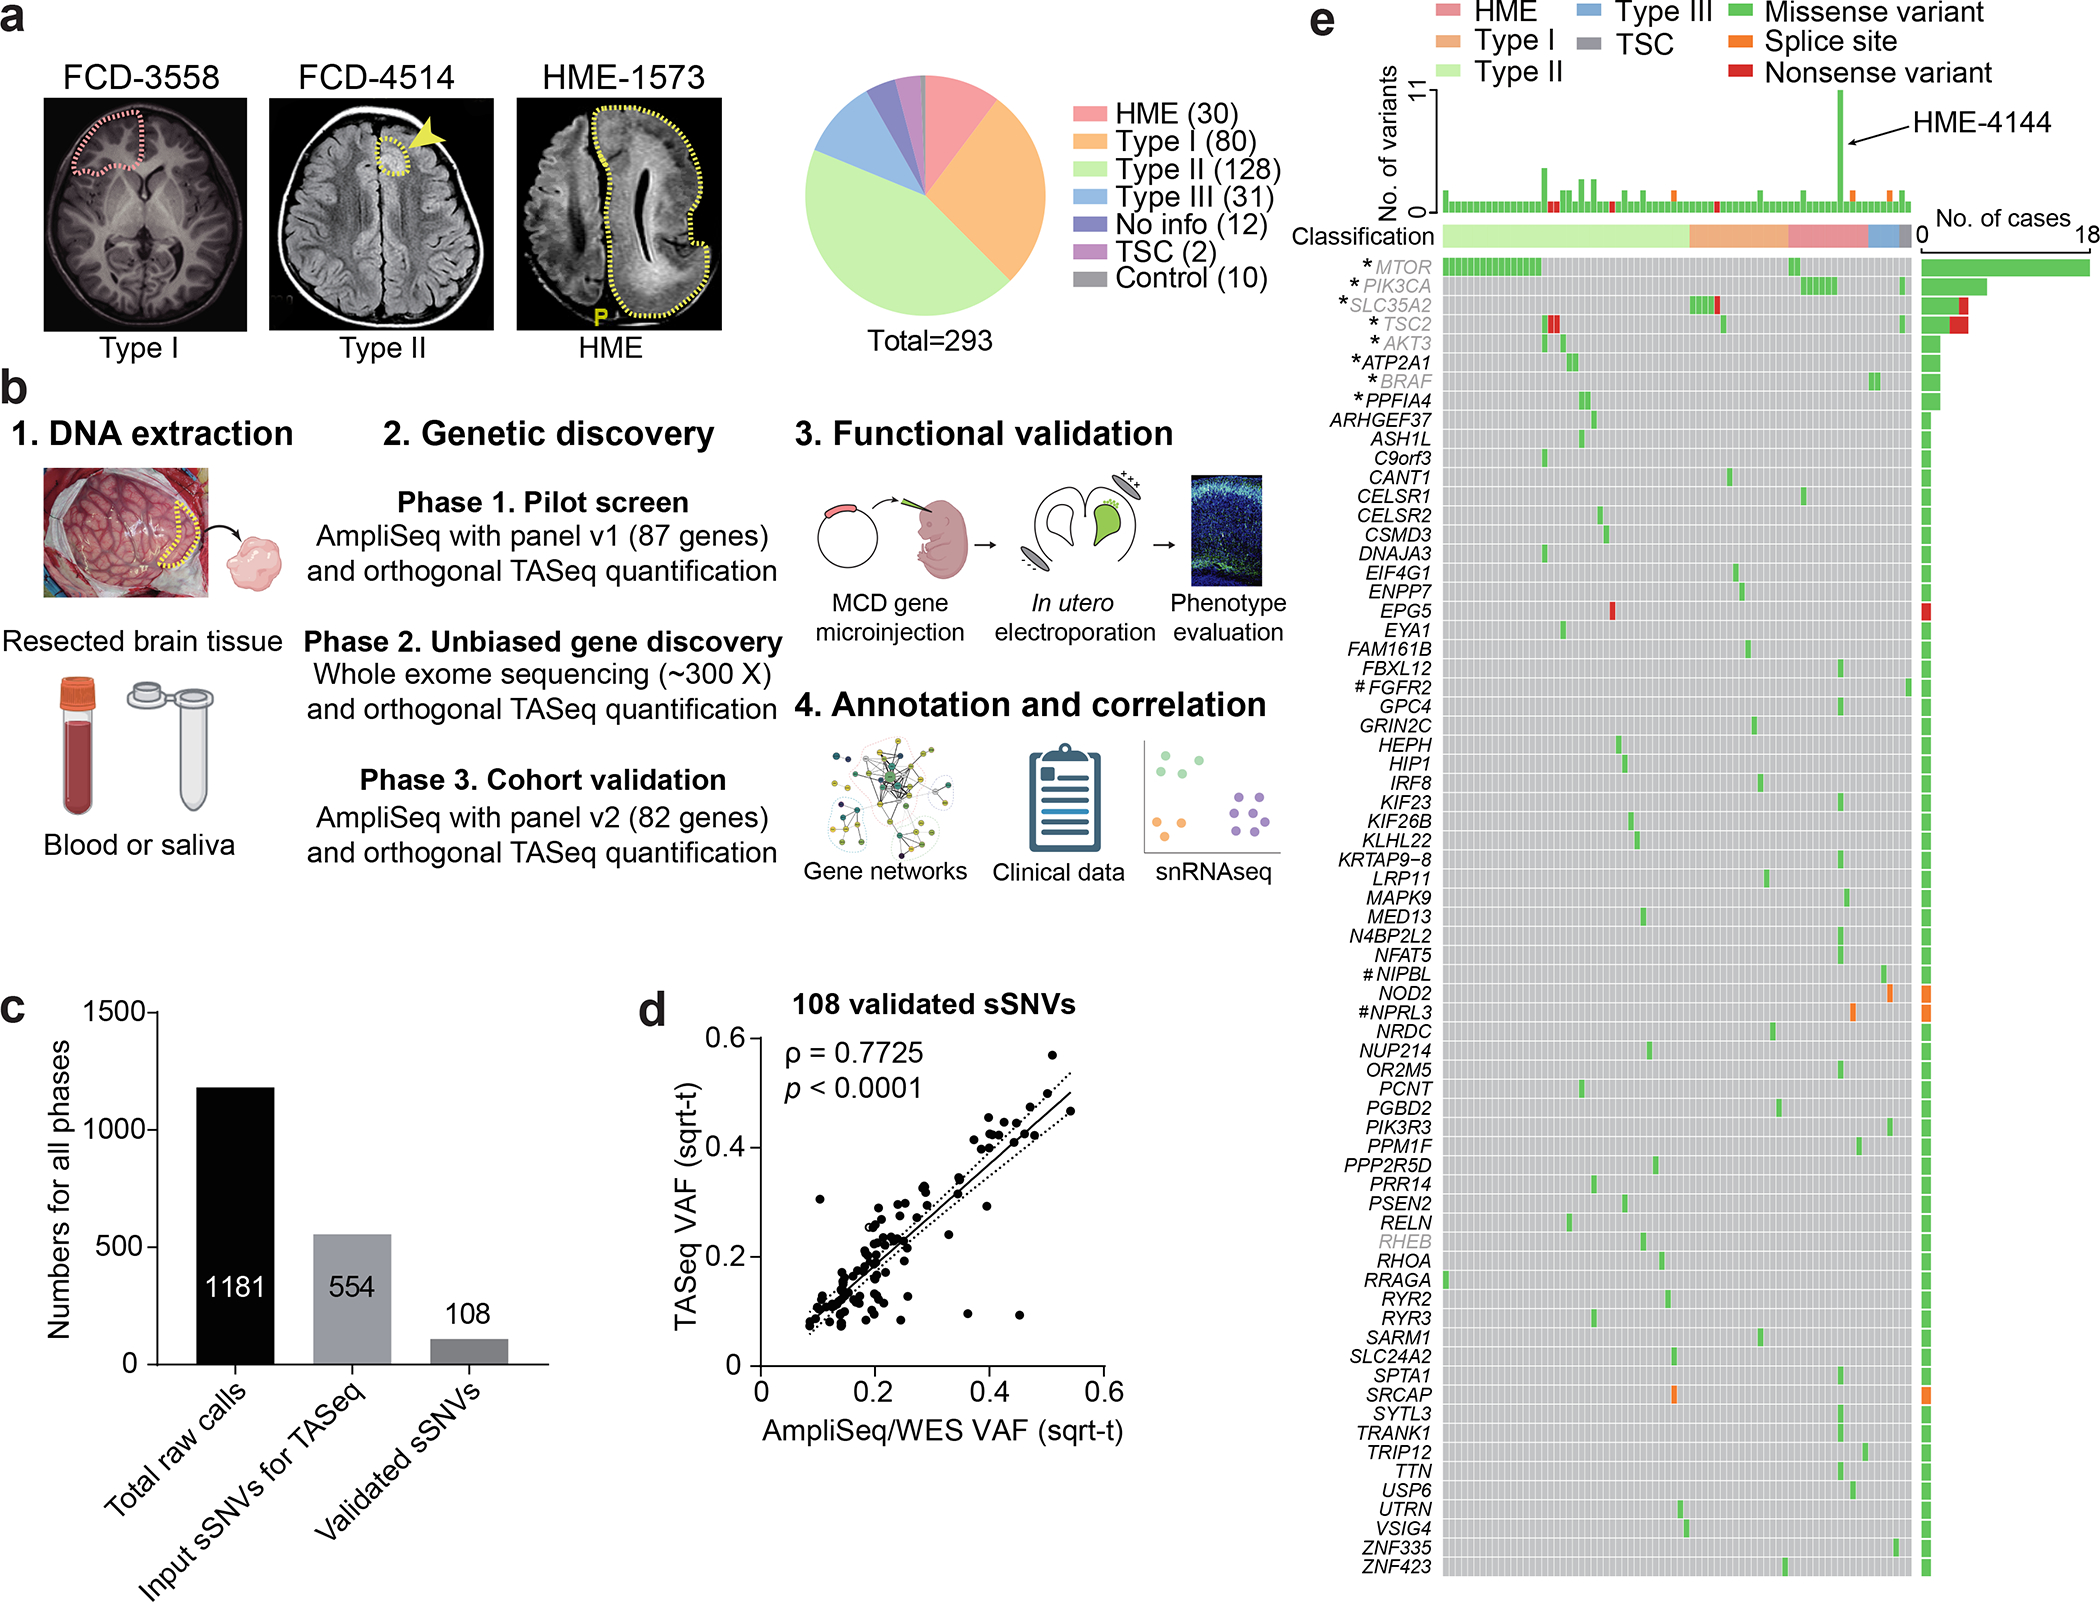
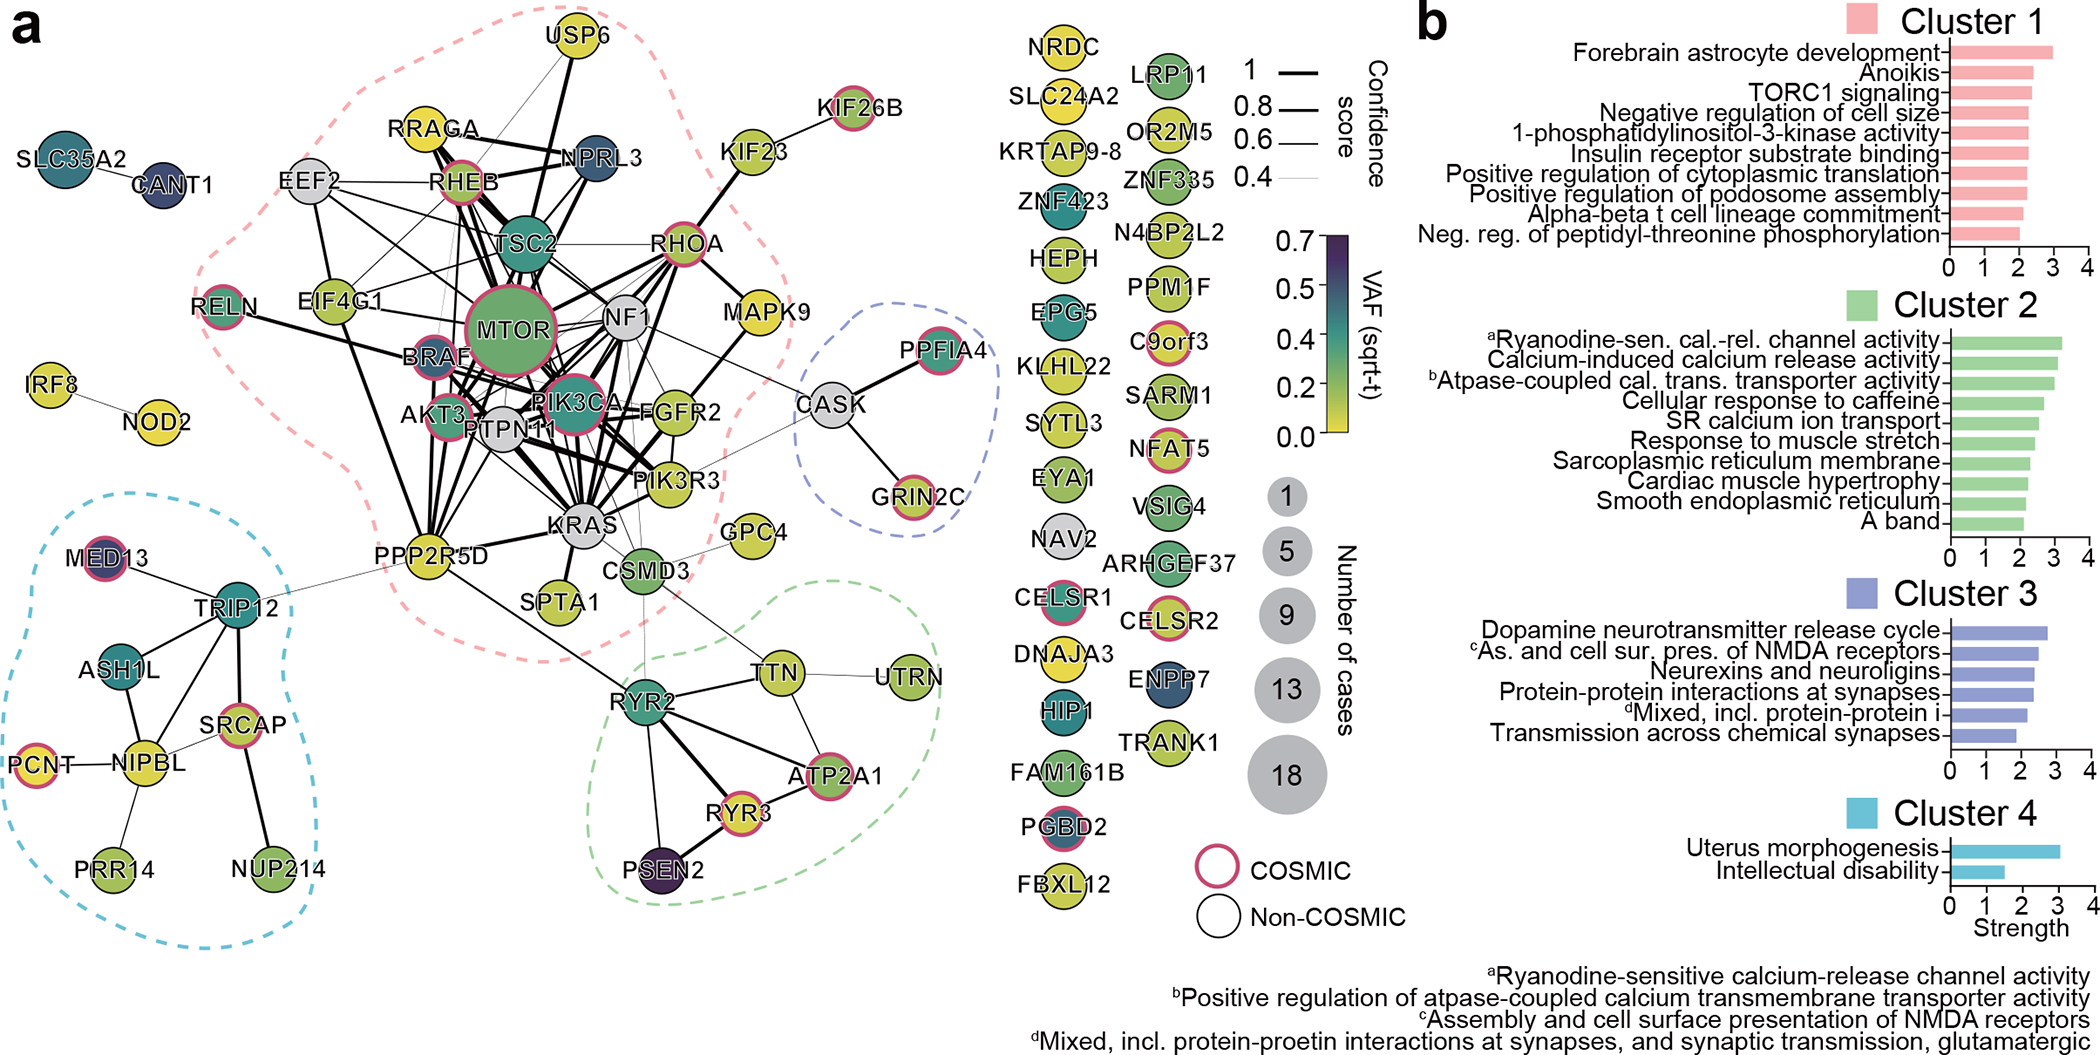
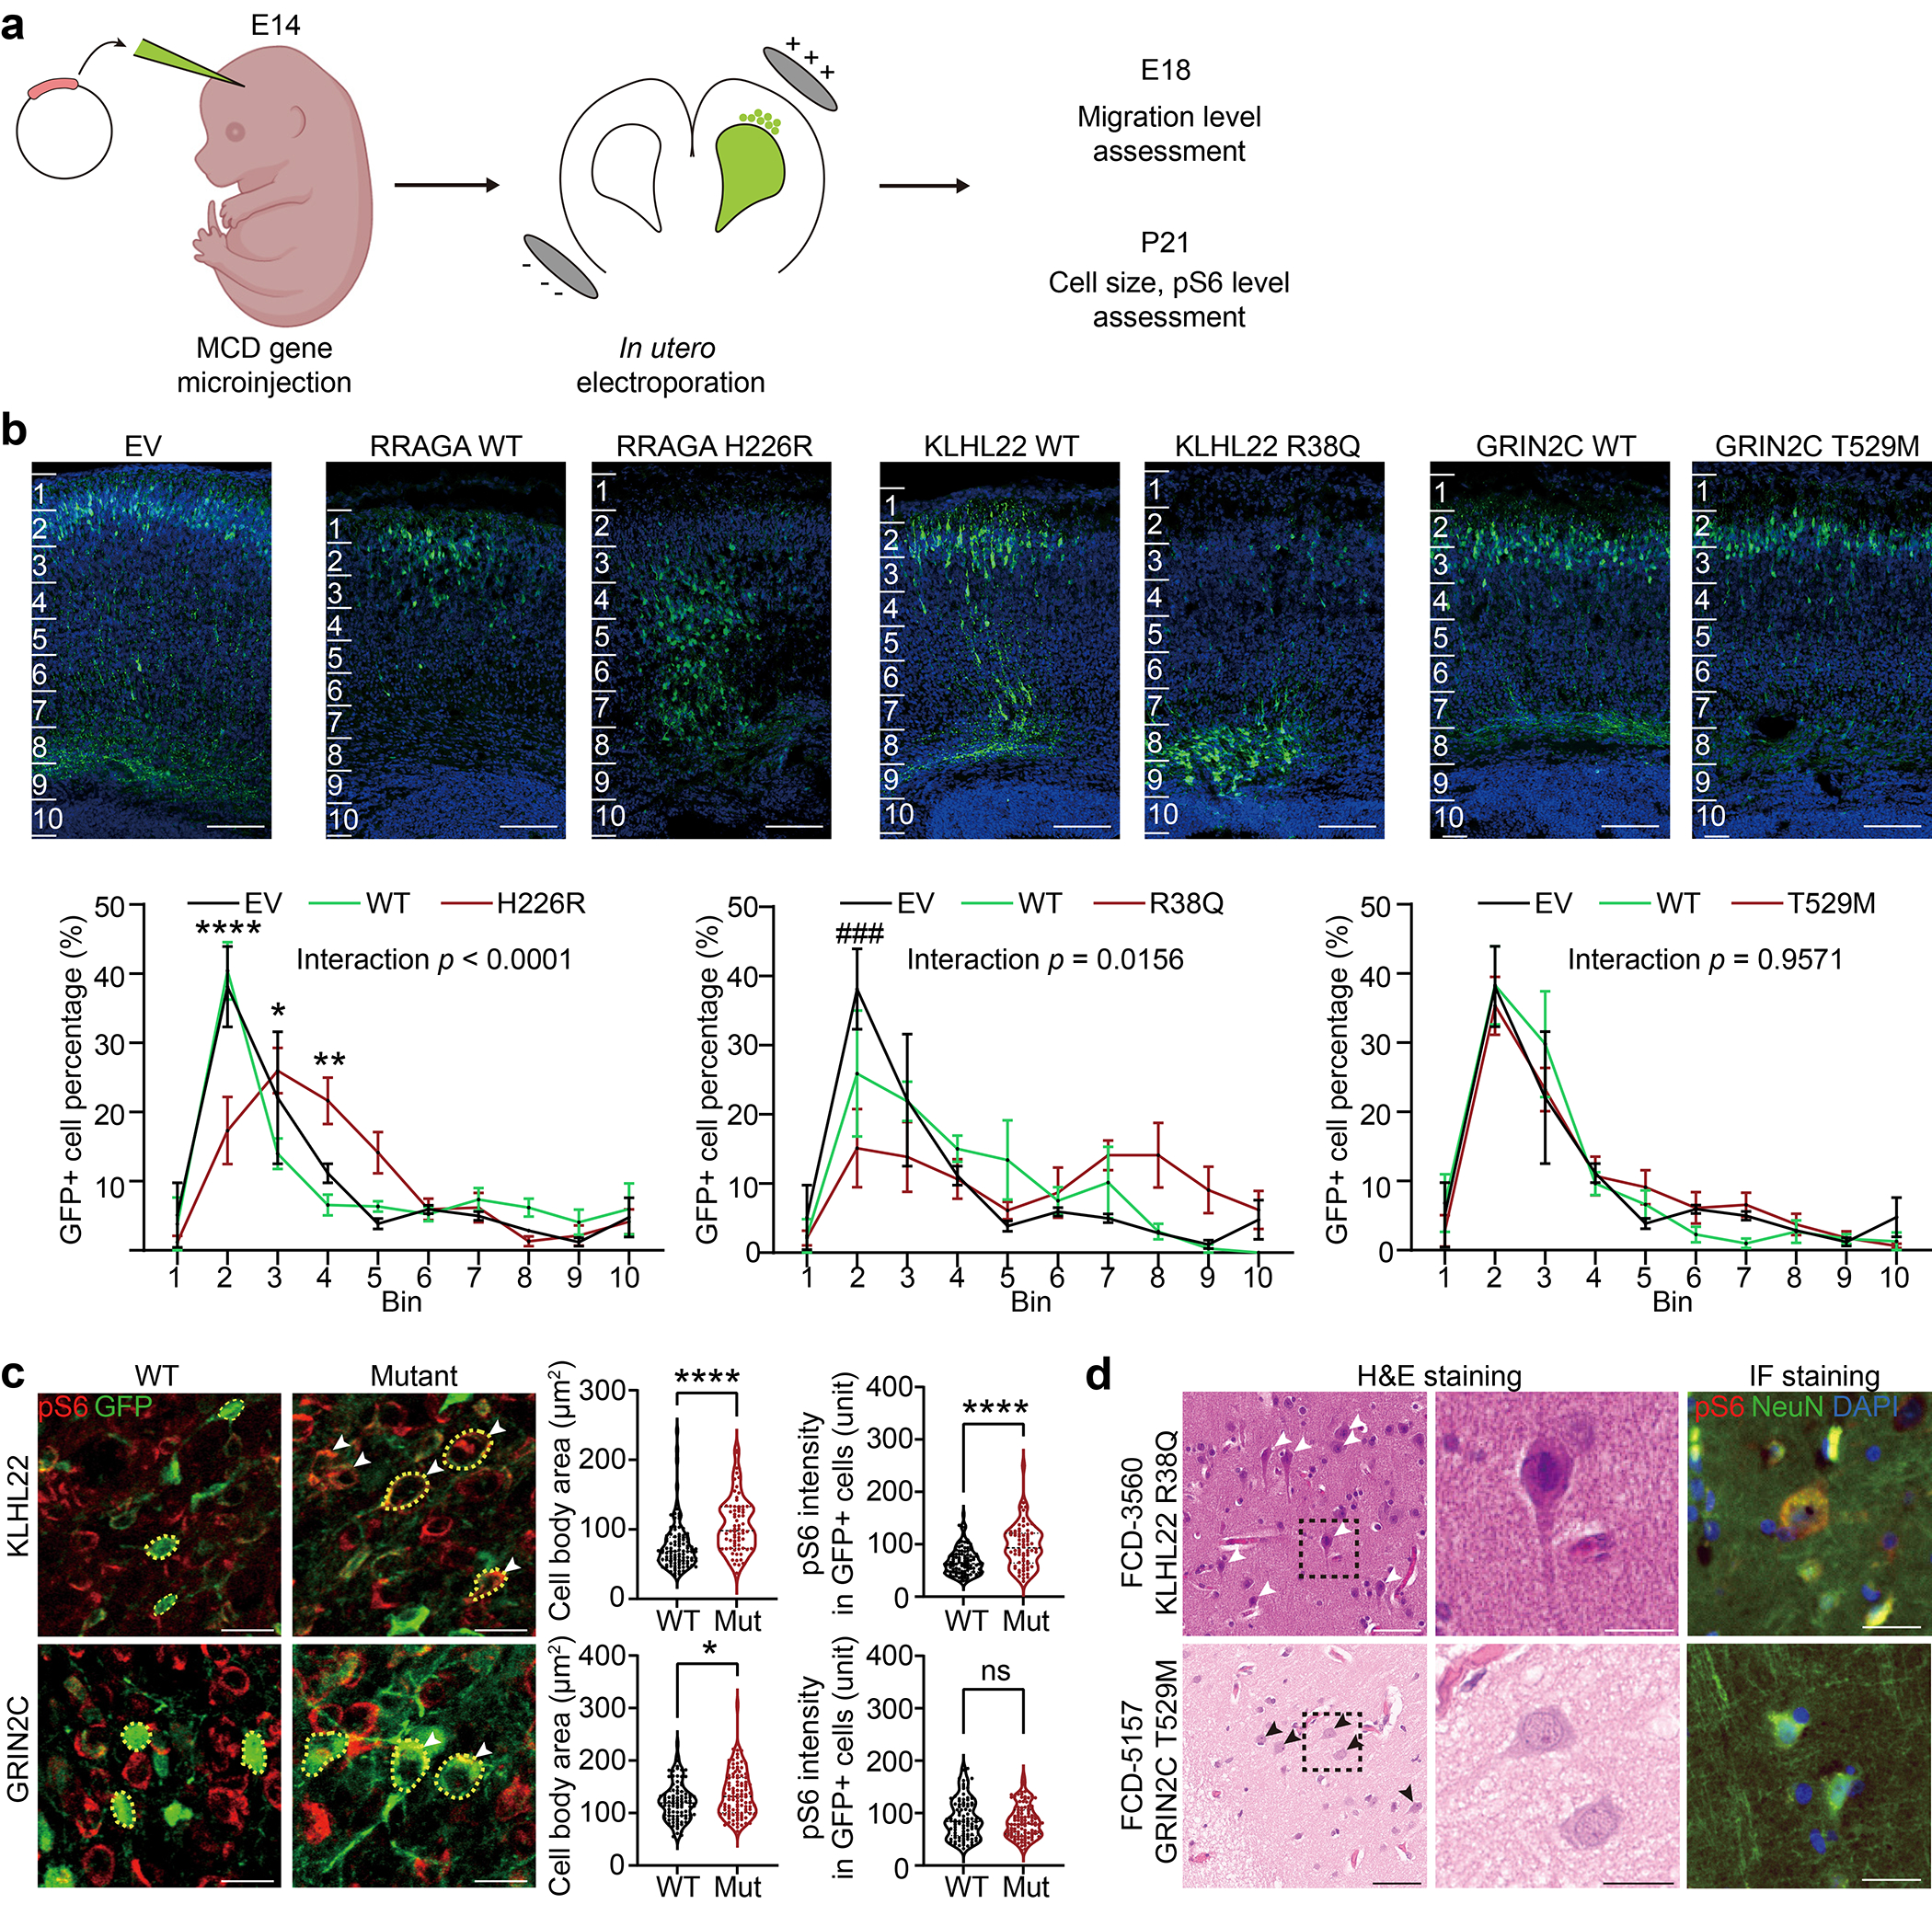
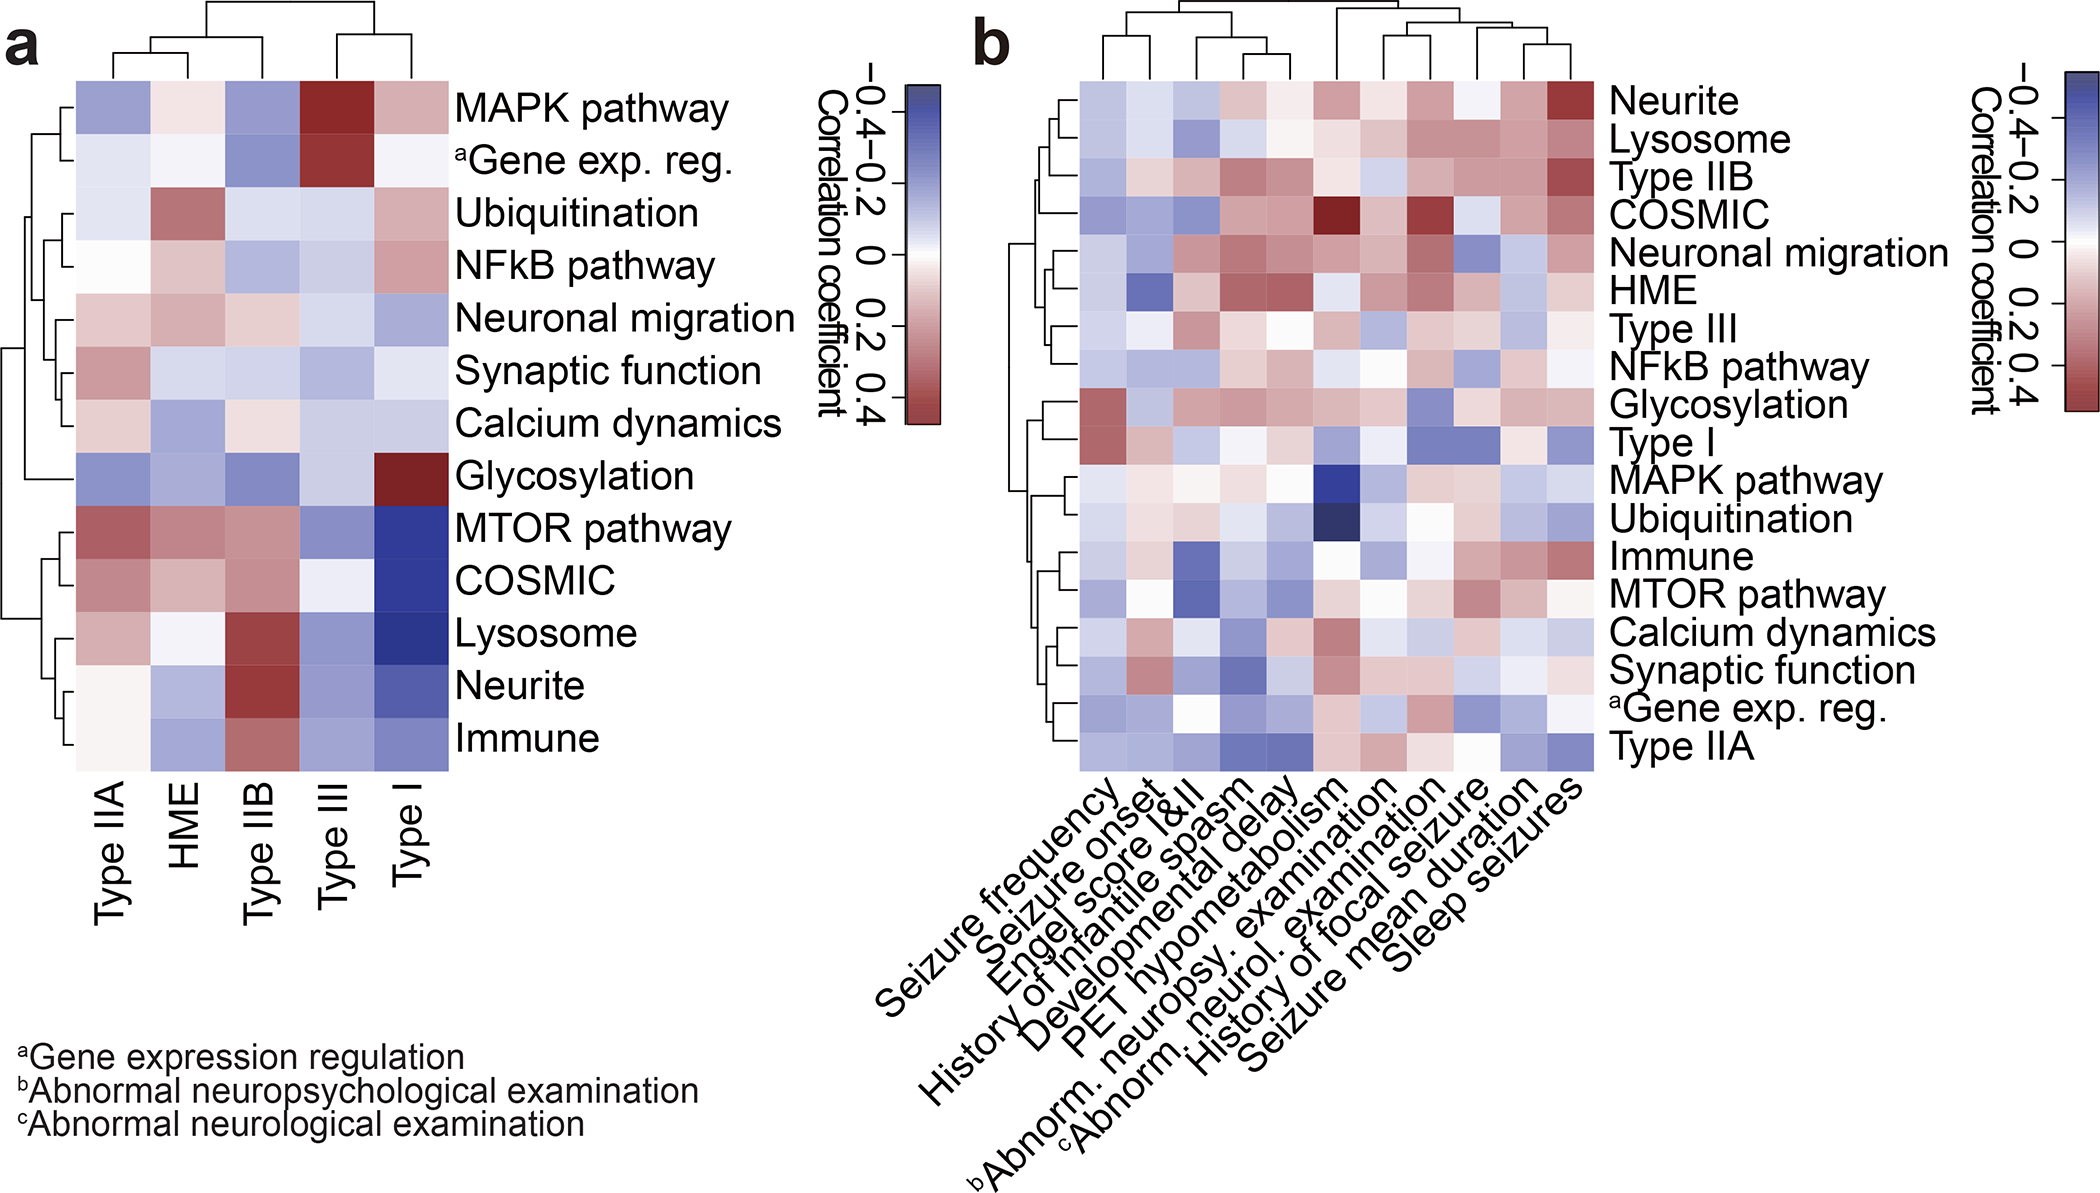
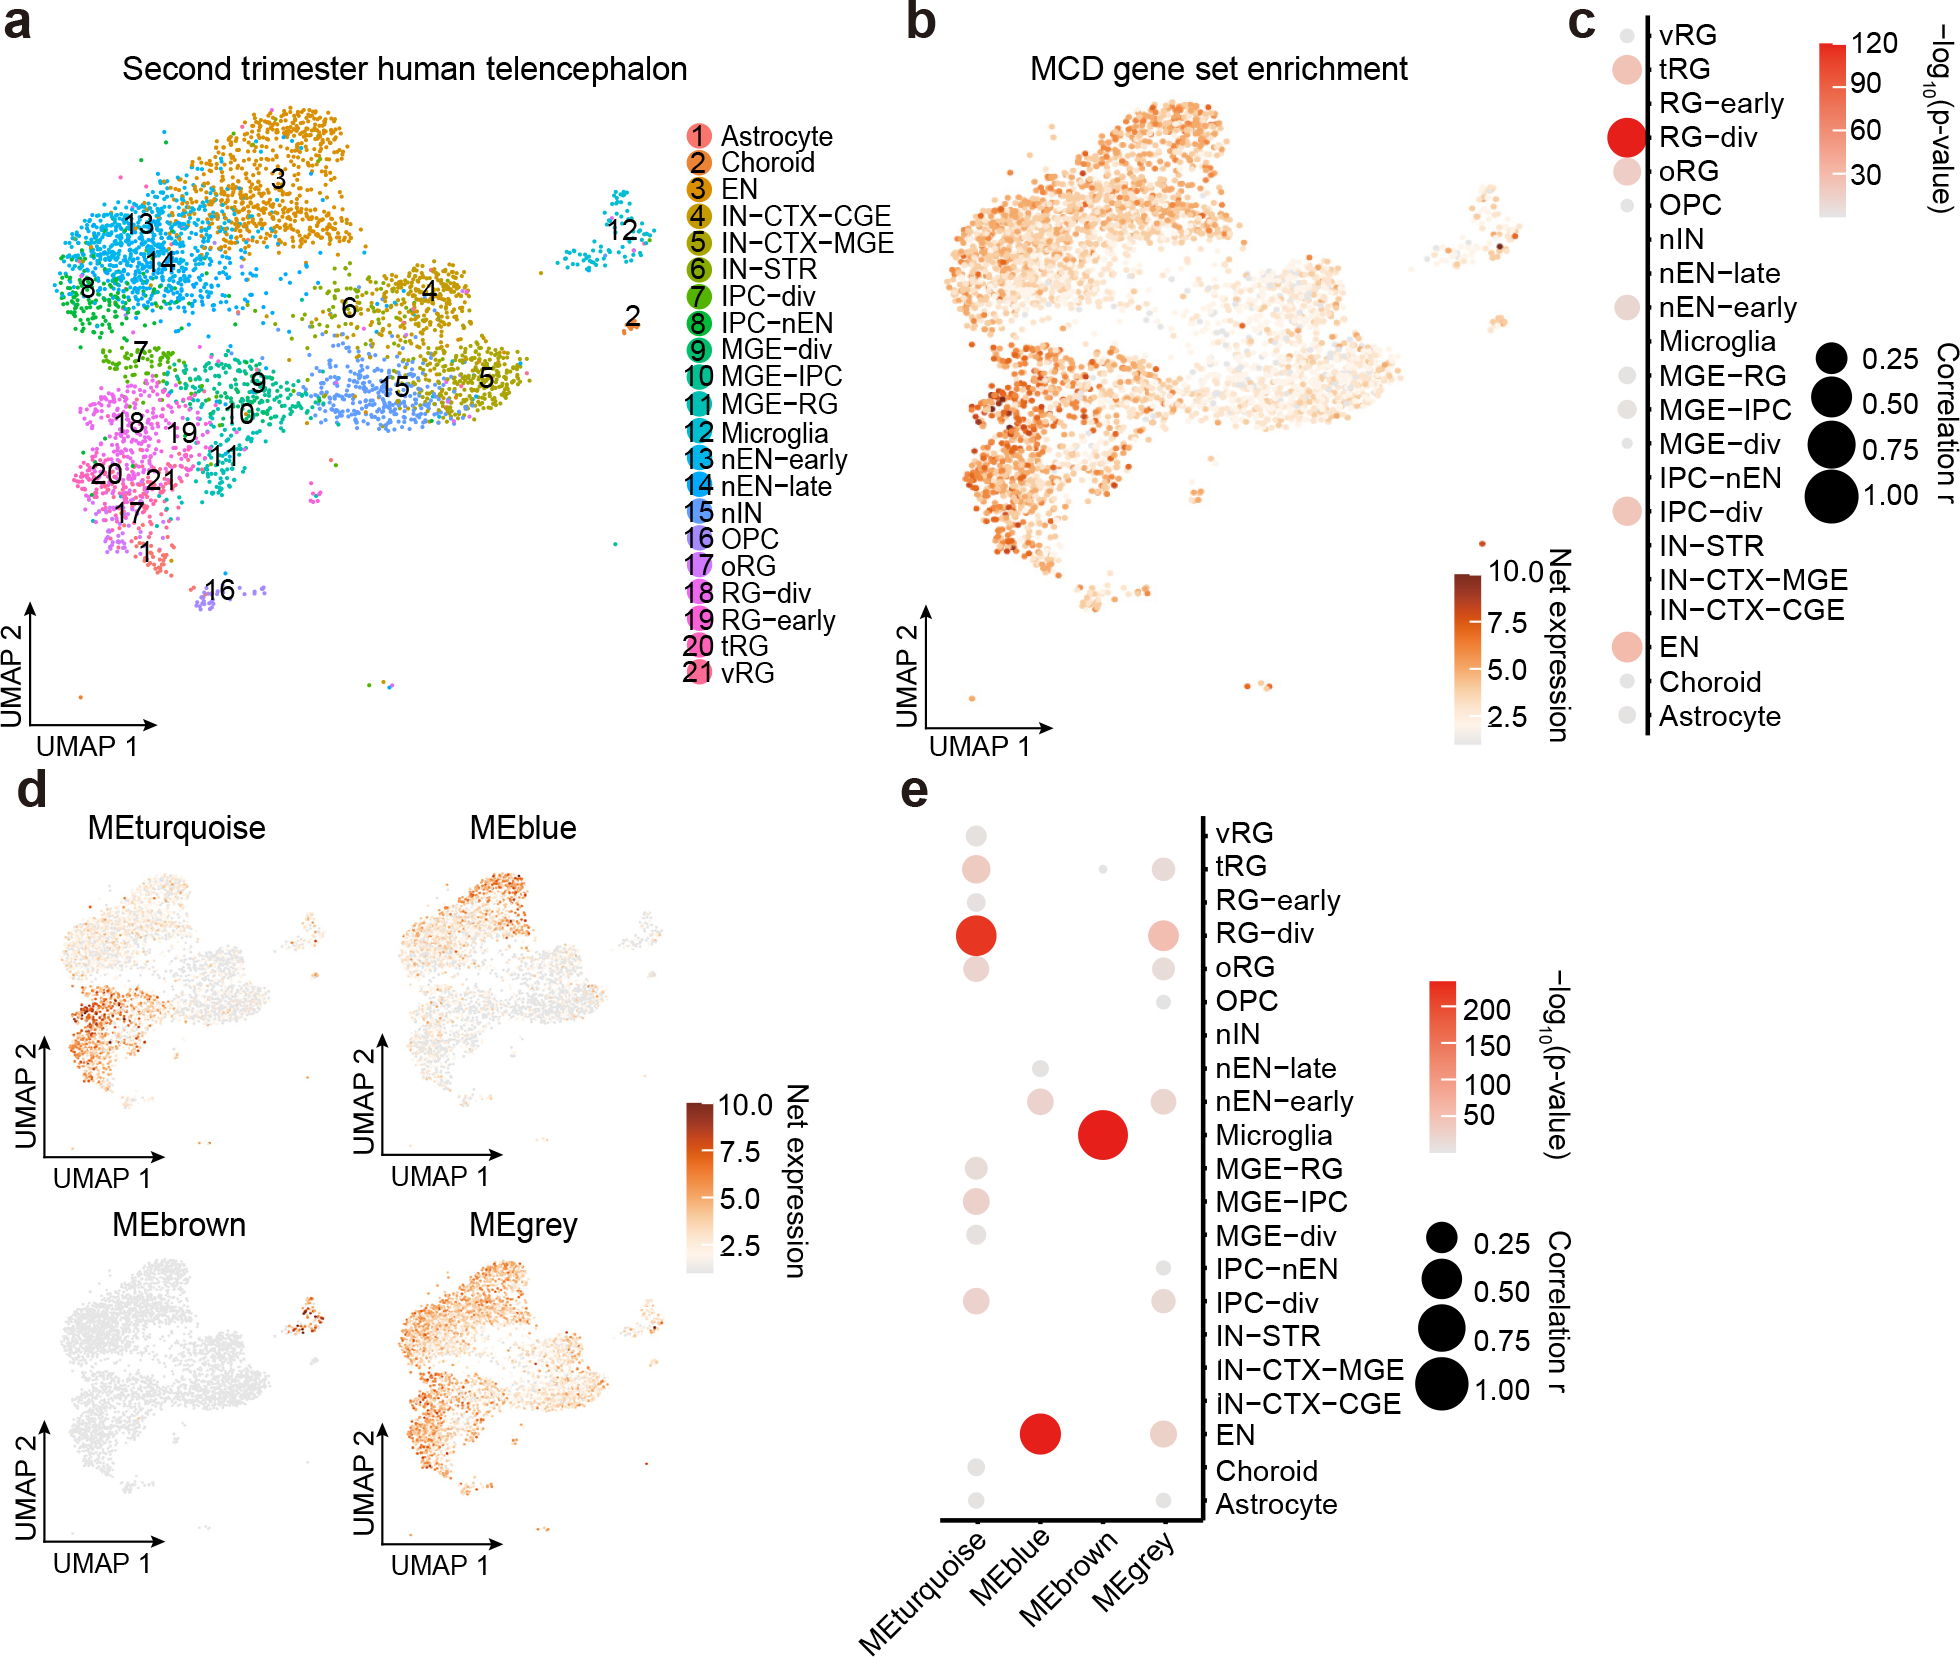
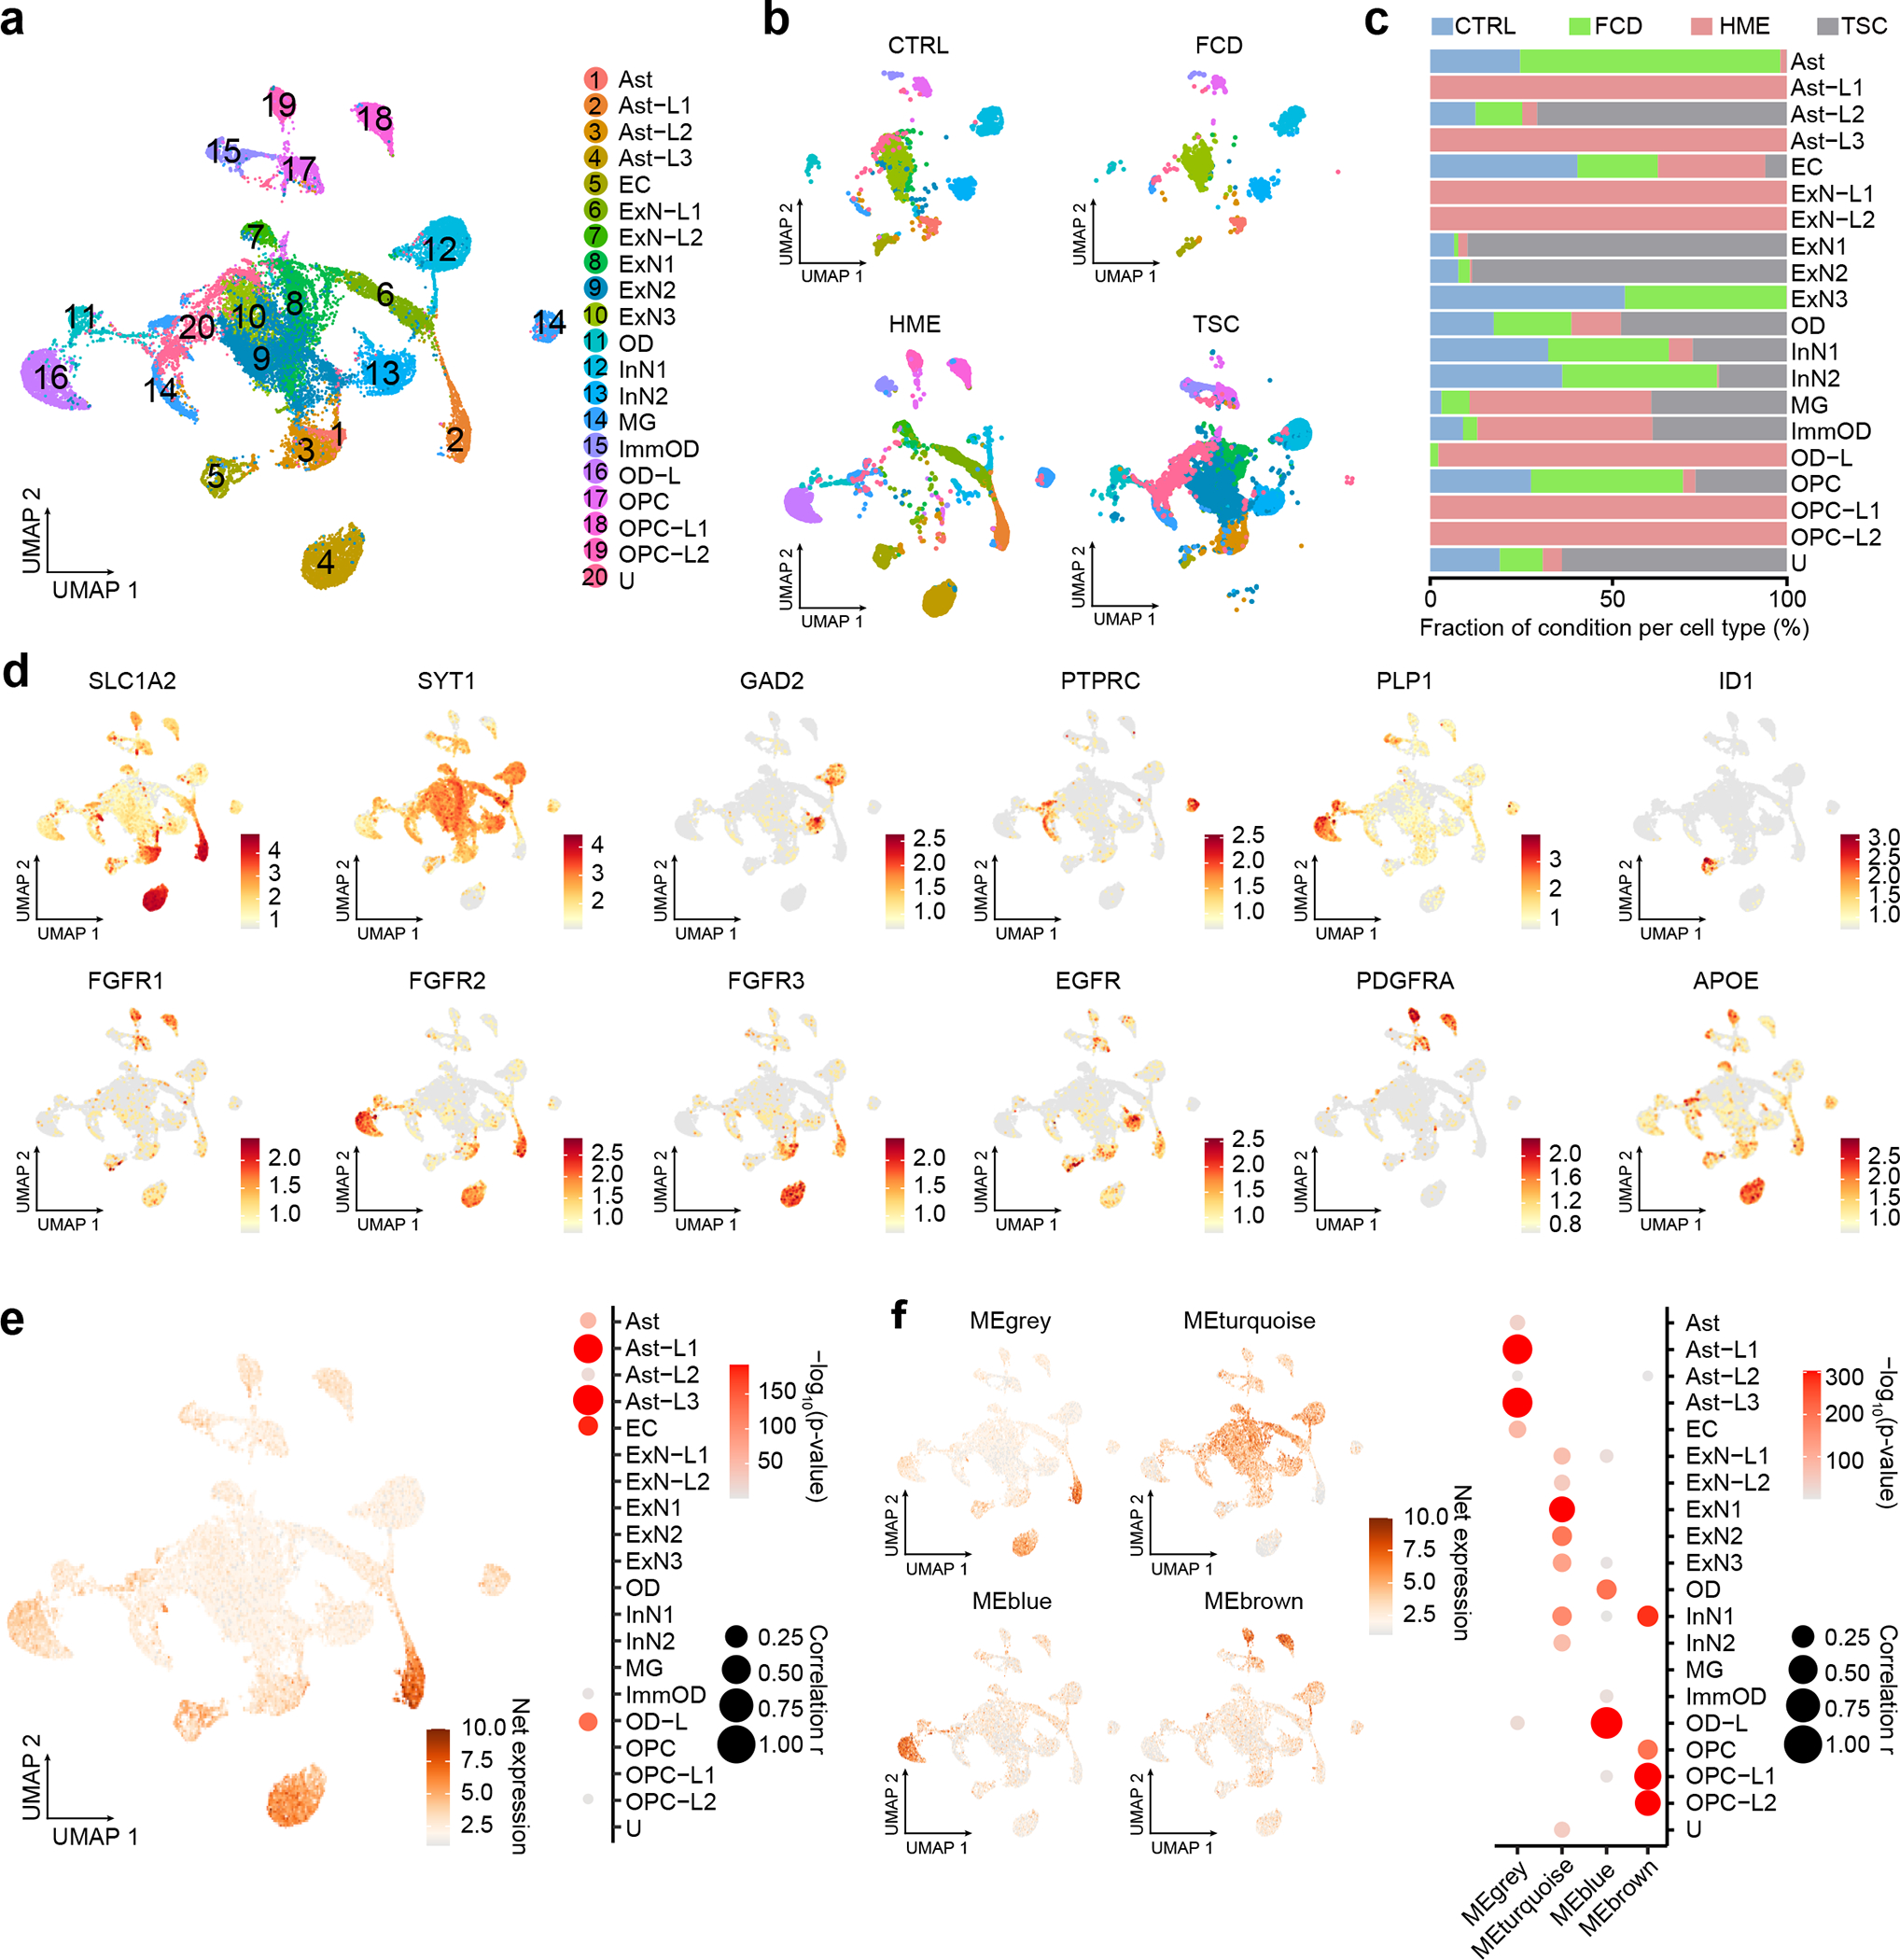
Malformations of cortical development (MCD) are neurological conditions involving focal disruptions of cortical architecture and cellular organization that arise during embryogenesis, largely from somatic mosaic mutations, and cause intractable epilepsy. Identifying the genetic causes of MCD has been a challenge, as mutations remain at low allelic fractions in brain tissue resected to treat condition-related epilepsy. Here we report a genetic landscape from 283 brain resections, identifying 69 mutated genes through intensive profiling of somatic mutations, combining whole-exome and targeted-amplicon sequencing with functional validation including in utero electroporation of mice and single-nucleus RNA sequencing. Genotype-phenotype correlation analysis elucidated specific MCD gene sets associated with distinct pathophysiological and clinical phenotypes. The unique single-cell level spatiotemporal expression patterns of mutated genes in control and patient brains indicate critical roles in excitatory neurogenic pools during brain development and in promoting neuronal hyperexcitability after birth.


Conflict of interest statement

Competing Interests Statement

The authors declare no competing interests.

Figures

Extended Data Fig. 1
Extended Data Fig. 1. Workflow of genetic discovery and bioinformatic pipeline to detect sSNVs in the MCD cohort.
(a) Workflow chart describing the flow of cases for each phase of genetic discovery. QNS: quantity not sufficient. 2 cases labeled by a star are sequenced in phase 1 but not phase 2. (b) The pipeline for paired samples. Notably, the dashed square indicates that the sharing variants between MuTect2 paired mode and Strelka2 were used for the downstream analysis. BSMN common pipeline and DeepMosaic were used only for WES datasets. The DeepMosaic input variants were generated by MuTect2 single mode. (c) The pipeline for unpaired samples. The pipeline is similar except that MuTect2 single mode without Strelka2 is used. PM: paired mode, SM: single mode.
Extended Data Fig. 2
Extended Data Fig. 2. The locations of the selected MCD variants.
(a) The location of two recurrent SNV calls is at the same position between the coiled-coil domain (CC) and the first SAM domain (S) of Liprin-α4. (b) Two different variants in SERCA1. p.R524C mutation is at the nucleotide ATP-binding (N) domain, whereas the pA846T variant is in the 7th transmembrane (M7) domain. A: Actuator domain, P: Phosphorylation domain, M: Transmembrane domain. (c) Left: The location of p.H226R variant in RAGA protein. GTPase: GTPase domain, CRD: C-terminal roadblock domain. Right: UCSC genome browser screenshot describing that p.H226 is a conserved site across all vertebrates. (d) The location of the p.R38Q variant in the N-terminal region before the BTB (Broad-Complex, Tramtrack, and Bric-à-brac) domain of KLHL22. (e) A variant in the S1 domain of NR2C. S1 and S2 together make the ligand-binding domain (LBD), the target of glutamate. ATD: Amino-terminal domain. (f) RHOA p.P75S variant in the interdomain space between the second GTP/GDP binding domain and Rho insert domain.
Extended Data Fig. 3
Extended Data Fig. 3. Mutational signature analysis shows cell-division-related clock-like signatures in the MCD cohort.
SBS5 (39.1%) and SBS1 (33%) revealed by Mutalisk are clock-like mutational signatures. SBS1 especially correlates with stem cell division and mitosis.
Extended Data Fig. 4
Extended Data Fig. 4. Four major gene networks were reconstructed from the WES dataset.
(a) STRING DB pathway analysis of the 59 MCD discovered genes and six novel genes (a total of 65 genes) from recent publications identifies MTOR/MAP kinase pathway (pink, Cluster 1), Calcium dynamics (green, Cluster 2), Synapse (purple, Cluster 3), Gene expression (blue, Cluster 4). Edge thickness: confidence score calculated by STRING. Size and color of a node: square root transformed (sqrt-t) number of patients carrying a given mutation and average VAF across all patients, respectively. Non-clustered orphan genes are listed on the right. (b) Gene Ontology (GO) analysis results confirmed the functions of compositions in each network. Top GO terms or KEGG pathways. Strength calculation and cluster generation were performed by STRING.
Extended Data Fig. 5
Extended Data Fig. 5. ClueGO analysis using the MCD genes result identifies the biological processes and molecular pathways.
The main cluster is related to TOR signaling, regulation of cell-matrix adhesion, regulation of focal adhesion assembly, and artery morphogenesis. Notably, there are also isolated clusters that were not covered in previous studies, for example, cardiac muscle cell contraction, calcium ion import, and protein localization to the synapse. Corrected p-value with Bonferroni step down was reflected in node size (two-sided hypergeometric test, Large: p < 0.0005, medium: p < 0.005, small: p < 0.05). All p-values are in Supplementary Table 9.
Extended Data Fig. 6
Extended Data Fig. 6. Additional functional analyses for new RRAGA and RHOA mutations.
(a) Over-expression of RHOA WT and P75S mutant form in cortical neurogenic pool induce both significant defects in migration. Notably, some portion of WT form-expressing cells migrate to the superior cortical area (white arrow), whereas mutant form-expressing cells did not show any migrating cells at all. The dashed square area is magnified to the right side images. Scale bar: 100 μm and 20 μm for left and right images, respectively. Right, Quantification of the migration level. EV data was exported from Fig. 3b. Two-way ANOVA and Sidak multiple comparisons with p-values of interaction between genotype and bin factor. Ten bins from the surface of the cortex (top) to SVZ (bottom). n=3, 3, 2 biologically independent mice for EV, RHOA WT and RHOA P75S, respectively. Mean ± SEM. (b) Immunofluorescence in postnatal day 21 mouse cortices for RRAGA wild-type (WT) or mutant isoform. Yellow dashed lines: examples of cell body size quantification. Dashed lines and dotted lines in the violin plots indicate median and quartiles, respectively. Two-tailed Mann-Whitney U-test. Scale bar: 20 μm. n=61 cells (3 mice), 61 (2) for RRAGA WT and RRAGA H226R, respectively * or # indicates a p-value in comparison between WT and mutant group, or EV and mutant group respectively. ####p < 0.0001; ##p < 0.01; #p < 0.05; **p < 0.01; ns, non-significant.
Extended Data Fig. 7
Extended Data Fig. 7. Cell-type identification by DEGs and WGCNA in the MCD snRNAseq dataset.
(a) DEG analysis using FindAllMarker function in Seurat v4 package. The top 10 genes for each cluster were presented. Some notable marker genes are presented on the left side. Color: scaled gene expression level. (b) Description of WGCNA. The most variable 3000 genes were used for generating six co-expression module eigengenes (ME1 to ME11). The members of each ME are described in Supplementary Table 5b. (c) Enrichment of module eigengenes in cell type clusters. Atypical clusters showing similar patterns with a normal cell cluster were classified as the same lineage. We identified 5 different lineages (Ast, OD, ExN, InN, OPC) coded as different colors. Notably, Ast-L1/2/3 and OPC-L1/2 show excessively increased expression of ME6 or ME7, Ast or OPC signature ME, respectively. OPC-L2 shows upregulation of ME4, related to the cell cycle, implying that HME has many over-proliferating OPC-L cells. Excitatory neuronal lineage typically expresses ME5 and ME10, but ExN-L1/2 also shows increased expression of ME9, a signature of inhibitory neurons, compared to ExN1/2/3. OD-L cells are classified as OD lineage because they express excessive ME11, a signature to OD. U cluster, dominant in TSC, does not show a clear signature. The size and color of the dot plot are the Pearson correlation coefficient and corresponding non-adjusted asymptotic p-value derived from a two-sided Student’s t-test, respectively.
Extended Data Fig. 8
Extended Data Fig. 8. The validation of the snRNAseq result from HME-6593 shows that MCD dominant clusters are highly correlated with dysplastic cells in MCD.
(a-b) H&E (left) and RNAscope (right) for genes expressed highly in MCD brain (FGFR2, FGFR1, EGFR, top) or (FGFR3, PDGFRA bottom). Dashed lines: blood vessels. White/black arrows: dysplastic cells. One representative section is shown for each probe combination.
Extended Data Fig. 9
Extended Data Fig. 9. Expression patterns of individual MCD genes in the MCD snRNAseq dataset.
The gene members of each eigen module shown in Fig. 6d were colored according to the name of a given eigengene.
Extended Data Fig. 10
Extended Data Fig. 10. Functional implication of MCD genes in MCD snRNAseq dataset.
(a) The 75 MCD genes overlap with DEGs of MCDs in contrast to controls. p-values derived from permutation tests (10,000 times) show a chance to show this overlap in a random sampling of DEGs from 19909 protein-coding genes used in these DEGs. Red or blue coloring of gene names indicates upregulated or downregulated DEGs in MCDs compared to CTRLs, respectively. HME and TSC show significant overlap with the MCD genes whereas an FCD case with low VAF did not, which is probably because of low VAF. One-sided permutation test. (b) Cell-lineage specific DEGs compared to the according to normal cell lineage of CTRL represent alterations of mTOR downstream pathways, calcium dynamics, and synaptic functions across. Red dots in UMAPs indicate the cells that participated in the comparison. Top 10 enriched GO or KEGG terms representing lineage-specific DEGs.
Figure 1.
Figure 1.. Comprehensive genetic profiling and validation of somatic variants in 283 MCD patients.
(a) Representative MRI image of FCD-3558 (FCD type I), FCD-4514 (FCD type II), HME-1573, and composition MCD cohort. Yellow arrow and dash: affected brain regions. FCD-3558, MRI was non-lesional, the epileptic focus was mapped to the right frontal lobe (red dashed line) and resected. (b) Three-phase comprehensive genetic MCD profiling workflow, followed by quantification/validation of each variant with target amplicon sequencing (TASeq). Phase 1] 1000 × pilot screening of DNA with an 87-gene mTOR-related panel. Phase 2] 300 × whole-exome sequencing (WES) with best-practice somatic variant discovery for novel candidate genes. Phase 3] Cohort-level validation with an updated, high-confidence TASeq gene set arising from Phases 1 and 2. A subset of somatic mutations was functionally validated in mice. Annotation and correlation with gene networks, clinical data, and single-single-nucleus RNAseq. (c) 1181 sSNV calls were detected from all three phases, yielding 108 validated sSNVs. (d) Correlation between square-root transformed (sqrt-t) AmpliSeq/WES variant allele fraction (VAF) and TASeq VAF. Solid line: Simple linear regression (goodness of fit). Dashed lines: 95% confidence band. Spearman correlation coefficient ρ and corresponding two-tailed t-test p-value. (e) Oncoplot of 69 genes from 108 validated sSNVs. Top: most patients had one gene mutated, a few patients had more than one gene mutated, and patient HME-4144 had 11 different validated genes mutated. Grey: genes recurrently mutated in previous HME/FCD cohorts. *: genes recurrently mutated in our cohort. #: genes non-recurrently mutated but complementary to other cohorts of epilepsy-associated developmental lesions.
Figure 2.
Figure 2.. Genes mutated in MCD highlight four major gene networks.
(a) STRING DB pathway analysis of the 69 MCD discovered genes and six novel genes (a total of 75 genes) from recent publications identify MTOR/MAP kinase pathway (pink, Cluster 1), Calcium dynamics (green, Cluster 2), Synapse (purple, Cluster 3), Gene expression (blue, Cluster 4). Edge thickness: STRING confidence score. Node size and color: square root transformed (sqrt-t) number of patients carrying a given mutation and average VAF across all patients, respectively. Non-clustered orphan genes were listed at right. Red border: variant reported in COSMIC DB. (b) Gene Ontology (GO) analysis results confirm the functions of compositions in each network. Top GO terms or KEGG pathways based on strength. Strength calculated by STRING.
Figure 3.
Figure 3.. Selected novel MCD somatic variants show functional defects in embryonic mouse brain and patient samples.
(a) Validation of candidate mosaic variants in mice. (b) Two different mutations in novel FCD type II genes, RRAGA H226R and KLHL22 R38Q, but not a novel FCD type I gene, GRIN2C, disrupt cellular radial migration from the subventricular zone (SVZ). Below: two-way ANOVA and Sidak multiple comparisons with p-values of interaction between genotype and bin factor. * or # indicates a p-value in comparison between WT and mutant group, or EV and mutant group respectively. Ten bins from the surface of the cortex (top) to SVZ (bottom). Scale bar: 100 μm. Mean ± SEM (standard error mean). n=3, 3, 6, 3, 6, 4, 3 biologically independent animals for EV, RRAGA WT, RRAGA H226R, KLHL22 WT, KLHL22 R38Q, GRIN2C WT, and GRIN2C T529M, respectively. (c) Immunofluorescence in postnatal day 21 mouse cortices for KLHL22 and GRIN2C wild-type (WT) or mutant isoform. Neurons expressing mutant KLHL22 and GRIN2C recapitulate histological phenotypes shown in (d), with enlarged cell bodies (white arrow) compared to WT isoforms (WT control), whereas only neurons expressing KLHL22 but not GRIN2C mutant isoform display increased pS6 levels compared to control. Yellow dashed lines: examples of cell body size quantification. Two-tailed Mann-Whitney U-test. Dashed lines and dotted lines in the violin plots indicate median and quartiles, respectively. Scale bar: 20 μm. n=105 cells (3 mice), 70(3), 95(3), 107(3) for KLHL22 WT, KLHL22 R38Q, GRIN2C WT, and GRIN2C T529M, respectively. (d) H&E and phospho-S6 (pS6) staining of the resected brain from FCD-3560 and FCD-5157. One representative H&E or IF staining is shown for each patient case. The box area is zoomed in the middle image. Arrows: dysplastic cells. Right: Immunofluorescence (IF) for pS6 and NeuN. Note that dysplastic pS6-positive neurons with increased pS6 levels are present in FCD-3560 but not in FCD-5157. Scale bar: 60 μm on the left, 20 μm on the middle and right. ****p < 0.0001; *p < 0.05; ns, non-significant. ###p < 0.001. EV: empty vector.
Figure 4.
Figure 4.. Clinical phenotypic outcomes correlate with genotype-based classifications in MCD.
(a) Correlation heatmap for classification based on genetic information (y-axis) vs. International League Against Epilepsy (ILAE) classification based on histology (x-axis) using Pearson correlation. Shade: the value of the Phi coefficient. Note that Type IIA and HME are enriched with mTOR and Ubiquitination genes, while Type I is enriched in Glycosylation and depleted in MTOR and COSMIC genes. HME: hemimegalencephaly. (b) Correlation between classification based on genetic information and various clinical phenotypes. Shade: the value of Phi (binary data) or Pearson (continuous) correlation coefficient. For example, positron emission tomography (PET) hypometabolism is enriched in COSMIC genes and depleted in the MAPK pathway, whereas abnormal neurological examination is enriched in COSMIC genes. Raw data are in Supplementary Table 4.
Figure 5.
Figure 5.. Single-nucleus transcriptomes reveal MCD gene enrichment in radial glia and excitatory neurons in the developing human cortex.
(a) Uniform Manifold Approximation and Projection (UMAP) for single-nucleus transcriptome in 2nd-trimester fetal human telencephalon from a public dataset. (b) UMAP enrichment patterns of an eigengene using MCD genes. Note enrichment for excitatory neurons and radial glia (dark brown). vRG: vertical radial glia, tRG: truncated radial glia, RG-div: dividing radial glia, oRG: outer radial glia, EN: excitatory neuron, nEN: newborn excitatory neuron, IPC: intermediate progenitor cell, STR: striatum, IN: interneuron, CTX: cortex, MGE: medial ganglionic eminence, CGE: central ganglionic eminence. (c) Quantification of enrichment of (b) based on cell types, showing enrichment for RG-div. (d) Four eigengenes decomposed from (b). (e) Quantification of enrichment of (d) based on cell types showing enrichment in dividing radial glia, microglia, and inhibitory cortical neurons from the medial ganglionic eminence (MGE). Net expression: Relative and scaled net expression level of a given eigengene generated by a defined gene list. The size and color of the dot plots in (c) and (e) indicate Pearson correlation coefficient r and corresponding non-adjusted asymptotic p-value derived from a two-sided Student’s t-test, respectively.
Figure 6.
Figure 6.. Single-nucleus transcriptomes showed MCD gene expression enriched in MCD-specific cell types.
(a) UMAP for the 33,206 single-nucleus transcriptomes from cortical resections, revealing disrupted cell clusters, especially for HME and TSC brain, but only mild disruption in FCD brain. Cell type classification. Ast: astrocyte, EC: endothelial cells, ExN: excitatory neuron, ImmOD: immature oligodendrocyte, InN: inhibitory neuron, MG: microglia, OD: oligodendrocyte, OPC: Oligodendrocyte precursor cells, U: unidentified. (b) UMAP is split by disease condition. (c) The proportion of disease conditions for each cell type. (d) Expression pattern of selected marker genes in normal human cortex vs. several atypical markers related to brain cancer or Alzheimer’s disease. Color scale: Average expression level. (e) Eigengene with all 75 MCD genes and quantification of enrichment based on cell types. (f) four genes decomposed from (e) and quantification of results. Net expression: Relative and scaled net expression level of a given eigengene generated by a defined gene list. The size and color of the dot plots in (e) and (f) are Pearson correlation coefficient r and corresponding non-adjusted asymptotic p-value derived from a two-sided Student’s t-test, respectively.

References

    1. Leventer RJ, Guerrini R & Dobyns WB Malformations of cortical development and epilepsy. Dialogues Clin Neurosci 10, 47–62 (2008). - PMC - PubMed
    1. Barkovich AJ, Dobyns WB & Guerrini R Malformations of cortical development and epilepsy. Cold Spring Harb Perspect Med 5, a022392 (2015). - PMC - PubMed
    1. Blumcke I et al. The clinicopathologic spectrum of focal cortical dysplasias: a consensus classification proposed by an ad hoc Task Force of the ILAE Diagnostic Methods Commission. Epilepsia 52, 158–74 (2011). - PMC - PubMed
    1. Choi SA & Kim KJ The Surgical and Cognitive Outcomes of Focal Cortical Dysplasia. J Korean Neurosurg Soc 62, 321–327 (2019). - PMC - PubMed
    1. Krsek P et al. Different features of histopathological subtypes of pediatric focal cortical dysplasia. Ann Neurol 63, 758–69 (2008). - PubMed

Method-only references

    1. Kim S et al. Strelka2: fast and accurate calling of germline and somatic variants. Nat Methods 15, 591–594 (2018). - PubMed
    1. Benjamin D et al. Calling Somatic SNVs and Indels with Mutect2. bioRxiv (2019).
    1. Yang X et al. Genomic mosaicism in paternal sperm and multiple parental tissues in a Dravet syndrome cohort. Sci Rep 7, 15677 (2017). - PMC - PubMed
    1. O'Roak BJ et al. Multiplex targeted sequencing identifies recurrently mutated genes in autism spectrum disorders. Science 338, 1619–22 (2012). - PMC - PubMed
    1. Krumm N et al. Excess of rare, inherited truncating mutations in autism. Nat Genet 47, 582–8 (2015). - PMC - PubMed

Publication types