. 2023 Jun;44(6):1206-1216.
doi: 10.1038/s41401-022-01041-y. Epub 2023 Jan 12.

GPR97 deficiency ameliorates renal interstitial fibrosis in mouse hypertensive nephropathy

Affiliations

GPR97 deficiency ameliorates renal interstitial fibrosis in mouse hypertensive nephropathy

Ji-Chao Wu et al. Acta Pharmacol Sin. 2023 Jun.

Abstract

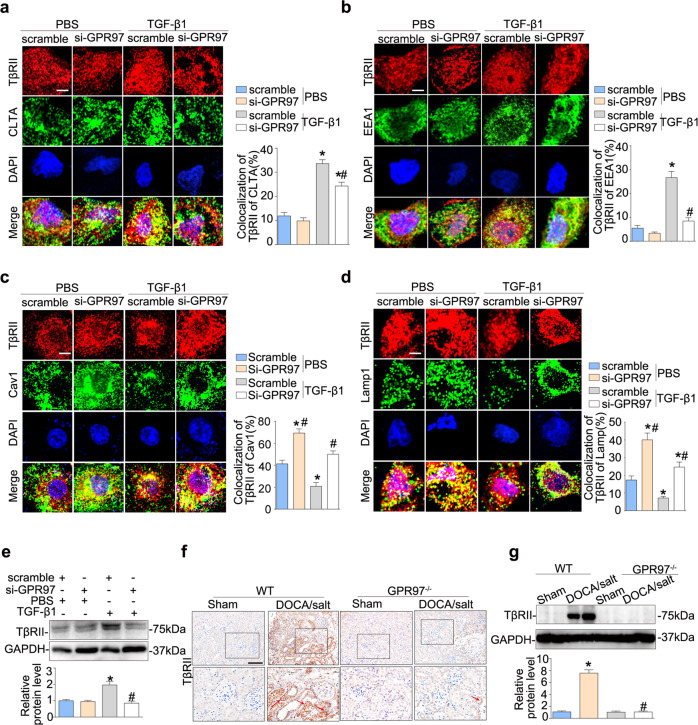
Hypertensive nephropathy (HTN) ranks as the second-leading cause of end-stage renal disease (ESRD). Accumulating evidence suggests that persistent hypertension injures tubular cells, leading to tubulointerstitial fibrosis (TIF), which is involved in the pathogenesis of HTN. G protein-coupled receptors (GPCRs) are implicated in many important pathological and physiological processes and act as important drug targets. In this study, we explored the intrarenal mechanisms underlying hypertension-associated TIF, and particularly, the potential role of GPR97, a member of the adhesion GPCR subfamily, in TIF. A deoxycorticosterone acetate (DOCA)/salt-induced hypertensive mouse model was used. We revealed a significantly upregulated expression of GPR97 in the kidneys, especially in renal tubules, of the hypertensive mice and 10 patients with biopsy-proven hypertensive kidney injury. GPR97-/- mice showed markedly elevated blood pressure, which was comparable to that of wild-type mice following DOCA/salt treatment, but dramatically ameliorated renal injury and TIF. In NRK-52E cells, we demonstrated that knockdown of GPR97 suppressed the activation of TGF-β signaling by disturbing small GTPase RhoA-mediated cytoskeletal reorganization, thus inhibiting clathrin-mediated endocytosis of TGF-β receptors and subsequent Smad activation. Collectively, this study demonstrates that GPR97 contributes to hypertension-associated TIF at least in part by facilitating TGF-β signaling, suggesting that GPR97 is a pivotal intrarenal factor for TIF progression under hypertensive conditions, and therapeutic strategies targeting GPR97 may improve the outcomes of patients with HTN.

Keywords: GPR97; Smad; TGF-β; endocytosis; hypertensive nephropathy; tubulointerstitial fibrosis.


Conflict of interest statement

The authors declare no competing interests.

Figures

Fig. 1
Fig. 1. The level of GPR97 was significantly upregulated in the kidneys of DOCA/salt-induced hypertensive mice.
a The mRNA levels of GPR97 in the kidneys of DOCA/salt-induced hypertensive mice. *P < 0.05 versus sham-operated WT mice (n = 6). b Western blot analysis of the relative protein levels of GPR97 in the kidneys of DOCA/salt-induced hypertensive mice. *P < 0.05 versus sham-operated WT mice (n = 6). c Representative images of immunohistochemical staining of GPR97 in the kidneys of DOCA/salt-induced hypertensive mice. (n = 6). d Representative immunofluorescent images showing the colocalization of GPR97 with AQP1, AQP3 and Calbindin-D28k in the kidneys of DOCA/salt-induced hypertensive mice. *P < 0.05 versus sham-operated WT mice (n = 6). e Western blot analysis of GPR97 expression in the different groups of NRK-52E cells. *P < 0.05 versus control cells (n = 6). f Representative photomicrographs of GPR97 immunohistochemical staining in human renal cortical tissue from normal subjects (n = 9) and patients with hypertensive nephropathy (n = 10). *P < 0.05 versus normal. g Correlation analysis between the renal staining intensity of GPR97 and SCr levels (μmol/L) in all subjects (whose SCr was available). Arrows indicate positive staining. Scale bar = 50 μm.
Fig. 2
Fig. 2. GPR97 deficiency ameliorated kidney injury and tubulointerstitial fibrosis in DOCA/salt-induced hypertensive mice.
a The genotype of GPR97−/− mice was confirmed by PCR and tail preparation. b qRT‒PCR analysis of GPR97 expression in the kidneys of WT mice and GPR97−/− mice. *P < 0.05 versus WT mice (n = 6). c The urine albumin-to-creatinine ratio (UACR) in the different groups of mice. *P < 0.05 versus sham-operated WT mice, #P < 0.05 versus DOCA/salt-treated WT mice (n = 6). d Representative images of PAS staining showing typical changes in renal structure. Arrows indicate injured tubules. e Masson’s trichrome staining of kidneys from the different groups of mice. f Western blot analysis of collagen-1 and fibronectin expression in the different groups of mice. *P < 0.05 versus sham-operated WT mice, #P < 0.05 versus DOCA/salt-treated WT mice (n = 6). g Representative images of immunohistochemical staining of Collagen-1 in the kidneys in the different groups of mice. h Western blot analysis of E-cadherin expression in the kidneys in the different groups of mice. *P < 0.05 versus sham-operated WT mice, #P < 0.05 versus DOCA/salt-treated WT mice (n = 6). i Representative images of immunohistochemical staining of E-cadherin in kidneys in the different groups of mice. j Western blot analysis of Slug and Snail expression in the kidneys in the different groups of mice. *P < 0.05 versus sham-operated WT mice, #P < 0.05 versus DOCA/salt-treated WT mice (n = 6). k Representative images of immunohistochemical staining of Snail1 in kidneys in the different groups of mice. Arrows indicate positive staining. Scale bar = 50 μm. l Western blot analysis of α-SMA expression in the kidneys in the different groups of mice. *P < 0.05 versus sham-operated WT mice, #P < 0.05 versus DOCA/salt-treated WT mice (n = 6). m Representative images of immunohistochemical staining of α-SMA in kidneys in the different groups of mice. Arrows indicate positive staining. Scale bar = 50 μm.
Fig. 3
Fig. 3. GPR97 silencing attenuated the TGF-β1-induced fibrotic phenotype of NRK-52E cells.
a Western blot analysis confirmed the silencing efficiency in NRK-52E cells transfected with siRNA-GPR97. *P < 0.05 versus scramble siRNA-transfected cells (n = 6). b, c Western blot analysis of Collagen-1, Fibronectin, Slug, Snail1 and α-SMA expression in NRK-52E cells after the different treatments. *P < 0.05 versus PBS-treated cells transfected with scramble siRNA, #P < 0.05 versus TGF-β1-treated cells transfected with scramble siRNA (n = 6). d Representative immunofluorescent images showing the expression and location of E-cadherin in NRK-52E cells after the different treatments. NRK-52E cells were treated with 10 ng/mL TGF-β1 for 24 h. The arrow indicates the location of E-cadherin at cell junctions. *P < 0.05 versus PBS-treated cells transfected with scramble siRNA, #P < 0.05 versus TGF-β1-treated cells transfected with scramble siRNA (n = 6). Scale bar = 20 μm.
Fig. 4
Fig. 4. GPR97 participated in the activation of TGF-β/Smad signaling in tubule epithelial cells.
a Western blot analysis of p-Smad2 and Smad2 levels in the kidneys from the different groups of mice. *P < 0.05 versus sham-operated WT mice, #P < 0.05 versus DOCA/salt-treated WT mice (n = 6). b Representative images of immunohistochemical staining of Smad2 in kidneys from the different groups of mice. Arrows indicate positive staining. Scale bar = 50 μm. c Western blot analysis of p-Smad2 and Smad2 levels in NRK-52E cells after different treatments (NRK-52E cells were treated with 10 ng/mL TGF-β1 for 30 min). *P < 0.05 versus scramble group, #P < 0.05 versus TGF-β1 treatment group (n = 6). d Western blot analysis of p-Smad3 and Smad3 levels in NRK-52E cells after different treatments. *P < 0.05 versus scramble group, #P < 0.05 versus TGF-β1 treatment group (n = 6). e, f Representative immunofluorescent images showing the location of Smad2 and Smad4 in NRK-52E cells after different treatments. Scale bar = 20 μm. (NRK-52E cells were treated with 10 ng/mL TGF-β1 for 24 h).
Fig. 5
Fig. 5. GPR97 silencing reduced clathrin-mediated TβRII endocytosis in TGF-β1-treated NRK-52E cells.
ad Representative confocal microscopic images and summarized data showing the colocalization of TβRII with clathrin (CLTA), EEA1, caveolin-1 (Cav1), and Lamp1 in NRK-52E cells after different treatments (NRK-52E cells starved for 24 h then incubated with 10 ng/mL TGF-β1 for 30 min, summarized at least 15 cells). Scale bar = 5 μm. *P < 0.05 versus scramble group, #P < 0.05 versus TGF-β1 treatment group (n = 6). e Western blot analysis of TβRII expression in NRK-52E cells after different treatments (NRK-52E cells were treated with 10 ng/mL TGF-β1 for 24 h). *P < 0.05 versus scramble group, #P < 0.05 versus TGF-β1 treatment group (n = 6). f Representative images of immunohistochemical staining of TβRII in kidneys from the different groups of mice. Arrows indicate positive staining. Scale bar = 50 μm. g Western blot analysis of TβRII expression in the different groups of mice. *P < 0.05 versus sham-operated WT mice, #P < 0.05 versus DOCA/salt-treated WT mice (n = 6).
Fig. 6
Fig. 6. GPR97 modulates the activity of RhoA, which participates in the activation of the TGF-β1 signaling pathway.
a Representative immunofluorescent images of F-actin staining in NRK-52E cells after different treatments (NRK-52E cells were treated with 10 ng/mL TGF-β1 for 24 h). Scale bar = 20 μm. b Representative images of immunohistochemical staining of RhoA in kidneys from the different groups of mice. Scale bar = 50 μm. c Western blot analysis of RhoA levels in the different groups of mice (n = 6). *P < 0.05 versus sham-operated WT mice, #P < 0.05 versus DOCA/salt-treated WT mice (n = 6). d RhoA-GTP and RhoA levels in NRK-52E cells after different treatments (n = 6). *P < 0.05 versus scramble group, #P < 0.05 versus TGF-β1 treatment group. e Western blot analysis of p-Smad2 levels in NRK-52E cells after different treatments (n = 6). *P < 0.05 versus scramble group, #P < 0.05 versus TGF-β1 treatment group. &P < 0.05 versus si-GPR97 and TGF-β1 treatment group. f, g Representative immunofluorescent images and Western blot analysis showing the relative protein levels of HIC-5 in NRK-52E cells after different treatments. Scale bar = 20 μm. (n = 6). *P < 0.05 versus scramble group, #P < 0.05 versus TGF-β1 treatment group. h, i Representative immunofluorescent images and Western blot gel documents and summarized data showing the relative protein levels of YAP in NRK-52E cells after different treatments. Scale bar = 20 μm. (n = 6). *P < 0.05 versus scramble group, #P < 0.05 versus TGF-β1 treatment group. j, k Representative images of immunohistochemical staining of HIC-5 and YAP in kidneys from the different groups of mice. Scale bar = 50 μm. Arrows indicate positive staining.
Fig. 7
Fig. 7. Schematic depicting GPR97 as a novel regulator of TGF-β signaling.
GPR97-mediated RhoA activation is as a key mechanism for TGF-β signaling activation by promoting the redistribution of F-actin, thereby enhancing clathrin-mediated endocytosis of TGF-β receptors and subsequent Smad activation.

References

    1. Poulter NR, Prabhakaran D, Caulfield M. Hypertension. Lancet. 2015;386:801–12. doi: 10.1016/S0140-6736(14)61468-9. - DOI - PubMed
    1. Kakitapalli Y, Ampolu J, Madasu SD, Sai Kumar MLS. Detailed review of chronic kidney disease. Kidney Dis (Basel) 2020;6:85–91. doi: 10.1159/000504622. - DOI - PMC - PubMed
    1. Udani S, Lazich I, Bakris GL. Epidemiology of hypertensive kidney disease. Nat Rev Nephrol. 2011;7:11–21. doi: 10.1038/nrneph.2010.154. - DOI - PubMed
    1. Wright JT, Jr., Bakris G, Greene T, Agodoa LY, Appel LJ, Charleston J, et al. Effect of blood pressure lowering and antihypertensive drug class on progression of hypertensive kidney disease: results from the AASK trial. JAMA. 2002;288:2421–31. doi: 10.1001/jama.288.19.2421. - DOI - PubMed
    1. Ruggenenti P, Perna A, Loriga G, Ganeva M, Ene-Iordache B, Turturro M, et al. Blood-pressure control for renoprotection in patients with non-diabetic chronic renal disease (REIN-2): multicentre, randomised controlled trial. Lancet. 2005;365:939–46. doi: 10.1016/S0140-6736(05)71082-5. - DOI - PubMed

Substances

Supplementary concepts