. 2023 May 22;119(5):1202-1217.
doi: 10.1093/cvr/cvad010.

STRA6 is essential for induction of vascular smooth muscle lineages in human embryonic cardiac outflow tract development

Affiliations

STRA6 is essential for induction of vascular smooth muscle lineages in human embryonic cardiac outflow tract development

Chikai Zhou et al. Cardiovasc Res. .

Abstract

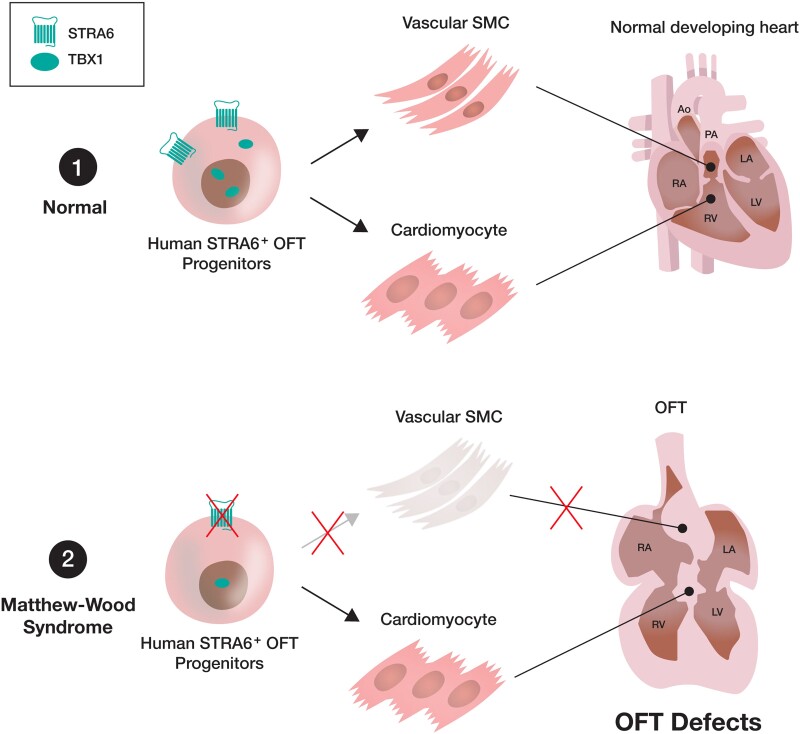
Aims: Retinoic acid (RA) signalling is essential for heart development, and dysregulation of the RA signalling can cause several types of cardiac outflow tract (OFT) defects, the most frequent congenital heart disease (CHD) in humans. Matthew-Wood syndrome is caused by inactivating mutations of a transmembrane protein gene STRA6 that transports vitamin A (retinol) from extracellular into intracellular spaces. This syndrome shows a broad spectrum of malformations including CHD, although murine Stra6-null neonates did not exhibit overt heart defects. Thus, the detailed mechanisms by which STRA6 mutations could lead to cardiac malformations in humans remain unclear. Here, we investigated the role of STRA6 in the context of human cardiogenesis and CHD.

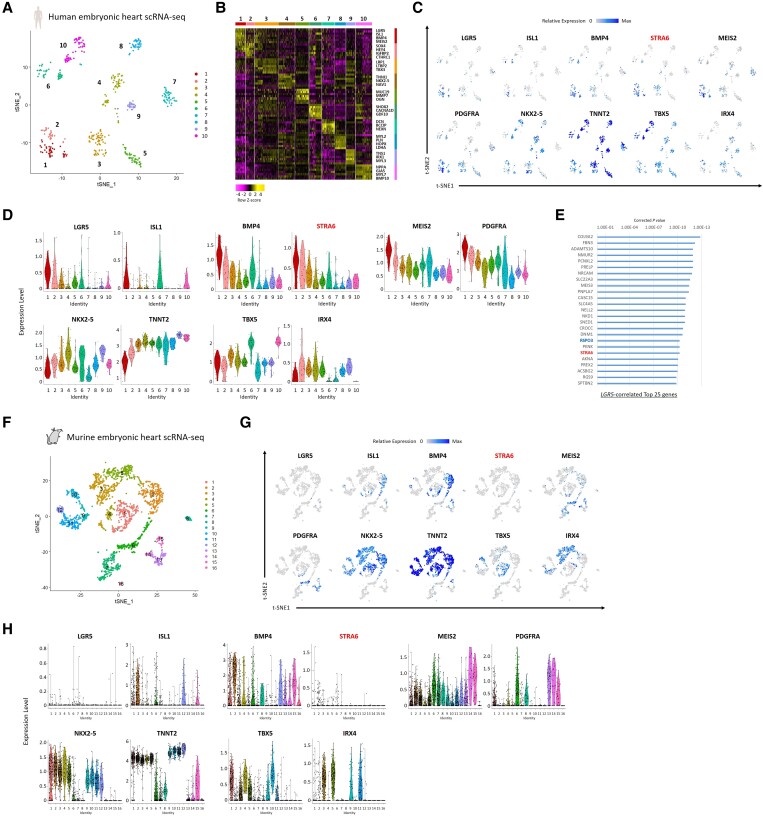
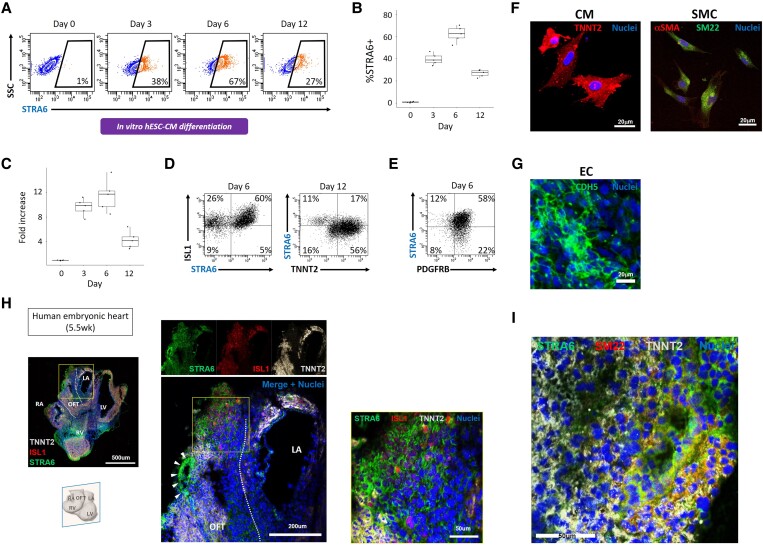
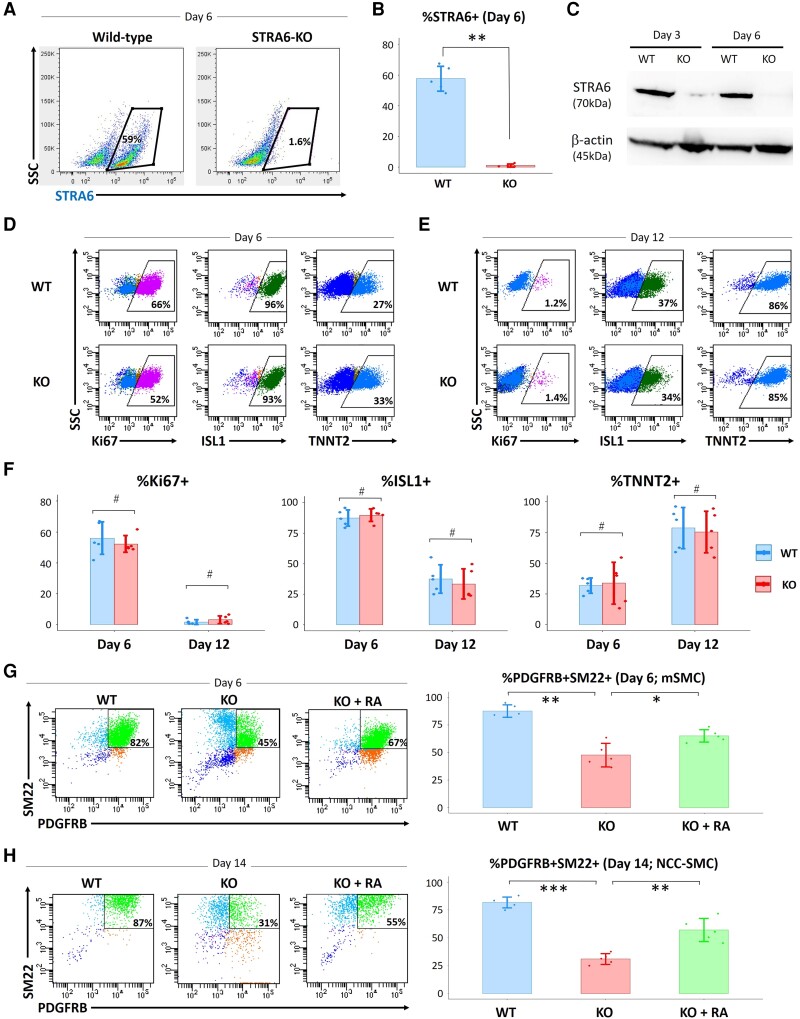
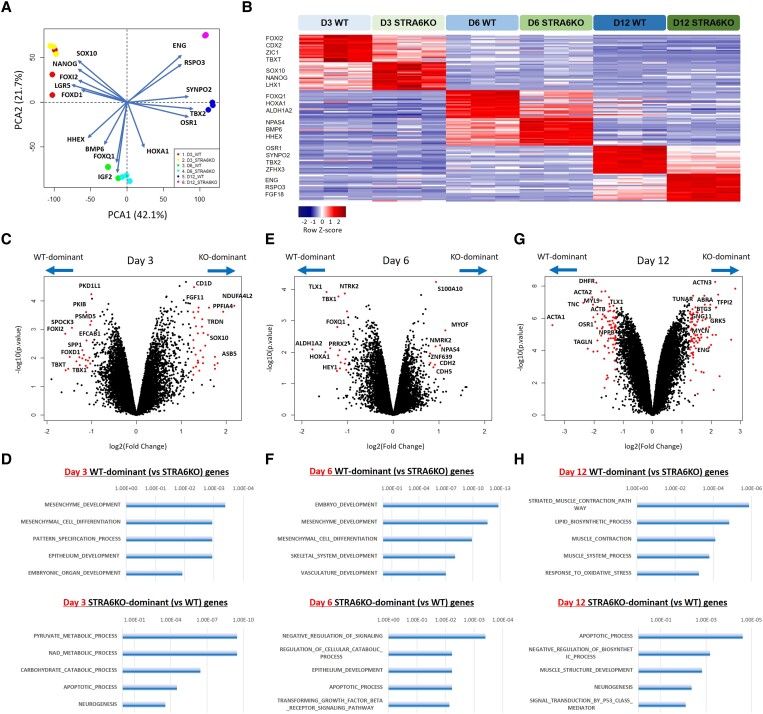
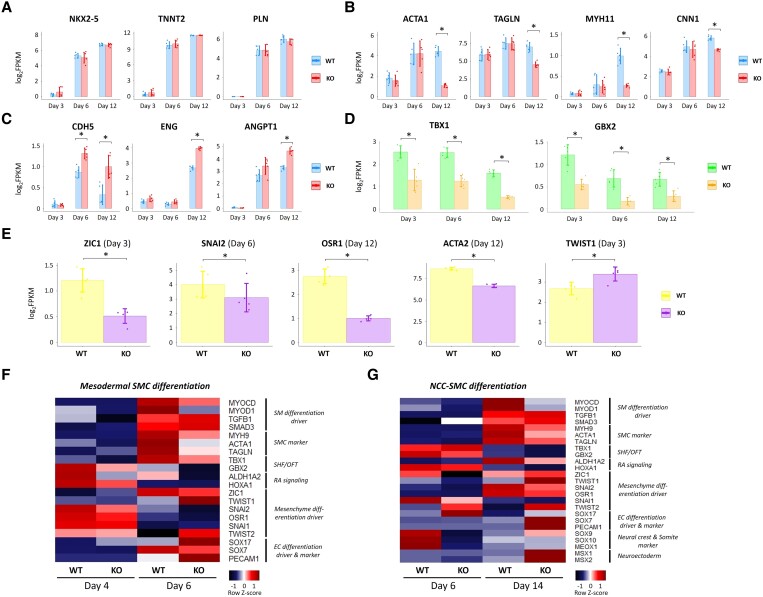
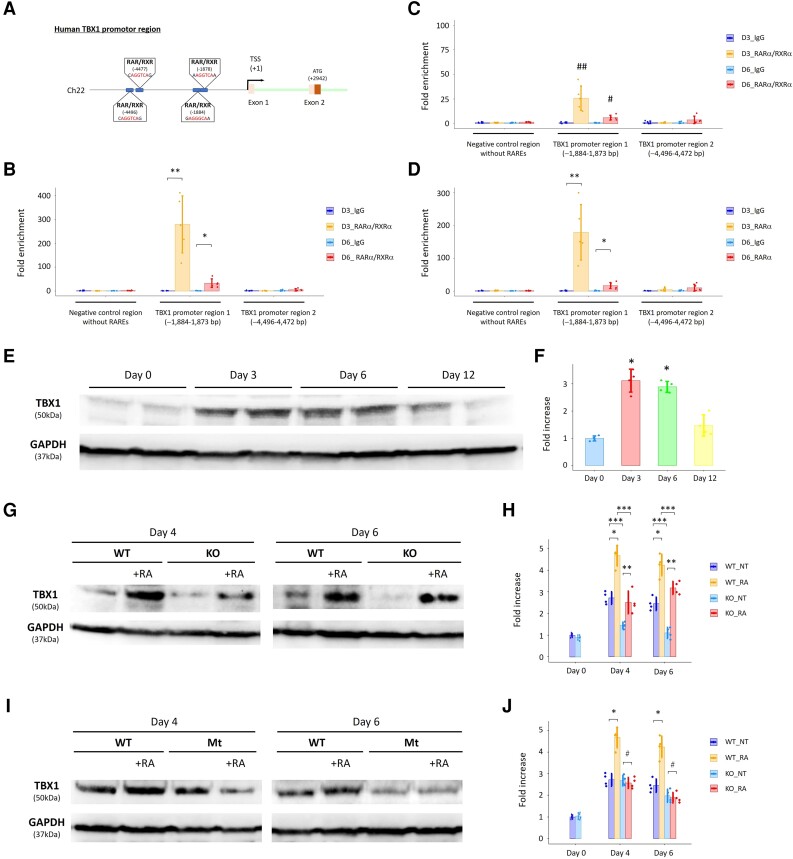
Methods and results: To gain molecular signatures in species-specific cardiac development, we first compared single-cell RNA sequencing (RNA-seq) datasets, uniquely obtained from human and murine embryonic hearts. We found that while STRA6 mRNA was much less frequently expressed in murine embryonic heart cells derived from the Mesp1+ lineage tracing mice (Mesp1Cre/+; Rosa26tdTomato), it was expressed predominantly in the OFT region-specific heart progenitors in human developing hearts. Next, we revealed that STRA6-knockout human embryonic stem cells (hESCs) could differentiate into cardiomyocytes similarly to wild-type hESCs, but could not differentiate properly into mesodermal nor neural crest cell-derived smooth muscle cells (SMCs) in vitro. This is supported by the population RNA-seq data showing down-regulation of the SMC-related genes in the STRA6-knockout hESC-derived cells. Further, through machinery assays, we identified the previously unrecognized interaction between RA nuclear receptors RARα/RXRα and TBX1, an OFT-specific cardiogenic transcription factor, which would likely act downstream to STRA6-mediated RA signalling in human cardiogenesis.

Conclusion: Our study highlights the critical role of human-specific STRA6 progenitors for proper induction of vascular SMCs that is essential for normal OFT formation. Thus, these results shed light on novel and human-specific CHD mechanisms, driven by STRA6 mutations.

Keywords: Cardiac outflow tract; Congenital heart disease; Heart development; Matthew-Wood syndrome; Retinoic acid; Single-cell RNA-seq; Smooth muscle cell.


Conflict of interest statement

Conflict of interest: The authors declare that the research was conducted in the absence of any commercial or financial relationships that could be construed as a potential conflict of interest.

Figures

Graphical Abstract
Graphical Abstract
Figure 1
Figure 1
Single-cell RNA-seq analyses of human and murine embryonic hearts. (A) The tSNE analysis using the single-cell RNA-seq dataset, which was obtained from human embryonic hearts (4.5–10 weeks of foetal ages), segregated 458 individual cardiac cells into 10 molecularly distinct clusters, including a cono-ventricular region-specific heart progenitor (CVP; Cluster #1). (B) A heatmap image showing the representative differential expression genes in each of the 10 clusters in (A). (C) Feature plots of the SHF/OFT marker (CVP-enriched) genes as well as the pan-cardiac/FHF/developing CM marker genes with STRA6 on the tSNE plots in (A). (D) Violin plots of the same genes as in (C), in the segregated 10 clusters of the human embryonic heart-derived single cells. (E) The top 25 genes correlated with the expression of the CVP-specific gene LGR5 in single-cell RNA-seq data of human embryonic hearts. Corrected P-value for each gene was calculated by Guilt-by-Association and correlation analysis. (F) The tSNE analysis segregated a total of 2079 single cardiac cells, obtained from embryonic hearts (E9.5, E10.5, and E14.5) of the Mesp1+ lineage tracing mice (Mesp1Cre/+; Rosa26tdTomato), into 16 clusters including FHF progenitors (Cluster #1) and SHF progenitors (Cluster #2). (G) Feature plots of the SHF/pan-cardiac/FHF/developing CM marker genes with STRA6 on the tSNE plots in (F). (H) Violin plots of the same genes as in (G), in the segregated 16 clusters of the murine embryonic heart-derived single cells.
Figure 2
Figure 2
Human STRA6+ heart progenitors in in vitro and in vivo cardiogenesis. (A) Flow cytometry analysis showing the time course of STRA6 protein expression levels in in vitro hESC-derived cells during CM differentiation. SSC, side scatter. (B) Statistical analysis of the %STRA6+ population on FACS in (A). (C) Quantitative PCR results of STRA6 mRNA expression in hESC-derived cells during CM differentiation. (D) Flow cytometry analysis for detection of ISL1+ and/or STRA6+ cells at Day 6 (left) and of TNNT2+ and/or STRA6+ cells at Day 12 (right) in CM differentiation. (E) Flow cytometry analysis for detection of PDGFRB+ and/or STRA6+ cells at Day 6 in mesodermal SMC differentiation. (F) Differentiated CMs (left) and SMCs (right) derived from the STRA6+ progenitor clones that were initially harvested on Day 3 in hESC-CM differentiation in the clonal assay. (G) Differentiated ECs derived from the STRA6 cell-derived clone initially harvested on Day 3 in the clonal assay. (H) Immunohistochemistry of the sectioned human embryonic heart at 5.5 weeks of foetal age. The middle images are the enlarged ones of a yellow square in the left image. The right image is the enlarged one of a yellow square in the middle image. Coronal view. The white dotted lines (left and middle) indicate the OFT structure. Arrowheads (middle) point to the ISL1TNNT2STRA6+ vascular structure, indicating dividing OFT. In contrast, a number of STRA6+ cells co-expressing ISL1 and/or TNNT2 are also seen in the OFT region (right). LA, left atria; LV, left ventricle; OFT, outflow tract; RA, right atria; RV, right ventricle. (I) The ISL1TNNT2STRA6+ cells in the vascular structure in OFT in (H) co-expressed an SMC marker SM22.
Figure 3
Figure 3
Impacts of STRA6 deletion in the in vitro hESC differentiation into CMs and SMCs. (A and B) Flow cytometry analysis showing the ratios of wild-type (WT) and STRA6-KO hESC-derived STRA6+ cells at Day 6 in CM differentiation. SSC, side scatter. **P < 0.01. (C) Western blotting analysis for expression of STRA6 protein with β-actin protein (a loading control) in WT and STRA6-KO cells at Days 3 and 6 in hESC-CM differentiation. (D and E) Representative images on flow cytometry analysis showing the ratios of a cell proliferation marker Ki67+ (left), an SHF/heart progenitor marker ISL1+ (middle), and a differentiated CM marker TNNT2+ (right) in WT (top) and STRA6-KO (bottom) cells at Days 6 (D) and 12 (E) in hESC-CM differentiation. (F) Statistical data of the ratios of %Ki67+ (left), %ISL1+ (middle), and %TNNT2+ (right) in (D) and (E). #P = not significant. (G) Flow cytometry analysis and statistical data showing the ratios of vascular SMCs (PDGFRB+SM22+) at Day 6 in mesodermal SMC (mSMC) differentiation of WT and STRA6-KO hESCs with or without treatment with retinoic acid (RA, 0.5 μM) during Days 1–6. *P < 0.05 and **P < 0.01. (H) Flow cytometry analysis and statistical data showing the ratios of vascular SMCs (PDGFRB+SM22+) at Day 14 in NCC-derived SMC differentiation of WT and STRA6-KO hESCs with or without treatment with RA (0.5 μM) during Days 6–10. **P < 0.01 and ***P < 0.001. Differences between groups were examined with one-way ANOVA followed by Tukey–Kramer post hoc test.
Figure 4
Figure 4
Population RNA-seq analysis showcases clearly differential molecular signatures between WT and STRA6-KO cells during CM differentiation. (A) The principal component analysis and the biplot using the 18 population RNA-seq data of WT and STRA6-KO cells harvested at Days 3, 6, and 12 in hESC-CM differentiation (3 biological replicates). (B) Differential gene expression analysis of the six cell groups, i.e. WT and STRA6-KO hESC-derived cells at Days 3, 6, and 12 in CM differentiation. A heatmap showing the representative differential expression genes in each of the six groups. (C, E, and G) Volcano plots visualizing differential gene expression analysis with the limma package between WT and STRA6-KO hESC-derived cells at Days 3 (C), 6 (E), and 12 (G) in CM differentiation, respectively. For each gene, the average difference [log2(Fold change)] between the cell groups on the same day was plotted against the power to discriminate between groups [−log10(P-value)]. Top-scoring genes for both metrics are indicated as red dots, and representative differential expression genes’ names are labelled. (D, F, and H) The gene set enrichment analysis (GSEA) was performed using the top 250 WT or STRA6-KO cell-enriched genes with the GSEA software (Broad Institute; http://www.gsea-msigdb.org/gsea/). Bar graphs showing the representative gene ontology (GO) terms specific to WT (top) or STRA6-KO cells (bottom) at Days 3 (D), 6 (F), and 12 (H), respectively.
Figure 5
Figure 5
STRA6 deletion down-regulates expression of vascular SMC-related genes and mesenchyme differentiation drivers in cells during CM and SMC differentiation. (AC) Comparisons of the CM (A), SMC (B), and EC (C) marker genes’ expression between WT and STRA6-KO cells at Days 3, 6, and 12 in hESC-CM differentiation. *P < 0.05. (D) Comparisons of the TBX1 and GBX2 genes’ expression between WT and STRA6-KO cells at Days 3, 6, and 12 in hESC-CM differentiation. *P < 0.05. (E) Comparisons of gene expression of ZIC1 (Day 3), SNAI2 (Day 6), OSR1 (Day 12), ACTA2 (Day 12), and TWIST1 (Day 3) between WT and STRA6-KO cells in CM differentiation. *P < 0.05. Differences between groups were examined with Student’s t-test. (F and G) Quantitative PCR-based gene expression heatmap of the representative SMC differentiation-related genes between WT and STRA6-KO cells at Days 4 and 6 in mesodermal SMC differentiation (left) and at Days 6 and 14 in NCC-SMC differentiation (right).
Figure 6
Figure 6
ChIP assays highlight the human-specific binding site of RARα/RXRα complexes on the TBX1 promoter region. (A) Schema showing novel (human-specific) and putative RAR/RXR binding sites (i.e. RARE) on the human TBX1 promoter region. (B) The ChIP assays demonstrated that recruitment of RARα/RXRα complexes onto one of the novel RARE sites of the human TBX1 promoter (−1884–1873 bp) was augmented at Days 3 (D3) and 6 (D6) in CM differentiation of WT hESCs. *P < 0.01 and **P < 0.0001 vs. IgG (negative control). (C) The ChIP assays using STRA6-KO cells demonstrated that RARα/RXRα complexes were also recruited onto the identified RARE site of the human TBX1 promoter (−1884–1873 bp) at Days 3 and 6 in CM differentiation but to a much lesser degree compared with that in WT cells in (B). #P < 0.01 vs. IgG and vs. D6_RARα/RXRα in WT (B). ##P < 0.001 vs. IgG and vs. D3_RARα/RXRα in WT (B). (D) The ChIP assays using only the anti-RARα antibody demonstrated that recruitment of RARα onto the identified RARE site of the human TBX1 promoter (−1884–1873 bp) was augmented at Days 3 and 6 in CM differentiation of WT hESCs again. *P < 0.01 and **P < 0.0001 vs. IgG. (E) Western blotting analysis for expression of TBX1 protein with GAPDH protein (a loading control) in WT cells at Days 0, 3, 6, and 12 in hESC-CM differentiation. (F) Quantitative results in (E). *P < 0.01 vs. Day 0. (G) Comparison of expression of TBX1 protein between WT and STRA6-KO cells at Days 4 and 6 in hESC-CM differentiation with or without treatment with retinoic acid (RA, 0.5 μM) during Days 3–7. GAPDH was used as a loading control. (H) Quantitative results in (G). NT, normal treatment (without adding RA). *P < 0.01 between the NT-administered and RA-co-administered WT cells at Days 4 and 6, respectively. **P < 0.05 between the NT-administered and RA-co-administered STRA6-KO cells at Days 4 and 6, respectively. ***P < 0.01 between WT and STRA6-KO cells under the same treatment conditions at Days 4 and 6, respectively. (I) Comparison of expression of TBX1 protein between WT and TBX1 promoter-mutant (Mt) cells at Days 4 and 6 in hESC-CM differentiation with or without treatment with RA (0.5 μM) during Days 3–7. GAPDH was used as a loading control. (J) Quantitative results in (I). *P < 0.01 between the NT-administered and RA-co-administered WT cells at Days 4 and 6, respectively. #P = not significant between the NT-administered and RA-co-administered TBX1 promoter-mutant cells at Days 4 and 6, respectively. Differences between groups were examined with one-way ANOVA followed by Tukey–Kramer post hoc test.

References

    1. Vincent SD, Buckingham ME. How to make a heart: the origin and regulation of cardiac progenitor cells. Curr Top Dev Biol 2010;90:1–41. - PubMed
    1. Sahara M, Santoro F, Chien KR. Programming and reprogramming a human heart cell. EMBO J 2015;34:710–738. - PMC - PubMed
    1. Stefanovic S, Etchevers HC, Zaffran S. Outflow tract formation-embryonic origins of conotruncal congenital heart disease. J Cardiovasc Dev Dis 2021;8:42. - PMC - PubMed
    1. Sirbu OI, Zhao X, Duester G. Retinoic acid controls heart anteroposterior patterning by down-regulating Isl1 through the Fgf8 pathway. Dev Dyn 2008;237:1627–1635. - PMC - PubMed
    1. Sakabe M, Kokubo H, Nakajima Y, Saga Y. Ectopic retinoic acid signaling affects outflow tract cushion development through suppression of the myocardial Tbx2-Tgfβ2 pathway. Development 2012;139:385–395. - PubMed

Publication types