. 2023 Jan 12;6(1):22.
doi: 10.1038/s42003-022-04303-x.

OxPhos defects cause hypermetabolism and reduce lifespan in cells and in patients with mitochondrial diseases

Affiliations

OxPhos defects cause hypermetabolism and reduce lifespan in cells and in patients with mitochondrial diseases

Gabriel Sturm et al. Commun Biol. .

Abstract

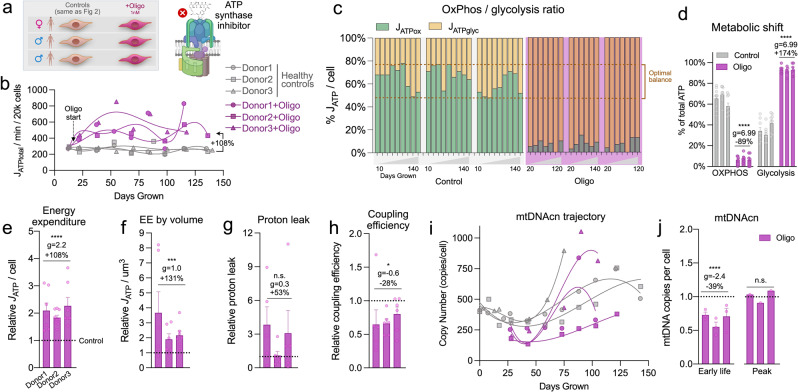
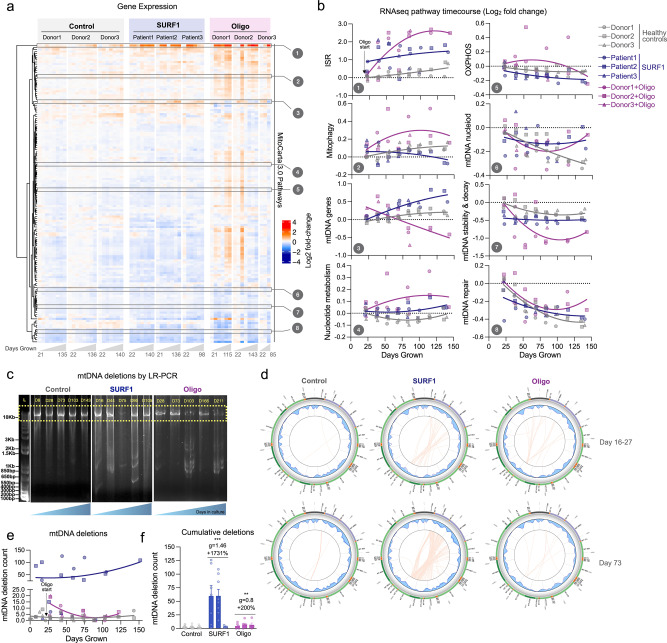
Patients with primary mitochondrial oxidative phosphorylation (OxPhos) defects present with fatigue and multi-system disorders, are often lean, and die prematurely, but the mechanistic basis for this clinical picture remains unclear. By integrating data from 17 cohorts of patients with mitochondrial diseases (n = 690) we find evidence that these disorders increase resting energy expenditure, a state termed hypermetabolism. We examine this phenomenon longitudinally in patient-derived fibroblasts from multiple donors. Genetically or pharmacologically disrupting OxPhos approximately doubles cellular energy expenditure. This cell-autonomous state of hypermetabolism occurs despite near-normal OxPhos coupling efficiency, excluding uncoupling as a general mechanism. Instead, hypermetabolism is associated with mitochondrial DNA instability, activation of the integrated stress response (ISR), and increased extracellular secretion of age-related cytokines and metabokines including GDF15. In parallel, OxPhos defects accelerate telomere erosion and epigenetic aging per cell division, consistent with evidence that excess energy expenditure accelerates biological aging. To explore potential mechanisms for these effects, we generate a longitudinal RNASeq and DNA methylation resource dataset, which reveals conserved, energetically demanding, genome-wide recalibrations. Taken together, these findings highlight the need to understand how OxPhos defects influence the energetic cost of living, and the link between hypermetabolism and aging in cells and patients with mitochondrial diseases.


Conflict of interest statement

The authors declare no competing interests.

Figures

Fig. 1
Fig. 1. Meta-analysis of human studies reveals increased energy expenditure and shortened lifespan in primary mitochondrial diseases.
a Overall conceptual model linking mtDNA- and nDNA-related OxPhos defects to impaired metabolic efficiency at the cellular level, impacting whole-body resting energy expenditure and clinical outcomes. b Skeletal muscle biopsy with individual muscle fibers stained with cytochrome c oxidase/succinate dehydrogenase (COX/SDH) histochemistry to reveal functional (brown) and respiratory chain deficient (blue) mitochondria. In the affected cell (middle), three sub-regions showing low, intermediate, and high mtDNA mutation load were captured by laser capture microdissection and subjected to quantitative PCR analysis as in ref. . Subcellular regions with high mtDNA mutation load show elevated mtDNA density, which is predicted to increase the energetic cost due to mitochondrial biogenesis and turnover processes. WT, wild type. c Meta-analysis of human mitochondrial disease cohorts showing elevated resting heart rate (n = 104 controls, 111 patients), d catecholamines (urinary-Cohort 3 and blood-Cohort 6) at rest or during fixed-intensity exercise (n = 38 controls, 19 patients), e whole-body oxygen consumption measured by indirect calorimetry at rest or during the response to mild exercise challenge; one before training, two after training. Slope refers to the rate of increase in VO2 relative to work rate, where a higher slope indicates increased energetic cost for a given work rate (n = 56 controls, 78 patients). f Body mass index (BMI) across mitochondrial disease cohorts and compared to relevant national averages (USA, UK, and Italy combined) (n = 285 controls, 174 patients). g Average life expectancy in individuals with mitochondrial diseases relative to the national average (n = 301 patients). Data are means ± SEM, with % difference between mitochondrial disease and control group were available. h Mortality (age at death) over 10 years (2010–2020) in Cohort 17 compared to national averages for women and men (n = 109 patients). See Table 1 for cohort details. Total n = 225 healthy controls, 690 patients. Only aggregate group means (with or without a measure of variance) were available for some cohorts, so individual participant data is not shown. Standardized effect sizes are quantified as Hedges’ g (g). Overall group comparisons were performed by paired t tests (c and f) or one-sample t tests (d and e), *p < 0.05, **p < 0.01, ****p < 0.0001.
Fig. 2
Fig. 2. SURF1 defects decrease metabolic efficiency and cause hypermetabolism without affecting coupling efficiency.
a Schematic of the study design with primary human fibroblasts, coupled with repeated, longitudinal measures of cellular, bioenergetic, and molecular profiling across the lifespan. Three Control and three SURF1 donors (one female, two males in each group) were used for all experiments. b Example oxygen consumption rate (OCR) and extracellular acidification rate (ECAR) obtained from Seahorse measurements of Control and SURF1 cells. c Comparison of average OCR and ECAR values across the cellular lifespan. The specificity of the ECAR signal for glycolysis was verified (see Methods for details). d Lifespan trajectories of ATP production rates (JATP) derived from glycolysis (JATP-Glyc), oxidative phosphorylation (JATP-OxPhos), and total ATP (JATP-Total: Glycolytic- + OxPhos-derived rates) over up to 150 days. Percentages show the average difference between SURF1 and Control across the lifespan. e Lifespan average energy expenditure (EE) by cell line and f corrected for cell volume. g Balance of JATP derived from OxPhos and glycolysis and h quantified SURF1-induced metabolic shift. Dotted lines in (h) denote the range in control cells. i Lifespan trajectory of mtDNAcn and average mtDNAcn at the first 3 time points (early life, days 5–40) and peak value across the lifespan. j Lifespan trajectories and averages of proton leak and k coupling efficiency estimated from extracellular flux measurements of ATP-coupled and uncoupled respiration. n = 3 individuals per group, 7–9 timepoints per individual. Data are means ± SEM. *P < 0.05, **P < 0.01, ***P < 0.001, ****P < 0.0001, mixed effects model (fixed effect of control/SURF1 group and days grown, random effects of the donor or cell line).
Fig. 3
Fig. 3. Pharmacological inhibition of the mitochondrial F0F1 ATP synthase triggers hypermetabolism.
a Schematic of the study design for fibroblast profiling across the lifespan from three Control donors treated with 1 nM Oligomycin (Oligo). b Lifespan trajectories of JATP (Glycolytic + OxPhos) derived from oxygen consumption rate (OCR) and extracellular acidification rate (ECAR) obtained from Seahorse measurements across the cells’ lifespan (up to 150 days). Percentages show the total average difference between Oligo and Control. c Balance of JATP derived from OxPhos and glycolysis across the lifespan and d oligo-induced metabolic shift. Dotted lines denote the range in control cells. e Relative average lifespan energy expenditure by cell line normalized to control, f corrected for cell volume. g Average of proton leak and h coupling efficiency measures on the Seahorse normalized to control. i Lifespan trajectories and j average mtDNA copy number at the first three time points (early life) and peak value across the lifespan. n = 3 individuals per group, 7–9 timepoints per individual. Data are means ± SEM. *P < 0.05, **P < 0.01, ***P < 0.001, ****P < 0.0001, mixed effects model for Oligo vs. control.
Fig. 4
Fig. 4. Longitudinal mtDNA deletion profiles in OxPhos deficient SURF1 and Oligo cells.
a RNAseq gene expression results for all MitoCarta 3.0 pathways, plus all mtDNA genes, and the integrated stress response (ISR: average of ATF4, ATF5, CHOP, GDF15). Values for each pathway are computed from the average expression levels of all genes in each pathway, expressed as the median-centered value relative to the youngest control timepoints for each pathway (rows). Each column represents a single timepoints (n = 3–8) along the lifespan of each donor or treatment condition (n = 3 donors, 3 groups). b Gene expression time course of selected mitochondrial pathways from E, expressed on a Log2 scale relative to the first control timepoint (baseline). c 10 kb long-range PCR product resolved by agarose gel electrophoresis for control fibroblasts cultured up to 166 days (P3 to 31), and passage-matched SURF1 and Oligo-treated cells. d Results from mtDNA sequencing and Eklipse analysis. Each line in the circos plots depicts a deletion burden in control (Donor2) and SURF1 (Patient2) and Oligo-treated (Donor2) cells from two (early and mid-lifespan) representative passages. e Timecourse of the number of unique mtDNA deletions in control, SURF1, and Oligo-treated cells. Deletion counts were estimated with a variant call cutoff of >5% heteroplasmy. f Total deletion burden in cells across 150 days of lifespan. Data are mean ± SEM. **P < 0.01, ***P < 0.001, mixed effects model (fixed effect of Control/SURF1/Oligo group and days grown, random effects of donor or cell line).
Fig. 5
Fig. 5. OxPhos defects trigger hypersecretion of metabokines and age-related cytokines.
a Cytokine dynamics across the lifespan measured on two multiplexes (Luminex) arrays. Cytokine levels are normalized to the number of cells at the time of sampling, shown as Log2 median-centered for each cytokine; samples with undetectable values are shown as gray cells. Columns represent repeated measures (n = 6–8) along the lifespan of each control and SURF1 donor (n = 3 per group). b Comparison of maximum cytokine concentration reached in each of the SURF1 and healthy control donors, showing general upregulation of most metabokines and cytokines. The value for TGF-α is heavily influenced by a single very high value in Donor 3. c Cell-free media GDF15 concentration time course as measured on the Cytokine array. Inset compares early release between 20 and 80 days. d Media IL-6 levels across the cellular lifespan by enzyme-linked immunosorbent assay (ELISA), normalized to the number of cells at the time of sampling. e Media GDF15 levels across the cellular lifespan measured by ELISA, normalized to the number of cells at the time of sampling. Samples with non-detectable values (N.D.) are shown as zero values. f Cell-free mitochondrial DNA (cf-mtDNA) dynamics across the cellular lifespan using qPCR, normalized to the number of cells at the time of sampling. n = 3 per group, 6–13 timepoints per condition. Data are means ± SEM. *P < 0.05, **P < 0.01, ***P < 0.001, ****P < 0.0001, mixed effects model (fixed effect of Control/SURF1/Oligo group and days grown, random effects of donor or cell line). Abbreviations: CCL7 C-C motif chemokine ligand 7, IL-8 interleukin 8, CHI3L1 chitinase-3-like protein 1, MMP7 Matrix metallopeptidase 7, IL-6 Interleukin 6, IGFBP-rp1 Insulin-like growth factor binding protein 7, TNF-RII tumor necrosis factor receptor superfamily member 1B, TGF-α tumor growth factor alpha, IFN-γ interferon-gamma, TNFRSF9 TNF receptor superfamily member 9, GDF-15 growth differentiation factor 15, TNF-β tumor necrosis factor beta, Fas Fas cell surface death receptor, CCL3 C-C motif chemokine ligand 7, FSTL1 Follistatin like 1, CCL23 C-C motif chemokine ligand 23, TIMP-1 tissue inhibitor of metallopeptidase 1, CD163 CD163 antigen, Lumican keratan sulfate proteoglycan Lumican, IL-18 interleukin-18, CXCL16 C-X-C motif chemokine ligand 16, Fetuin A alpha 2-HS glycoprotein, ALCAM activated leukocyte cell adhesion molecule, TNF-RI TNF receptor superfamily member 1A, PCSK9 proprotein convertase subtilisin/kexin type 9, TFPI tissue factor pathway inhibitor.
Fig. 6
Fig. 6. Mitochondrial defects trigger conserved transcriptional remodeling.
a t-distributed stochastic neighbor embedding (t-SNE) of RNAseq data from control, SURF1, and Oligo-treated human fibroblasts across the lifespan. b Overlap of significantly upregulated (red) or downregulated (blue) genes in SURF1 and Oligo groups relative to control (linear mixed effects model, FDR-corrected p value < 0.05). Note, outer group counts include shared counts in the overlapping rings. Gray indicates the diverging direction of regulation between SURF1 and Oligo DEGs. c Expression levels of the top 100 differentially expressed genes in SURF1 (<75 days grown) and Oligo-treated cells (days 35–110). d iPAGE analysis of RNAseq data showing the top 40 enriched gene ontology pathways in top overlapping upregulated and downregulated genes, conserved across both SURF1 and Oligo groups relative to control. Note, −log(p value) > 8 are mapped as dark orange. e Gene expression timecourses of select genes related to the ISR, senescence, nucleotide metabolism, and telomere maintenance. Log2 expression values (TPM) are normalized to the median of the control youngest timepoints. n = 3 donors per group, 3–8 timepoints per donor.
Fig. 7
Fig. 7. Mitochondrial defects trigger conserved epigenetic remodeling.
a t-SNE of the nuclear DNA methylome from control, SURF1-disease (<75 days grown), and Oligomycin-treated (35–110 days grown) fibroblasts across the replicative lifespan. b Overlap of differentially methylated CpGs (DMPs, left panel) and differentially methylated regions (DMRs, right-panel) generated from mixed effects models. Note, outer group counts include shared counts in the overlapping rings. c Heatmap of top 100 DMPs in SURF1 and Oligo-treated cells. DMPs were ordered by mean methylation difference between groups. d Timecourse of top three hyper- and hypo-DMPs for SURF1 and Oligo-treated groups. e Gene regional map of top hyper- and hypo-DMRs for SURF1-disease and Oligo-treated fibroblasts. 5′–>3′ direction. f Heatmap of top 20 enriched gene ontology pathways in top 1000 hyper- and hypo-DMPs and DMRs overlapping between SURF1 and Oligo-treated groups. Note, −log(P values) > 10 are mapped as dark orange. n = 3 donors per group, 5–11 timepoints per donor/treatment.
Fig. 8
Fig. 8. Mitochondrial OxPhos defects decrease lifespan and accelerate telomere shortening.
a Growth curves of control, SURF1, and Oligo-treated cells. Population doublings were determined from both live and dead cell cells at each passage. b Hayflick limit defined as the total number of population doublings achieved before division rate <0.01 divisions/day for at least two passages. c Telomere length per population doubling, d rate of telomere attrition per division, and e terminal telomere length. f Rate of epigenetic aging for control, SURF1, and Oligo-treated cells, calculated from the linear rate between days 25 and 75 (3–4 timepoints/cell line). g Average rate of epigenetic aging across all PC-based clocks. Each datapoint represents a different clock. f, g Significance values were calculated using a multiple comparison two-way ANOVA. n = 3 donors per group, 5–15 timepoints per condition for telomere length. In d, data are the slope estimate for the linear regressions in (c). Data are means ± SEM. *P < 0.05, **P < 0.01.
Fig. 9
Fig. 9. Conceptual model including potential sources of hypermetabolism in cells and patients with mitochondrial diseases.
OxPhos defects trigger mtDNA instability and cell-autonomous stress responses associated with the hypersecretory phenotype, recapitulating findings in plasma of patients with elevated metabokine and cell-free mitochondrial DNA (cf-mtDNA) levels. These responses are linked to the upregulation of multiple energy-dependent transcriptional programs, including the integrated stress response (ISR). We propose that these processes collectively increase energy consumption, leading to hypermetabolism in patient-derived fibroblasts, and physiological hypermetabolism in affected patients. In dividing human fibroblasts, hypermetabolism-causing OxPhos defects curtail lifespan and accelerate canonical cellular senescence and aging markers, namely telomere length, epigenetic aging, as well as secreted and transcriptional markers.

References

    1. Gorman GS, et al. Mitochondrial diseases. Nat. Rev. Dis. Prim. 2016;2:16080. doi: 10.1038/nrdp.2016.80. - DOI - PubMed
    1. Rossignol R, et al. Mitochondrial threshold effects. Biochem J. 2003;370:751–762. doi: 10.1042/bj20021594. - DOI - PMC - PubMed
    1. Mick, E. et al. Distinct mitochondrial defects trigger the integrated stress response depending on the metabolic state of the cell. eLife9, e49178 (2020). - PMC - PubMed
    1. Picard M, et al. Progressive increase in mtDNA 3243A>G heteroplasmy causes abrupt transcriptional reprogramming. Proc. Natl Acad. Sci. USA. 2014;111:E4033–E4042. doi: 10.1073/pnas.1414028111. - DOI - PMC - PubMed
    1. Quiros PM, et al. Multi-omics analysis identifies ATF4 as a key regulator of the mitochondrial stress response in mammals. J. Cell Biol. 2017;216:2027–2045. doi: 10.1083/jcb.201702058. - DOI - PMC - PubMed

Publication types

Substances