. 2023 Jan;25(1):159-169.
doi: 10.1038/s41556-022-01049-w. Epub 2023 Jan 12.

Multiplexed screens identify RAS paralogues HRAS and NRAS as suppressors of KRAS-driven lung cancer growth

Affiliations

Multiplexed screens identify RAS paralogues HRAS and NRAS as suppressors of KRAS-driven lung cancer growth

Rui Tang et al. Nat Cell Biol. 2023 Jan.

Abstract

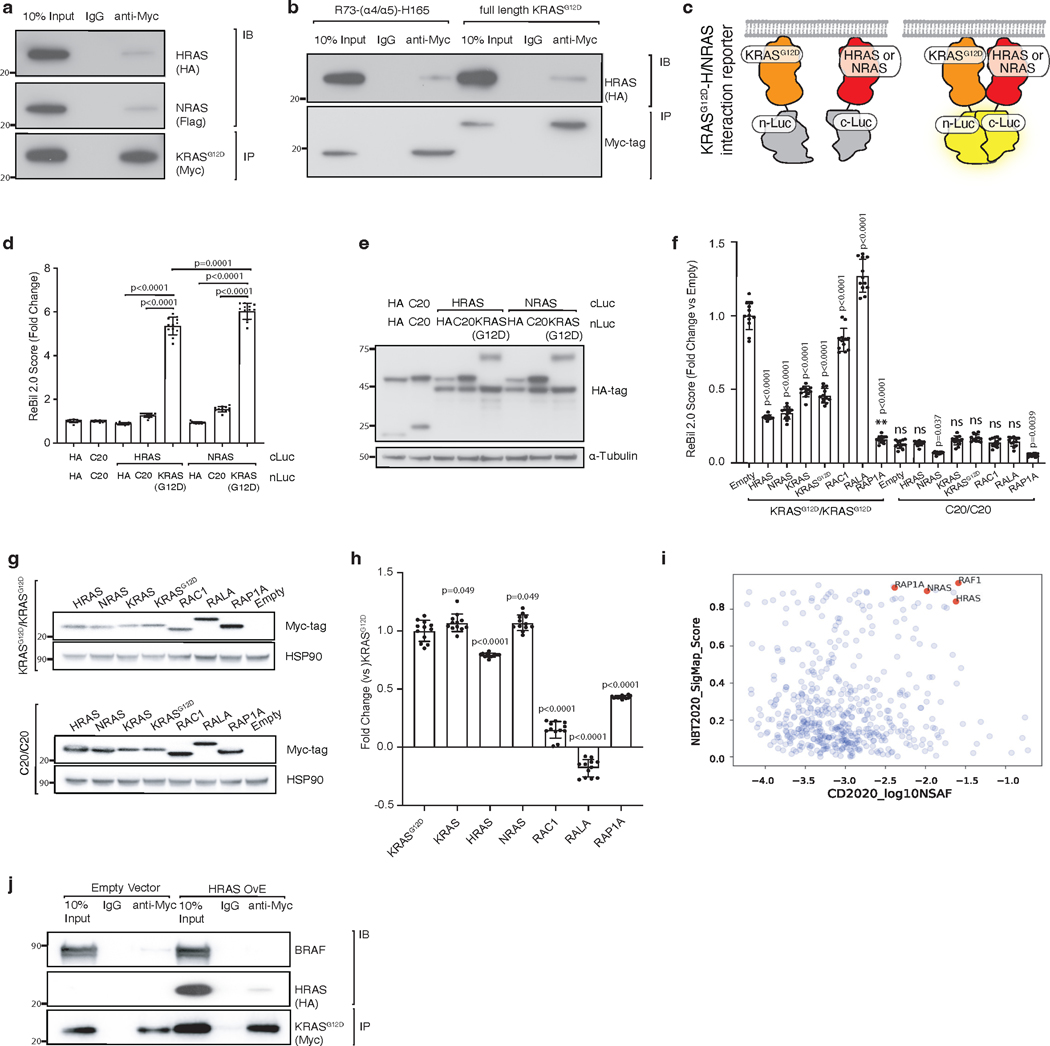
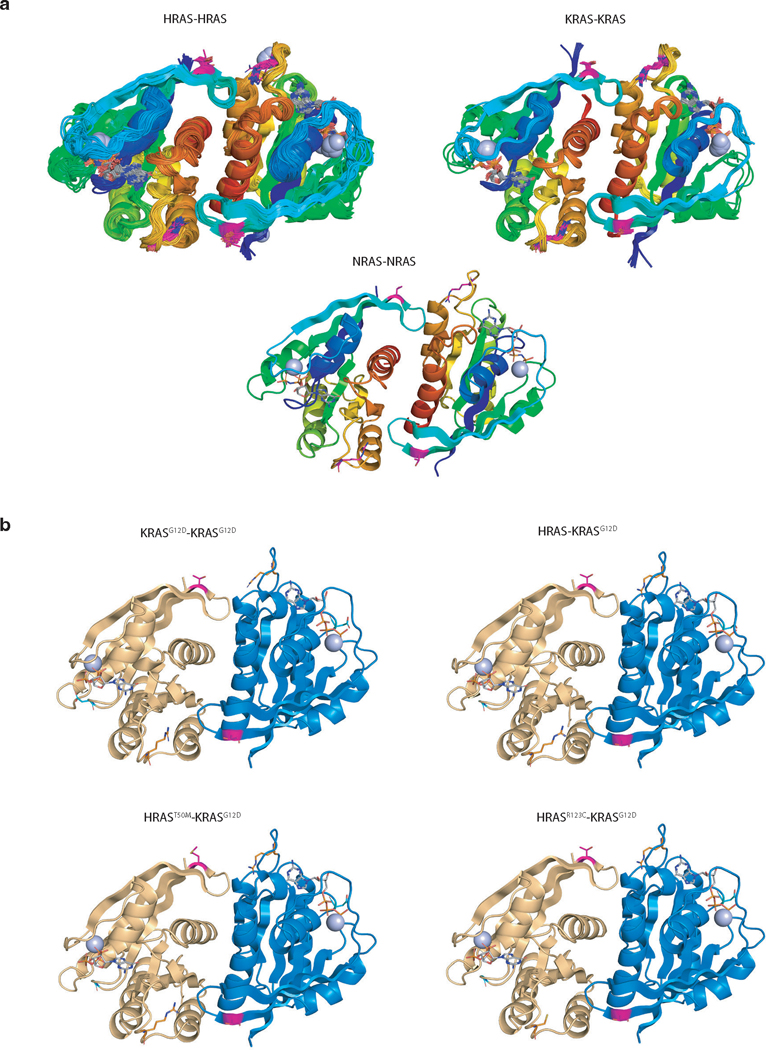
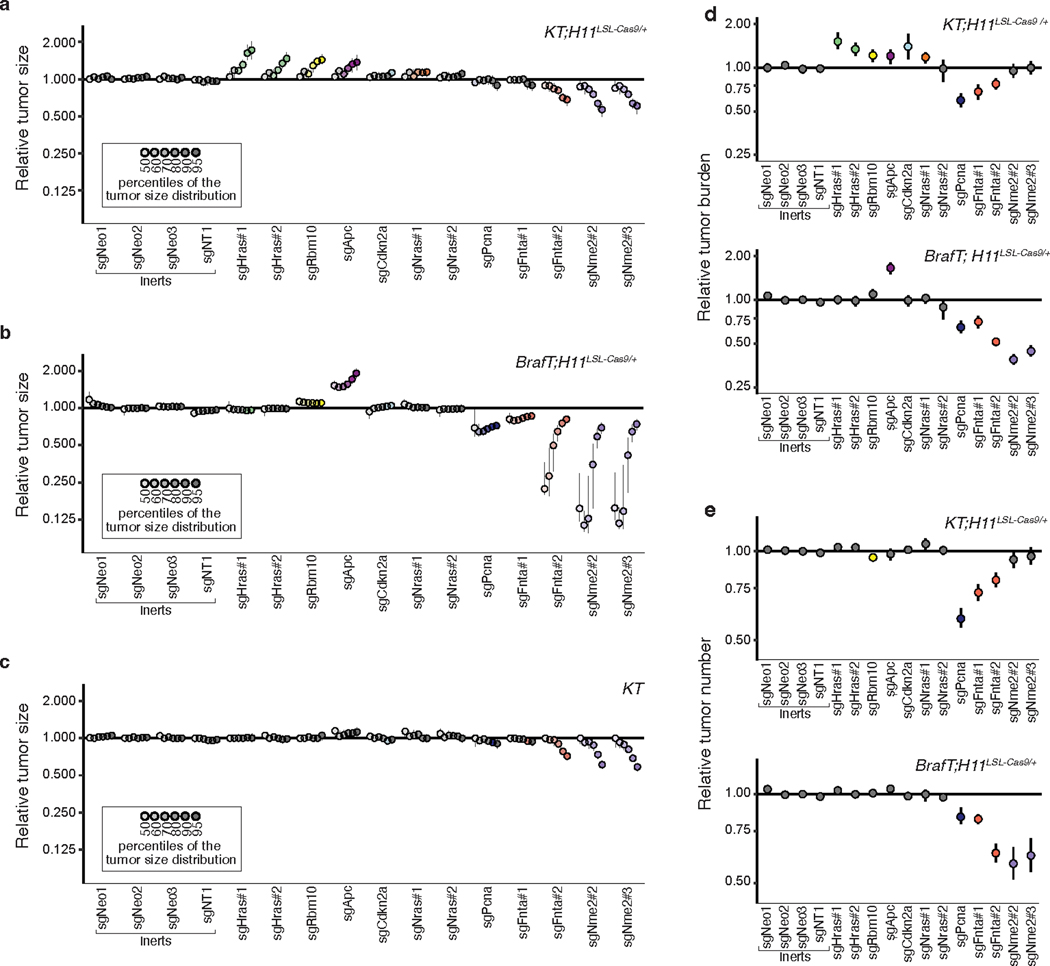
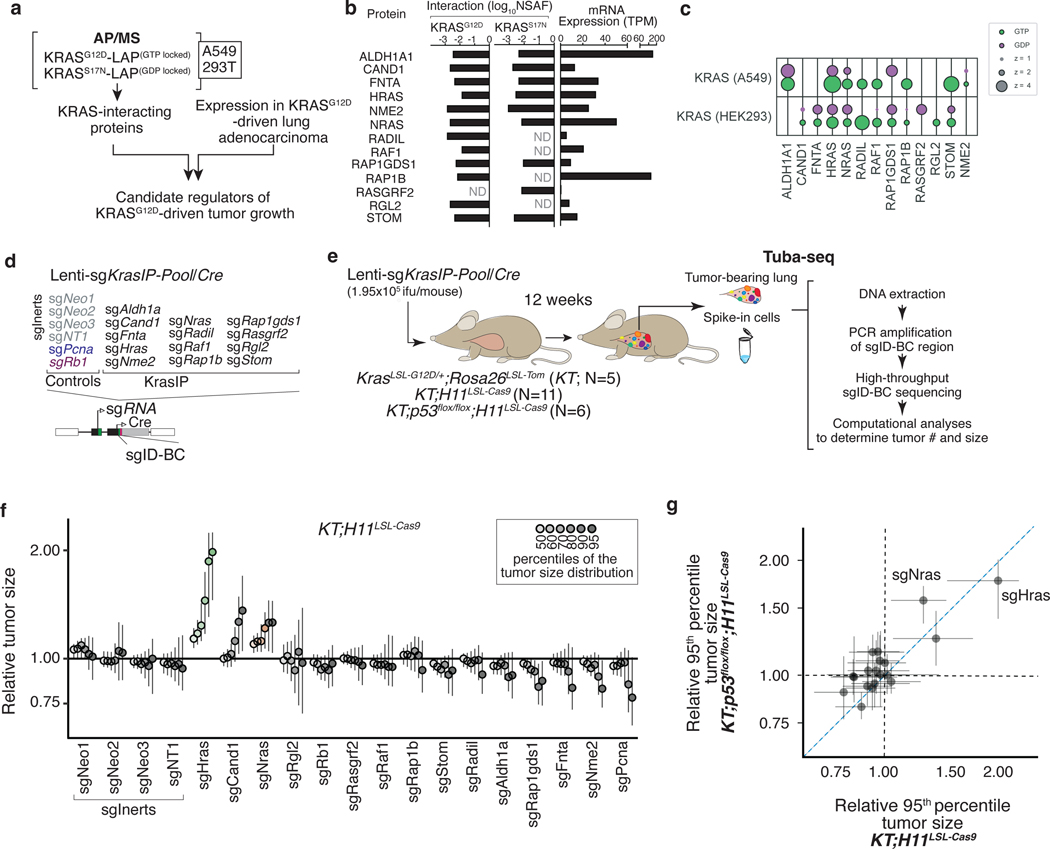
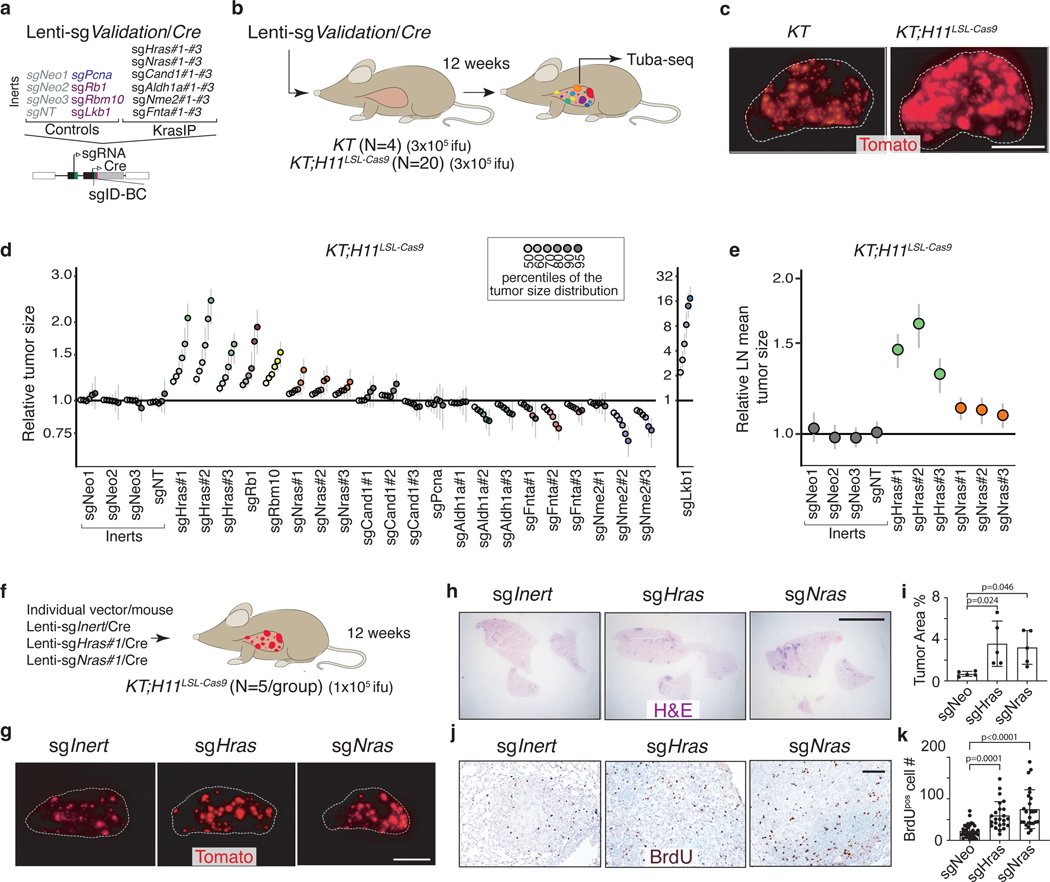
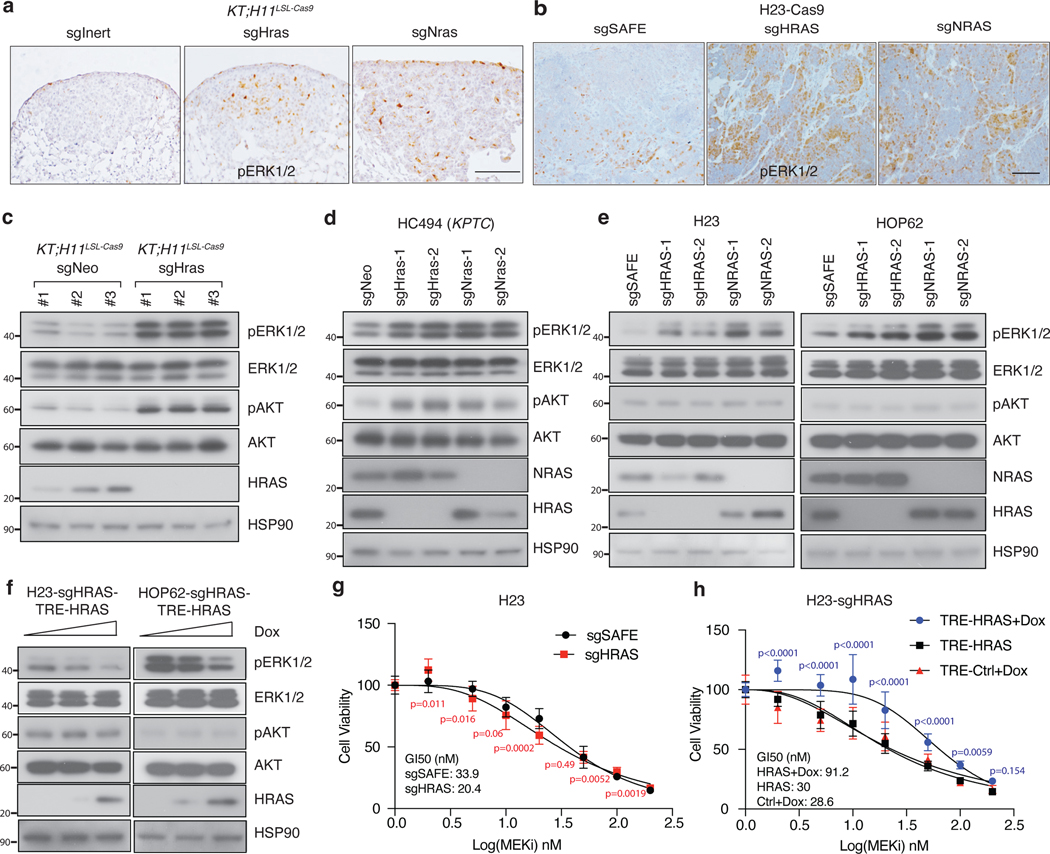
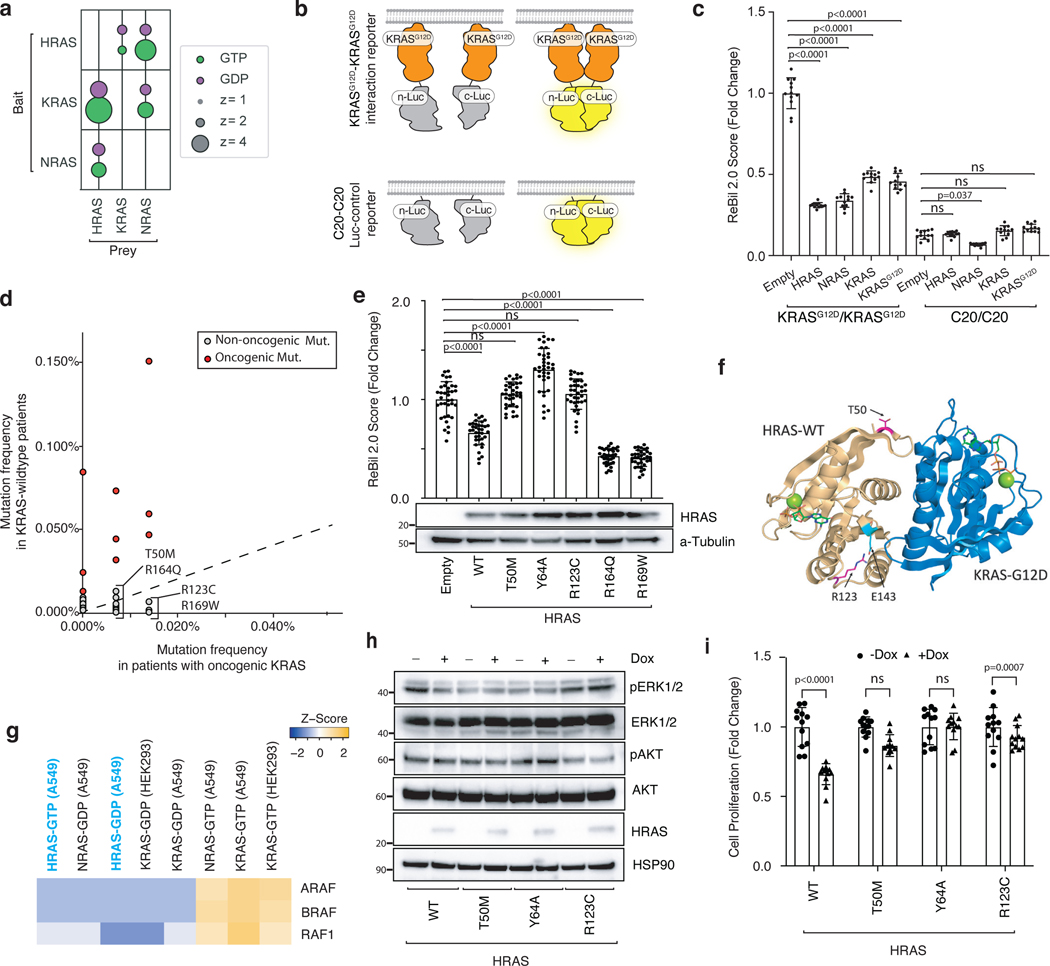
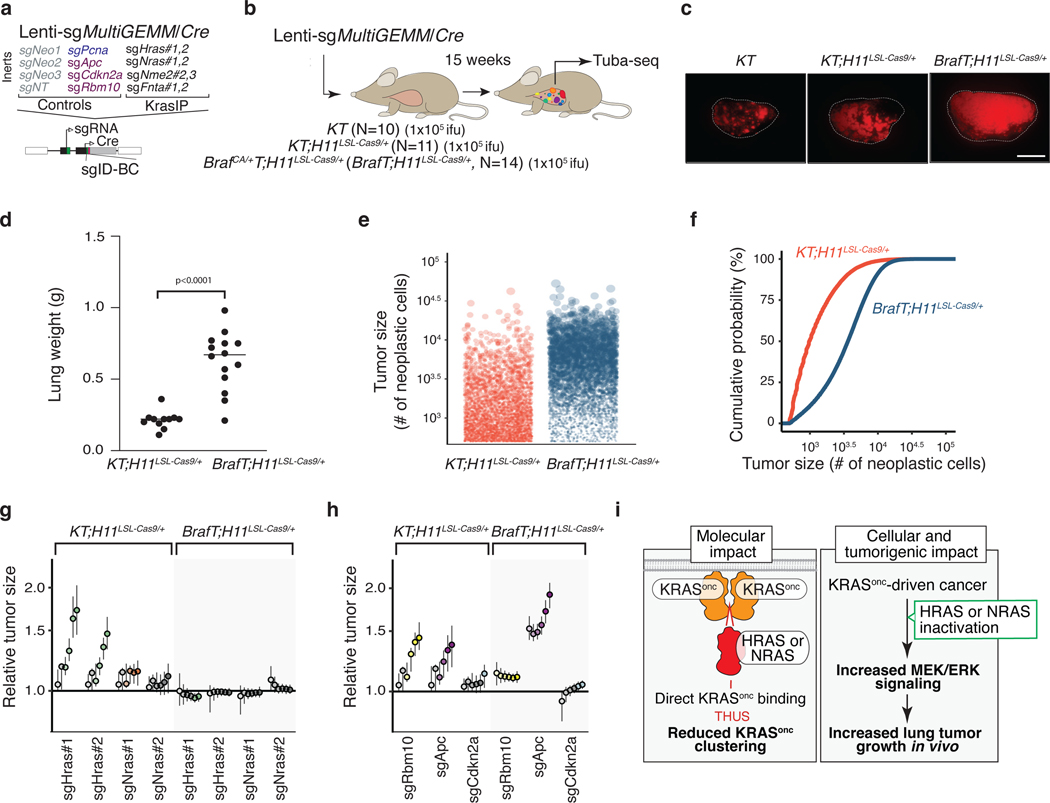
Oncogenic KRAS mutations occur in approximately 30% of lung adenocarcinoma. Despite several decades of effort, oncogenic KRAS-driven lung cancer remains difficult to treat, and our understanding of the regulators of RAS signalling is incomplete. Here to uncover the impact of diverse KRAS-interacting proteins on lung cancer growth, we combined multiplexed somatic CRISPR/Cas9-based genome editing in genetically engineered mouse models with tumour barcoding and high-throughput barcode sequencing. Through a series of CRISPR/Cas9 screens in autochthonous lung cancer models, we show that HRAS and NRAS are suppressors of KRASG12D-driven tumour growth in vivo and confirm these effects in oncogenic KRAS-driven human lung cancer cell lines. Mechanistically, RAS paralogues interact with oncogenic KRAS, suppress KRAS-KRAS interactions, and reduce downstream ERK signalling. Furthermore, HRAS and NRAS mutations identified in oncogenic KRAS-driven human tumours partially abolished this effect. By comparing the tumour-suppressive effects of HRAS and NRAS in oncogenic KRAS- and oncogenic BRAF-driven lung cancer models, we confirm that RAS paralogues are specific suppressors of KRAS-driven lung cancer in vivo. Our study outlines a technological avenue to uncover positive and negative regulators of oncogenic KRAS-driven cancer in a multiplexed manner in vivo and highlights the role RAS paralogue imbalance in oncogenic KRAS-driven lung cancer.


Conflict of interest statement

COMPETING INTERESTS STATEMENT

M.M.W. and D.A.P are co-founders of, and hold equity in, D2G Oncology, Inc.

The remaining authors declare no competing interests.

Figures

Extended Data Fig. 1
Extended Data Fig. 1. Prioritization of candidate KRAS-interacting proteins for this study.
a. Flow chart for prioritization of candidate KRAS-interacting proteins for this study. Candidate KRAS-interacting proteins were chosen based on multiple criteria including their interaction with KRAS, their homolog mRNA expression in a mouse model of KrasG12D-driven lung cancer, and the consistency with which they bind different RAS-GTPases. RADIL was added at the last step due to its validated importance in KRAS-mutant human cell lines. b. Candidate proteins interact with KRAS in two protein-protein interaction analyses (Kelly, Kostyrko, Han et al. 2020; Broyde, Simpson, Murray et al. 2020). KRAS-interacting proteins are shown as their log10NSAF and SigMap Scores. c. Homolog mRNA expression (TPM) of candidate KRAS-interacting proteins in a mouse model of KrasG12D-driven lung cancer (Chuang et al. 2017). d. Bubble plot of eight AP/MS experiments with GTP- and GDP-locked mutant GTPases as baits (rows), showing the enrichment of selected candidate KRAS-interacting proteins (columns). Dark borders indicate FDR < 0.05. e. Mutation and copy number alteration frequencies of the 13 candidate genes in lung adenocarcinomas with oncogenic KRAS (N = 152; data from TCGA PanCancer Atlas, Cell 2018).
Extended Data Fig. 2
Extended Data Fig. 2. Tumor barcoding coupled with barcode sequencing (Tuba-seq) can uncover engineered alterations that reduce tumor number and growth.
a-b. Schematic of the Tuba-seq approach to measure the effects of essential gene inactivation on tumor growth. Tumors were initiated with pool of barcoded lentiviral-sgRNA/Cre vectors targeting known essential genes and tumor suppressor Apc (Lenti-sgEssential/Cre) in KT and KT;H11LSL-Cas9 mice (a). Tuba-seq was performed on each tumor-bearing lung 12 weeks after initiation (b). c. Points denote tumor sizes at indicated percentiles for each sgRNA relative to the size of sgInert-containing tumors at the corresponding percentiles. Percentiles that are significantly different from sgInert (two-sided FDR-corrected p < 0.05) are in color. d. The impact of each sgRNA on mean tumor size relative to sgInerts, assuming a log-normal distribution of tumor sizes (LNmean). sgRNAs with two-sided FDR-corrected P < 0.05 are in bold. e. Points denote the impact of each sgRNA on tumor burden relative to sgInerts and normalized to the same statistic in KT mice. Relative burdens significantly different from sgInert (two-sided FDR-corrected p < 0.05) are in color. f. Points denote the impact of each sgRNA on tumor number relative to sgInerts and normalized to the same statistic in KT mice. Relative tumor numbers significantly different from sgInert (two-sided FDR-corrected p < 0.05) are in color. g. Points denote the impact of each sgRNA on tumor number plotted against its impact on LNmean tumor size. The lines at y = 1 and x = 1 indicate no effect relative to sgInert on tumor number and size, respectively. For panels c and e-g: Error bars indicate 95% confidence intervals around point estimates of the test statistic. Confidence intervals and P-values were calculated using a nested bootstrap resampling approach across 9 KT;H11LSL-Cas9 mice and 2 KT mice. sgInerts are in gray and the line at y = 1 indicates no effect.
Extended Data Fig. 3
Extended Data Fig. 3. Inactivation of KRAS-interacting proteins has similar impacts on tumor growth in p53-proficient and p53-deficient contexts.
a. Points denote tumor sizes at indicated percentiles for each sgRNA relative to the size of sgInert-containing tumors at the corresponading percentiles in KT mice. Genes are ordered as in Fig. 1f. Line at y = 1 indicates no effect relative to sgInert. As expected, no percentiles were significantly different from sgInert (two-sided FDR-adjusted p < 0.05). b. The impact of each sgRNA on mean tumor size relative to sgInerts in KT;H11LSL-Cas9 mice, assuming a log-normal distribution of tumor sizes (LNmean). sgRNAs with two-sided P < 0.05 after FDR-adjustment are in bold. c-d. Points denote the impact of each sgRNA on tumor burden (c) and number (d) relative to sgInerts in KT;H11LSL-Cas9 mice, normalized to the corresponding statistic in KT mice to account for representation of each sgRNA in the viral pool. sgInerts are in gray and the line at y = 1 indicates no effect. Relative tumor burdens and numbers significantly different from sgInert (two-sided FDR-adjusted p < 0.05) are in color. e. Points denote tumor sizes at the indicated percentiles for each sgRNA relative to the size of sgInert-containing tumors in KT;p53flox/flox;H11LSL-Cas9 mice. Genes are ordered as in Fig. 1f. The line at y = 1 indicates no effect relative to sgInert. Percentiles that are significantly different from sgInert (two-sided FDR-adjusted p < 0.05) are in color. f-h. Comparison of the impact of each sgRNA on relative LNmean tumor size (f), tumor burden (g) and tumor number (h) in KT;H11LSL-Cas9 and KT;p53flox/flox;H11LSL-Cas9 mice. For all panels: Error bars indicate 95% confidence intervals around point estimates of the test statistics. Confidence intervals and P-values were calculated using a nested bootstrap resampling approach described across 11 KT;H11LSL-Cas9 mice, 6 KT;p53flox/flox;H11LSL-Cas9 mice and 5 KT mice.
Extended Data Fig. 4
Extended Data Fig. 4. Top candidate KRAS-interacting proteins from initial Tuba-seq screen impact multiple metrics of tumor growth in validation cohort.
a. Points denote tumor sizes at indicated percentiles for each sgRNA relative to the size of sgInert-containing tumors at the corresponding percentiles in KT mice. KT mice lack Cas9, thus all sgRNAs are functionally equivalent to sgInerts. Genes are ordered as in Fig. 2d, but note the change in axis scaling. Line at y = 1 indicates no effect relative to sgInerts. As expected, no percentiles were significantly different from sgInert (FDR-adjusted p < 0.05). b. The impact of each sgRNA on mean tumor size relative to sgInerts, assuming a log-normal distribution of tumor sizes (LNmean). sgRNAs with two-sided P < 0.05 after FDR-adjustment are in bold. Note that these data for the sgInerts, sgHras#1–3 and sgNras#1–3 are also plotted in Fig. 2e. c. Points denote the impact of each sgRNA on tumor burden relative to sgInerts in KT;H11LSL-Cas9 mice, normalized to the corresponding statistic in KT mice to account for the representation of each sgRNA in the viral pool. sgInerts are in gray and the line at y = 1 indicates no effect. Relative tumor burdens significantly different from sgInert (two-sided FDR-adjusted p < 0.05) are in color. d. Points denote the impact of each sgRNA on tumor number relative to sgInerts in KT;H11LSL-Cas9 mice, normalized to the corresponding statistic in KT mice to account for representation of each sgRNA in the viral pool. sgInerts are in gray and the line at y = 1 indicates no effect. Relative tumor numbers significantly different from sgInert (two-sided FDR-adjusted p < 0.05) are in color. For all panels: Error bars indicate 95% confidence intervals around point estimates of the test statistic. Confidence intervals and P-values were calculated using a nested bootstrap resampling approach across 20 KT;H11LSL-Cas9 mice and 4 KT mice.
Extended Data Fig. 5
Extended Data Fig. 5. Wild type RAS paralogs constrain the growth of human KRAS-driven cancer cell lines.
a. RAS family member dependency scores in human lung adenocarcinoma (LUAD) cell lines. b. Effects of RAS gene knockouts in A549 cells. The T-score represents the normalized effect of multiple sgRNAs targeting a gene. A positive T-score indicates a tumor-suppressive effect. The effects of each gene relative to SAFE sgRNAs were tested via Mann–Whitney U test, corrected via Benjamini-Hochberg procedure. (Data source: Kelly, Kostyrko, Han et al. 2020). c. Effects of RAS gene knockouts in KRAS-mutant human LUAD cells in 3D culture. The effects of each gene relative to SAFE sgRNAs were tested via two-sided Benjamini-Hochberg-corrected t-test. (Data source: Han et al. 2020). d. Indel rates in cell lines with the indicated sgRNAs. * denotes sgRNAs used for cell culture and transplantation experiments. e. Re-expression of wild-type HRAS or NRAS suppresses proliferation of HRAS and NRAS double knockout (DKO) HOP62 cells. Cells were seeded in 96-well plates and cultured under limited serum (1%) with or without Doxycycline (Dox). Cell numbers were measured via CCK8 assay. Points are Mean±SD of 16 wells normalized to Day 0. (one-tailed t-test). f. Representative images of subcutaneous tumors 4 weeks after transplantation with H23 cells. Quantification is in Fig. 3h. Scale bar: 2 mm. g. Representative images of Ki67 staining from subcutaneous tumors four weeks after transplantation with H23 cells. Quantification is shown in Fig. 3i. Scale bar: 100 μm. h. Representative images of H&E and human mitochondria staining on lung tumors 4 weeks after intravenous transplantation with H23 cells. Quantification is in Fig. 3j. Scale bar: 500 μm. i. Representative images of Ki67 staining from lung tumors 4 weeks after intravenous transplantation with H23 cells. Quantification is in Fig. 3k. Scale bar: 200 μm.
Extended Data Fig. 6
Extended Data Fig. 6. Wild-type RAS paralogs finetune RAS signaling.
a. Western blot analysis of three RAS paralogs’ expression per 10,000 human and mouse KRAS-driven lung cancer cell lines. Recombinant RAS proteins were used as a standard. b. Western blot analysis of three RAS paralogs’ expression per 20,000 sorted BrafV600E-driven mouse lung cancer cells. Recombinant RAS proteins were used as a standard. c. Quantification of pERKpos cells in KT;H11LSL-Cas mice with tumors initiated with Lenti-sgRNA/Cre vectors as indicated in Fig. 4a. Each dot represents a tumor. (one-way ANOVA). d. Quantification of pERKpos cells per field of indicated cells from Fig. 4b. Each dot represents a view field. (one-way ANOVA). SubQ, subcutaneous. e. Western blot analysis of HRAS and NRAS double knockout (DKO) HOP62 cells re-expressing HRAS (TRE-HRAS) or NRAS (TRE-NRAS) under Doxycycline (Dox) treatment. DKO cells were generated as described in Fig. 3a. DKO cells were re-transduced with lentiviral vector expressing TRE-HRAS or TRE-NRAS at high MOI ( > 5) to generate stable re-expressing cells. To re-express HRAS, cells were treated with 10 ng/ml Dox. To re-express NRAS, cells were treated with 50 ng/ml Dox. All cells were cultured under limited serum (1%) for 2 days before protein extraction. HSP90 is blotted as loading control.
Extended Data Fig. 7
Extended Data Fig. 7. HRAS and NRAS directly interact with KRASG12D.
a. Co-immunoprecipitation of HRAS (HA-tagged) and NRAS (Flag-tagged) with KRASG12D (Myc-tagged), imaged by western blotting. 293T cells were co-transfected with Myc-KRASG12D, HA-HRAS, and Flag-NRAS for 24 hours before co-immunoprecipitation. b. Co-immunoprecipitation of HRAS (HA-tagged) with truncated (aa73-aa165) or full length KRASG12D (Myc-tagged), imaged by western blotting. 293T cells were co-transfected with Myc-KRASG12D and HA-HRAS for 24 hrs before co-immunoprecipitation. c. Diagram of the modified ReBiL2.0 system to assess direct KRASG12D-HRAS/NRAS interaction. d. HRAS and NRAS can directly interact with KRASG12D. 293 T cells expressing indicated cLuc- and nLuc- luciferase were cultured in limited serum (1%) for 24 hours and ReBiL2.0 assay was performed. Points are Mean±SD ReBiL2.0 score of 12 wells normalized to cells expressing free luciferase (cLuc-HA/nLuc-HA). (one-way ANOVA). e. Luciferase protein expression in c, imaged by western blotting for the HA-tag. α-Tubulin is loading control. f. Full data from experiment shown in Fig. 5c. 293T cells expressing nLuc-KRASG12D/cluc-KRASG12D or nLuc-C20/cluc-C20 with indicated Myc-tagged RAS-GTPases were cultured in limited serum (1%) for 24 hours and ReBiL2.0 assays were performed. Points are Mean±SD ReBiL2.0 score of 12 wells normalized to cells transduced with empty vector. ns: not significant (one-way ANOVA). g. RAS-GTPases protein expression in e, imaged by western blotting for the Myc-tag. HSP90 is loading control. h. Relative strength of RAS-GTPases in disrupting KRASG12D-KRASG12D interactions in f. Differences in ReBiL2.0 score between empty vector and indicated RAS-GTPases were normalized by their own protein expression via western blotting for the Myc-tag. (one-way ANOVA). i. RAP1A interacts with KRASG12D in two protein-protein interaction analyses (Kelly, Kostyrko, Han et al. 2020; Broyde, Simpson, Murray et al. 2020). j. Co-immunoprecipitation of BRAF with KRASG12D (Myc-tagged), imaged by western blotting. 293T cells were co-transfected with Myc-KRASG12D, BRAF, and with or without HA-HRAS for 24 hours before co-immunoprecipitation. Overexpression (OvE) of HRAS suppressed BRAF co-immunoprecipitation with KRASG12D.
Extended Data Fig. 8
Extended Data Fig. 8. Identification and analysis of rare RAS mutations in oncogenic KRAS-mutant tumors.
a-b. Pan-cancer frequency of HRAS (a) or NRAS (b) mutations in patients from Project GENIE. Mutations that are intergenic, intronic, silent, or in the 3’ or 5’ UTR were excluded. Oncogenic KRAS mutants were defined as tumors having missense mutations in codons 12, 13 or 61. Known oncogenic HRAS (a) or NRAS (b) mutations are highlighted. The dashed line indicates equal mutation frequency in samples with wild-type and mutant KRAS. Non-oncogenic mutations occurring at least once in patients with oncogenic KRAS mutations are annotated. Mutants selected for analysis of ability to disrupt KRASG12D-KRASG12D interactions are in bold. c-d. Characteristics of samples with rare HRAS (c) or NRAS (d) mutations selected for analysis of ability to disrupt KRASG12D-KRASG12D interactions using the ReBiL2.0 system. e. Identification of RAS-RAS interaction-deficient NRAS mutation. 293 T (nLuc-KRASG12D/cluc-KRASG12D) cells expressing wild-type or NRAS mutants were cultured in limited serum (1%) for 24 hours. Points are Mean±SD ReBiL2.0 score of 12 wells normalized to cells transfected with empty vector. ns: not significant. (one-way ANOVA). f. NRAS (wild-type and mutant) protein expression levels in a shown by anti-Myc tag western blot. HSP90 is loading control. g. Western blot of cultured NRAS-null HOP62 cells (HOP62-Cas9-sgNRAS) re-expressing sgRNA-resistant wild-type NRAS or NRASR102Q under Dox treatment. Cells were cultured under limited serum (1%) with or without Dox for 2 days before protein extraction. Re-expression of NRASR102Q had no effect on ERK phosphorylation. GAPDH is loading control. h. Proliferation of cultured NRAS-null HOP62 cells (HOP62-Cas9-sgNRAS) expressing sgRNA-resistant wild-type NRAS or NRASR102Q under Dox treatment. Cells were cultured in limited serum (1%) with or without Dox for 4 days. Cell viability was measured via CCK8 assay and normalized to cells treated with vehicle. Re-expression of NRASR102Q had no effect on cell proliferation. Points are Mean±SD of 10 wells. ns: not significant (one-tailed t-test).
Extended Data Fig. 9
Extended Data Fig. 9. Prediction of RAS-RAS dimer interfaces.
a. Homodimers of RAS present in crystals of HRAS, KRAS, and NRAS in the Protein Data Bank. Dimers were downloaded from the Protein Common Interface Database (ProtCID), which clusters interfaces present in different crystals of homologous proteins. The α4-α5 dimer shown is present in 84 entries of HRAS, 13 entries of KRAS, and one entry of NRAS (PDB 5UHV). b. Models of a homodimer of KRASG12D and heterodimers of KRASG12D with HRAS, HRAST50M, and HRASR123C. The α4-α5 HRAS dimer from PDB entry 3K8Y was used as a template. KRASG12D from PDB entry 5USJ was superposed with the program PyMol on one or both monomers of 3K8Y to form the heterodimers and the homodimer respectively. Residues T50 and R123 were mutated with PyMol. R123 is involved in an intrachain salt bridge with residue E143, which also participates in the RAS-RAS interface. Mutation to cysteine results in an uncompensated charge on E143, which may destabilize the RAS-RAS interaction. All four structures were relaxed with the program Rosetta using the FastRelax protocol with the Ref2015 scoring function. Rosetta uses the backbone-dependent rotamer library of Shapovalov and Dunbrack to repack side chains around the mutated sites. The resulting energies were: KRASG12D-KRASG12D, -1122.8 kcal/mol; HRAS-KRASG12D, -1144.8 kcal/mol; HRAST50M-KRASG12D, -1135.5 kcal/mol; HRASR123C-KRASG12D, -1130.9 kcal/mol. Residues T50 (magenta) and R123 (orange) are indicated in sticks.
Extended Data Fig. 10
Extended Data Fig. 10. Paired screen in KRAS-driven and BRAF-driven lung cancer models validates HRAS and NRAS as KRAS-specific tumor suppressors.
a-c. Points denote tumor sizes at indicated percentiles for each sgRNA relative to the size of sgInert-containing tumors at the corresponding percentiles in KT;H11LSL-Cas9/+ (a), BrafT;H11LSL-Cas9/+ (b) and KT mice (c). Genes are ordered by 95th percentile tumor size in KT;H11LSL-Cas9/+ mice, with sgInerts on the left. Percentiles that are significantly different from sgInert (two-sided FDR-adjusted p < 0.05) are in color. The negative effects of sgRNAs targeting Fnta and Nme2 in the KT mice (c) are unexpected and indicate a potential bias in the size distributions of tumors with these genotypes. We note that the same bias may be present in the KT;H11LSL-Cas9/+ and BrafT;H11LSL-Cas9/+ data; however, previous experiments showed consistent negative effects on tumor size for these sgRNAs, suggesting that the observed effects in this KT;H11LSL-Cas9/+ cohort are not solely the product of this bias. d. Points denote the impact of each sgRNA on tumor burden relative to sgInerts in KT;H11LSL-Cas9/+ and BrafT;H11LSL-Cas9/+ mice, normalized to the corresponding statistic in KT mice to account for representation of each sgRNA in the viral pool. Relative tumor burdens significantly different from sgInert (two-sided FDR-adjusted p < 0.05) are in color. e. Points denote the impact of each sgRNA on tumor number relative to sgInerts in KT;H11LSL-Cas9/+ and BrafT;H11LSL-Cas9/+ mice, normalized to the corresponding statistic in KT mice to account for representation of each sgRNA in the viral pool. Relative tumor numbers significantly different from sgInert (two-sided FDR-adjusted p < 0.05) are in color. For all panels: Error bars indicate 95% confidence intervals around point estimates of the test statistic. sgInerts are in gray and the line at y = 1 indicates no effect relative to sgInerts. Confidence intervals and P-values were calculated using the nested bootstrap resampling approach described in the Methods across 11 KT;H11LSL-Cas9/+ mice, 14 BrafT;H11LSL-Cas9/+ mice and 10 KT mice.
Figure 1.
Figure 1.. Multiplexed identification of KRAS-interacting proteins that impact KRASG12D-driven lung cancer growth in vivo.
a. Candidate mediators of KRAS-driven lung tumor growth were identified on the basis of their interactions with GTP- and GDP-locked KRAS in multiple AP/MS-based protein-protein interaction screens and their expression in a mouse model of KRAS-driven lung adenocarcinoma. b. Selected proteins interact with either GTP- or GDP-locked KRAS and are expressed in mouse KRASG12D-driven lung cancer. NSAF: normalized spectral abundance factor; TPM: transcripts per million; ND: undetected. c. Plot of two AP/MS experiments with GTP- and GDP-locked mutant GTPases as baits (rows), showing the enrichment of selected candidate KRAS-interacting proteins (columns). Dark borders indicate FDR < 0.05. d. Schematic of tumor initiation with a pool of barcoded Lenti-sgRNA/Cre vectors (Lenti-sgKrasIP-Pool/Cre). Each vector contains an sgRNA, Cre, and a two-component barcode composed of an sgRNA identifier (sgID) and a random barcode (BC). This design allows inactivation of multiple target genes in parallel followed by quantification of the resulting tumor size distributions through high-throughput sgID-BC sequencing. e. Tumors were initiated in cohorts of KT, KT;H11LSL-Cas9 and KT;p53flox/flox;H11LSL-Cas9 mice through intratracheal delivery of Lenti-sgKrasIP-Pool/Cre. Tuba-seq was performed on each tumor-bearing lung 12 weeks after initiation to characterize the effects of inactivating each gene. f. Points denote tumor sizes at indicated percentiles for each sgRNA relative to the size of sgInert-containing tumors at the corresponding percentiles in KT;H11LSL-Cas9 mice. Genes are ordered by 95th percentile tumor size, with sgInerts on the left. sgInerts are in gray, and the line at y=1 indicates no effect relative to sgInert. Percentiles that are significantly different from sgInert (two-sided FDR-adjusted p < 0.05) are in color. g. Comparison of 95th percentile tumor size for each sgRNA relative to the 95th percentile tumor size of sgInert-containing tumors in KT;H11LSL-Cas9 mice versus KT;p53flox/flox;H11LSL-Cas9 mice. For panels f and g: Error bars indicate 95% confidence intervals around the point estimate of the test statistic. Confidence intervals and P-values in panels f and g were calculated using the nested bootstrap resampling approach across 11 KT;H11LSL-Cas9 mice and 6 KT;p53flox/flox;H11LSL-Cas9 mice.
Figure 2.
Figure 2.. HRAS and NRAS are potent suppressors of KRASG12D-driven lung cancer growth in vivo
a. Lenti-sgValidation/Cre targets candidate mediators of KRAS-driven lung tumor growth (3 sgRNAs/gene). b. Tumors were initiated in KT and KT;H11LSL-Cas9 mice through intratracheal delivery of Lenti-sgValidation/Cre, and Tuba-seq was performed on each tumor-bearing lung. . c. Fluorescence images of lung lobes 12 weeks after tumor initiation. Representative of 5 KT and 15 KT;H11LSL-Cas9 mice. Scale bars: 5 mm. Lung lobes are outlined with a white dashed line. d. Points denote tumor sizes at indicated percentiles for each sgRNA relative to the size of sgInert-containing tumors at the corresponding percentiles in KT;H11LSL-Cas9 mice. Genes are ordered by 95th percentile tumor size, with sgInerts on the left. Note that sgLkb1 is plotted on a separate scale to facilitate visualization. The line at y=1 indicates no effect relative to sgInert. Percentiles that are significantly different from sgInert (2-sided FDR-adjusted p<0.05) are in color. e. Targeting Hras and Nras significantly increases mean tumor size relative to sgInerts, assuming a log-normal distribution of tumor sizes (LNmean). For panels d and e: Error bars indicate 95% confidence intervals around the point estimate of the test statistic. Confidence intervals and P-values were calculated using nested bootstrap resampling across 20 KT;H11LSL-Cas9 mice. f. Schematic of tumor initiation with individual Lenti-sgRNA/Cre vectors. g. Fluorescence images of lungs from KT;H11LSL-Cas9 mice 12 weeks after tumor initiation with Lenti-sgRNA/Cre vectors. Representative of 5 mice/group. Scale bar: 5 mm. h. Representative H&E images of lungs from KT;H11LSL-Cas9 mice after tumor initiation with Lenti-sgRNA/Cre vectors. Scale bar: 5 mm. i. Tumor burden in KT;H11LSL-Cas9 mice with tumors initiated with Lenti-sgRNA/Cre vectors. Error bars are Mean±SD. Each dot represents relative tumor area (percentage of total lung area) from one mouse. N=5 animals (one-way ANOVA). j. Representative BrdU staining images of lungs from KT;H11LSL-Cas9 mice after tumor initiation with Lenti-sgRNA/Cre vectors. Scale bar: 100 μm. k. Quantification of proliferating cells in KT;H11LSL-Cas9 mice with tumors initiated with Lenti-sgRNA/Cre vectors. Error bars are Mean±SD. Each dot is a tumor (sgNeo: N=34, sgHras: N=24, sgNras: N=25). N=5 animals (one-way ANOVA).
Figure 3.
Figure 3.. Wild-type HRAS and NRAS constrain the growth of human KRAS-driven cancer cell lines.
a. Wildtype (sgSAFE) or HRAS- or NRAS-knockout cells were seeded in 96 well plates and cultured under limited serum (1%). Cell numbers were measured via CCK8 assay. Points are Mean±SD of 12 wells normalized to Day 0 (one-way ANOVA). b. Re-expression of wild-type HRAS suppresses proliferation of HRAS-null H23 and H727 cells. TRE-HRAS cells were seeded in 96-well plates and cultured under limited serum (1%) with or without 50 ng/ml Doxycycline (Dox) and cell numbers were measured via CCK8 assay. Points are Mean±SD of 8 wells normalized to Day 0 (one-tailed t-test). c-d. Inactivation of HRAS or NRAS increases H23 colony formation. Wild-type (sgSAFE), HRAS-knockout (sgHRAS), or NRAS-knockout (sgNRAS) H23 cells were seeded at 1000 cells/well in 6-well plates and grown for two weeks. Cells were stained with crystal violet. C. Representative images. Scale bar: 5mm. d. Mean±SD of colony number from 12 fields (one-way ANOVA). e-f. Re-expression of wild type HRAS suppresses HRAS-null H23 cell colony formation. Cells were seeded at 1000 cells/well in 6-well plates and grown +/-50 ng/ml Dox for two weeks. Cells were stained with crystal violet. e. Representative images. Scale bar: 5mm. f. Mean±SD of colony number from 12 fields (one-way ANOVA). g-k. Inactivation of wild-type HRAS or NRAS increases H23 cell growth after transplantation. g. Schematic of tumor initiation by transplantation of H23 cells with inactivation of HRAS or NRAS in NSG mice. h. Tumor weight from SubQ transplantation of indicated cells. Each dot represents a mouse. Mean value is shown. i. Ki67pos cell number in tumor sections from SubQ transplantation of indicated cells, shown as Mean±SD value of 20 view fields. j. Tumor area (percentage of human mitochondriapos area) from IV transplantation of indicated cells. Each dot represents a tumor. Mean value is shown. k. Ki67pos cell number in tumor sections from IV transplantation of indicated cells, shown as Mean±SD value of 15 view fields (200x). ns: not significant (one-way ANOVA).
Figure 4.
Figure 4.. Wildtype RAS paralogs suppress RAS signaling
a. Images of pERK staining in KT;H11LSL-Cas9 mice with tumors initiated with indicated Lenti-sgRNA/Cre vectors. Representative of >20 tumors across 5 mice/group. Scale bar: 100 μm. b. Images of pERK staining in H23 cell subcutaneous tumors. Representative of >15 tumors across 5 mice/group. Scale bar: 100 μm. c. Western blot of sorted cancer cells from KT;H11LSL-Cas9 mice transduced with indicated Lenti-sgRNA/Cre vectors. d. Western blot of a murine lung adenocarcinoma cell line transduced with indicated Lenti-sgRNA vectors and selected with puromycin to generate stable knockout cell lines. Cells were cultured under limited serum (1%) for 2 days before protein extraction. HSP90 is a loading control. e. Western blot of cultured human lung adenocarcinoma cell lines transduced with indicated Lenti-sgRNA vectors and selected with puromycin to generate stable knockout cell lines. Cells were cultured under limited serum (1%) for 2 days before protein extraction. f. Western blot of human lung adenocarcinoma cell lines re-expressing HRAS (TRE-HRAS) under Doxycycline (Dox) treatment. HRAS-null cells were re-transduced with lentiviral vector expressing TRE-HRAS to generate stable HRAS re-expressing cells (sgHRAS-TRE-HRAS). To re-express HRAS, cells were treated with 0, 1, or 2ng/ml Dox and cultured under limited serum (1%) for 2 days before protein extraction. c-f: HSP90 is a loading control. g. GI50 values to the MEK inhibitor trametinib among wild-type and HRAS-null H23 cells treated with the indicated doses of trametinib for 4 days. Cell numbers were measured via CCK8 assay and normalized to cells treated with vehicle. Each data point is shown as Mean±SD of 12 wells (one-tailed t-test). h. GI50 values to the MEK inhibitor trametinib among HRAS-null H23 cells (H23-sgHRAS) re-expressing HRAS in the presence (HRAS+Dox) or absence (HRAS) of Doxycycline plus the indicated dose of trametinib for 4 days. Cell numbers were measured via CCK8 assay and normalized to cells treated with vehicle. Each data point is shown as Mean±SD of 12 wells (one-way ANOVA).
Figure 5.
Figure 5.. Wildtype RAS paralogs fine-tune RAS signaling through interaction with oncogenic KRAS.
a. Enrichment of RAS paralogs in AP/MS experiments with HRAS, KRAS, and NRAS as baits. b. Diagram of the ReBiL2.0 split luciferase system. KRASG12D-KRASG12D interactions were quantified by normalized luminescent signal generated by membrane-association-facilitated interaction of split-luciferase fused to the N-terminus of KRASG12D (upper). Split-luciferase fused to the last 20 amino acids of KRAS (C20) is used as a control for background split-luciferase interaction (lower). c. 293T cells expressing nLuc-KRASG12D/cluc-KRASG12D or nLuc-C20/cluc-C20 with or without exogenous KRAS, HRAS, or NRAS were cultured in limited serum (1%) for 24 hours. Points are Mean±SD ReBiL2.0 score of 12 wells normalized to cells transduced with empty vector. ns: not significant (one-way ANOVA). d. Pan-cancer frequency of HRAS mutations in wild-type and oncogenic KRAS-driven tumors. The dashed line indicates equal mutation frequency. Four mutations chosen for further validation in this study are highlighted. e. U2OS-764 (nLuc-KRASG12D/cluc-KRASG12D) cells expressing wildtype or mutant HRAS were cultured in limited serum (1%) with100 ng/ml Dox for 24 hours. Points are Mean±SD ReBiL2.0 score of 36 wells normalized to cells transduced with empty lentiviral vector. HRAS protein expression level in corresponding cells is shown by western blot. ns: not significant (one-way ANOVA). f. HRAST50M and HRASR123C are located close to the predicted HRAS-KRAS interaction interface. Residue R123 (magenta) makes an intrachain salt bridge with E143 (cyan). g. Prey RAF proteins enriched in each experiment with the indicated baits in A549 cells or HEK293 cells. h. Western blot of cultured HRAS-null HOP62 cells (HOP62-Cas9-sgHRAS) re-expressing wild-type or mutant HRAS under Dox treatment. Cells were cultured under limited serum (1%) for 2 days before protein extraction. i. Proliferation of cultured HRAS-null HOP62 cells (HOP62-Cas9-sgHRAS) re-expressing wildtype or mutant HRAS under Dox treatment. Cells were cultured in limited serum (1%) with or without Dox for 4 days. Cell viability was measured via CCK8 assay and normalized to cells treated with vehicle. Re-expression of HRAS mutants had no effects on cell proliferation. Points are Mean±SD of 12 wells. ns: not significant (one-tailed t-test).
Figure 6.
Figure 6.. Paired screens in KRAS-driven and BRAF-driven lung cancer models validate HRAS and NRAS as KRAS-specific tumor suppressors.
a-b. Schematic of pairwise screens to assess tumor-suppressive function in KRAS- and BRAF-driven lung cancer. Tumors were initiated in KT;H11LSL-Cas9/+ and BrafCA/+T;H11LSL-Cas9 /+ (BrafT;H11LSL-Cas9/+) mice through intratracheal delivery of Lenti-sgMultiGEMM/Cre and Tuba-seq was performed on each tumor-bearing lung 15 weeks after initiation. c. Fluorescence images of representative lung lobes 15 weeks after tumor initiation. Scale bars: 5 mm. Lung lobes are outlined. d. Lung weights in KT;H11LSL-Cas9/+ and BrafT;H11LSL-Cas9/+ mice 15 weeks after tumor initiation. Each dot is a mouse, and mean values are indicated (one-tailed t-test). e-f. Size distribution of sgInert tumors in KT;H11LSL-Cas9/+ and BrafT;H11LSL-Cas9/+ mice. In e., each dot represents a tumor and has an area proportional to its size. A random sample of 1,000 tumors from each of five representative KT;H11LSL-Cas9/+ and BrafT;H11LSL-Cas9/+ mice is plotted. In f., the empirical cumulative distribution function of tumor sizes (>500 cells) across all KT;H11LSL-Cas9/+ and BrafT;H11LSL-Cas9/+ mice are plotted. g. Inactivation of either Hras or Nras increases tumor size in KT;H11LSL-Cas9/+ but not BrafT;H11LSL-Cas9/+ models. h. Comparison of the effects of inactivation of known tumor suppressors on tumor size in KT;H11LSL-Cas9/+ and BrafT;H11LSL-Cas9/+ models. For panels g, h: Points denote tumor sizes at indicated percentiles for each sgRNA relative to the size of sgInert-containing tumors at the corresponding percentiles in KT;H11LSL-Cas9/+ and BrafT;H11LSL-Cas9/+ mice. Line at y=1 indicates no effect relative to sgInert. Error bars indicate 95% confidence intervals around the point estimate of the test statistic. Percentiles that are significantly different from sgInert (two-sided FDR-adjusted p < 0.05) are in color. Confidence intervals and P-values were calculated using a nested bootstrap resampling approach across 11 KT;H11LSL-Cas9/+ mice and 14 BrafT;H11LSL-Cas9/+ mice. i. Schematic of the function of wild-type RAS paralogs as tumor suppressors in oncogenic KRAS-driven lung cancer. Left panel, wildtype RAS paralogs competitively interact with oncogenic KRAS and suppress oncogenic KRAS clustering. Right panel, inactivation of wild-type RAS alleles, or “RAS paralog imbalance”, hyper-activates oncogenic KRAS signaling and promotes lung cancer growth.

References

    1. Karnoub AE & Weinberg RA Ras oncogenes: split personalities. Nature reviews Molecular cell biology 9, 517–531 (2008). - PMC - PubMed
    1. Cox AD, Fesik SW, Kimmelman AC, Luo J. & Der CJ Drugging the undruggable RAS: mission possible? Nature reviews Drug discovery 13, 828–851 (2014). - PMC - PubMed
    1. Zhou B, Der CJ & Cox AD in Seminars in cell & developmental biology, Vol. 58 60–69 (Elsevier, 2016). - PMC - PubMed
    1. Wennerberg K, Rossman KL & Der CJ The Ras superfamily at a glance. Journal of cell science 118, 843–846 (2005). - PubMed
    1. Hobbs GA, Der CJ & Rossman KL RAS isoforms and mutations in cancer at a glance. Journal of cell science 129, 1287–1292 (2016). - PMC - PubMed

Publication types