. 2023 Feb;25(2):258-272.
doi: 10.1038/s41556-022-01056-x. Epub 2023 Jan 12.

Targeting Menin disrupts the KMT2A/B and polycomb balance to paradoxically activate bivalent genes

Affiliations

Targeting Menin disrupts the KMT2A/B and polycomb balance to paradoxically activate bivalent genes

Christina E Sparbier et al. Nat Cell Biol. 2023 Feb.

Abstract

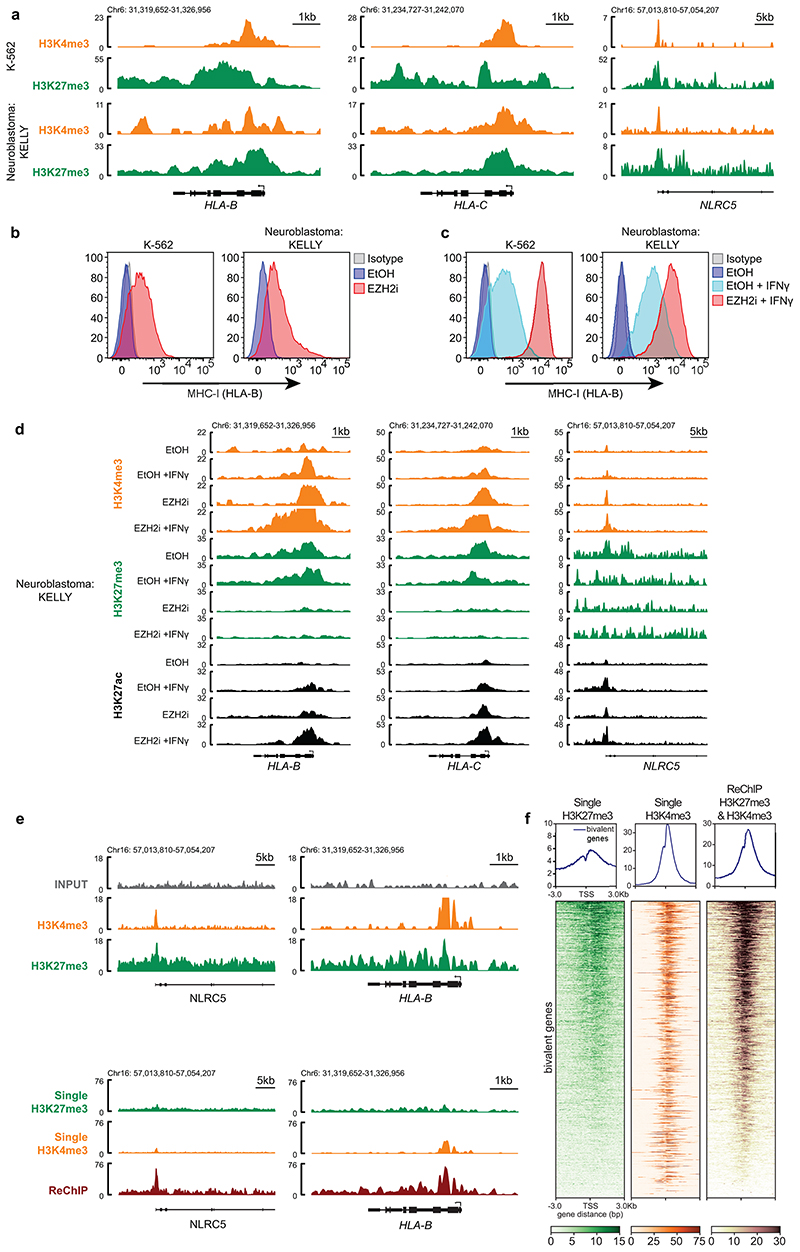
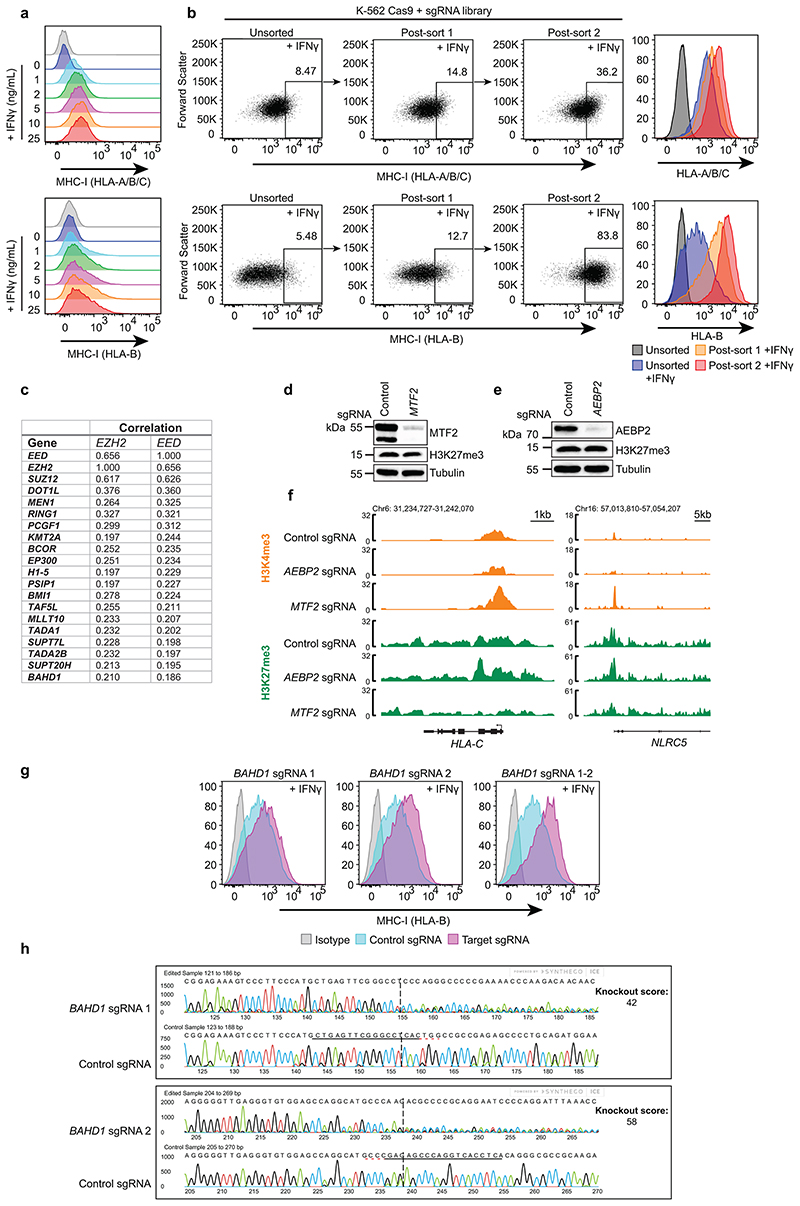
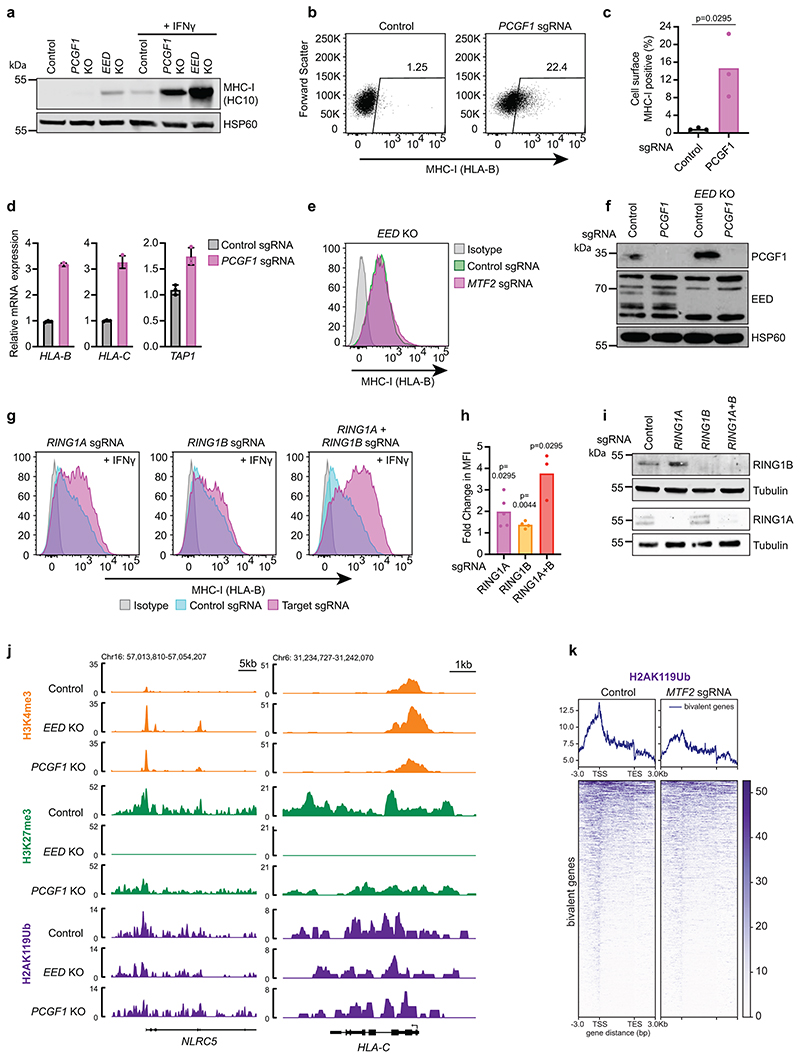
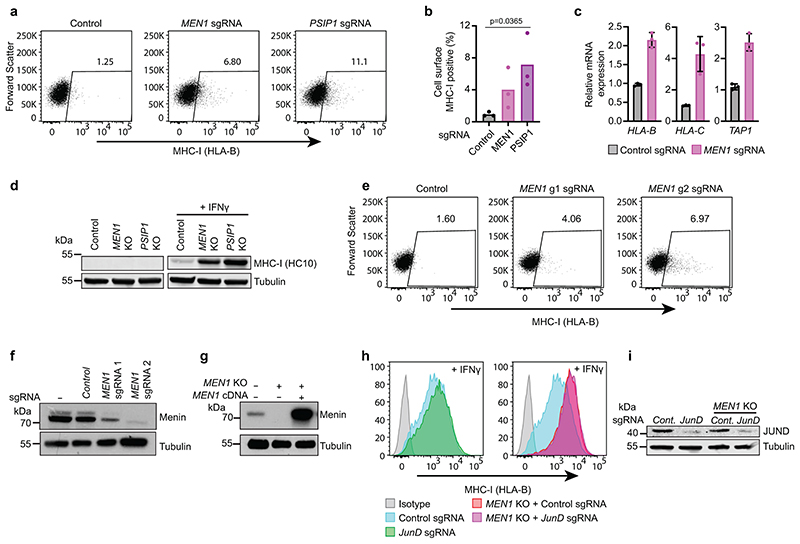
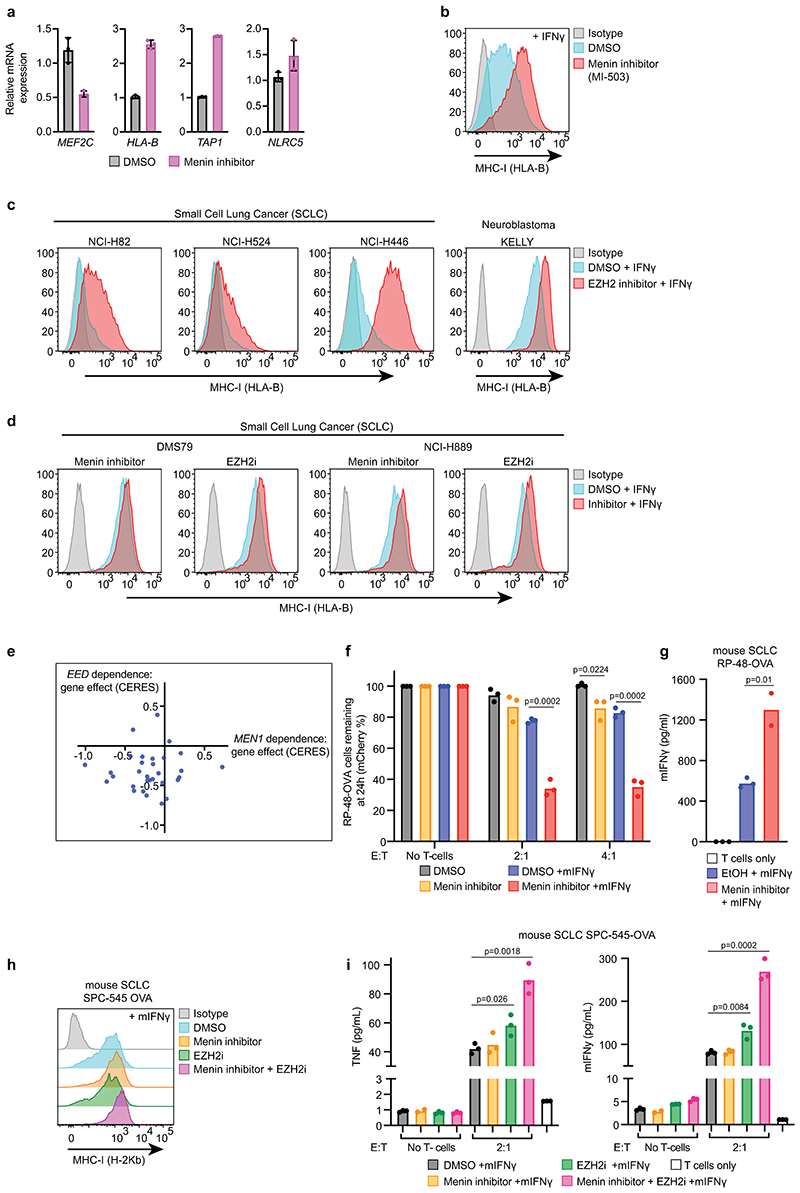
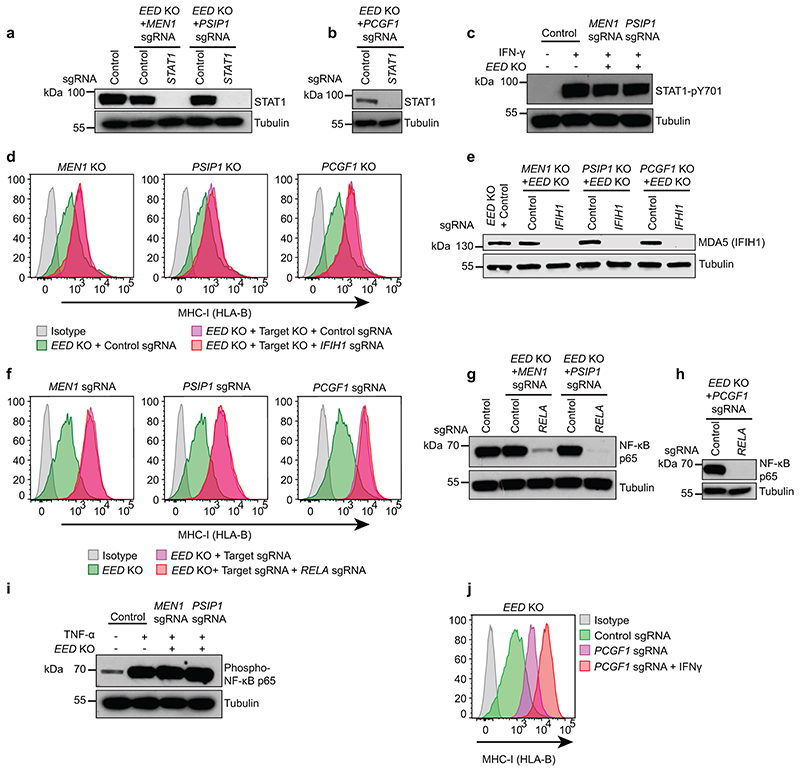
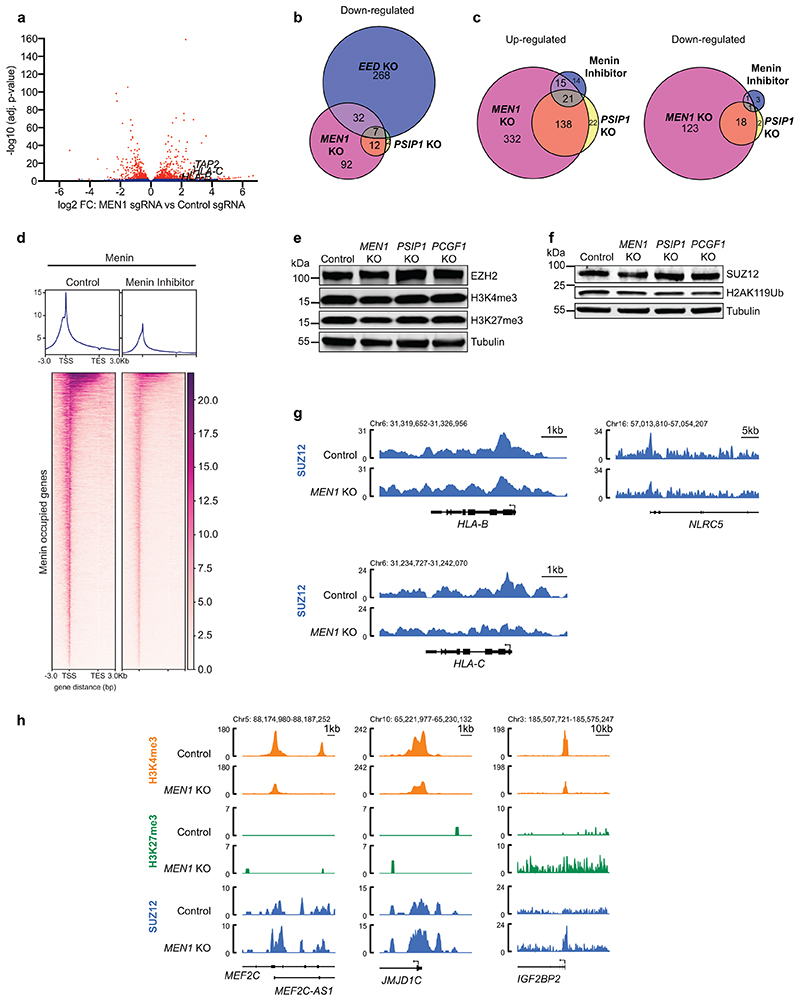
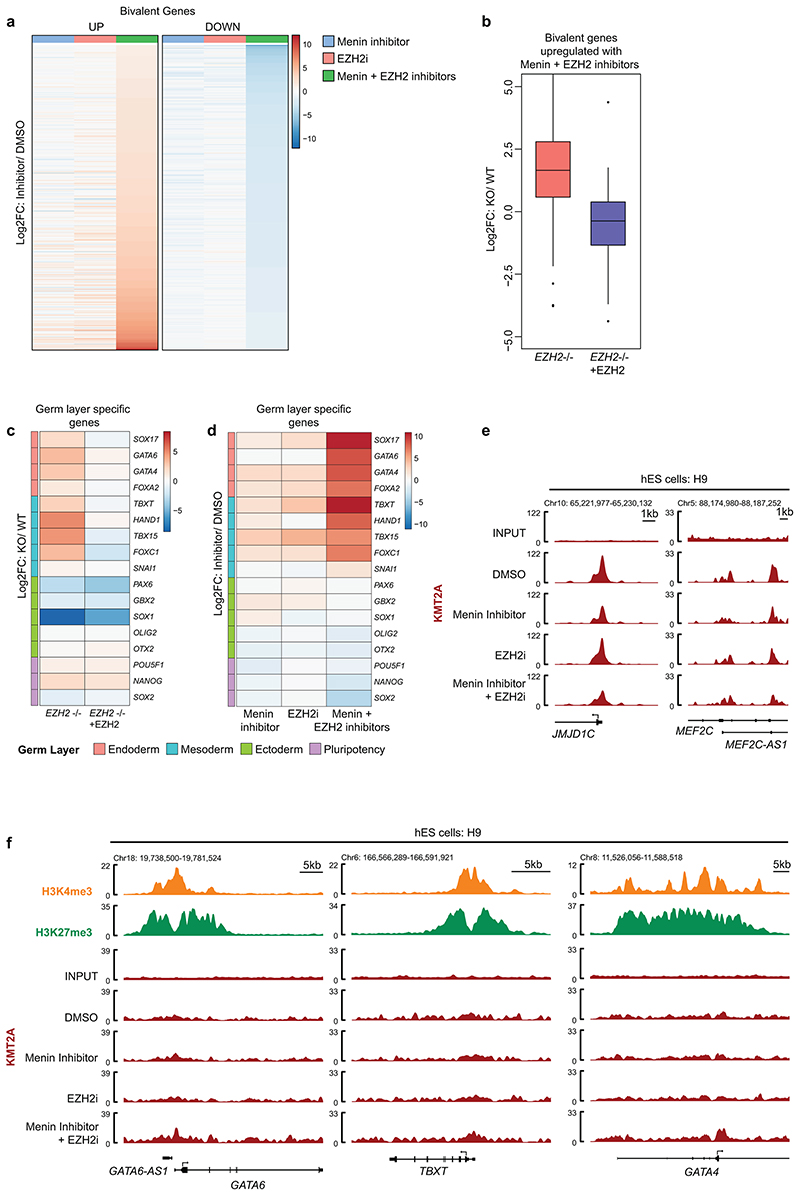
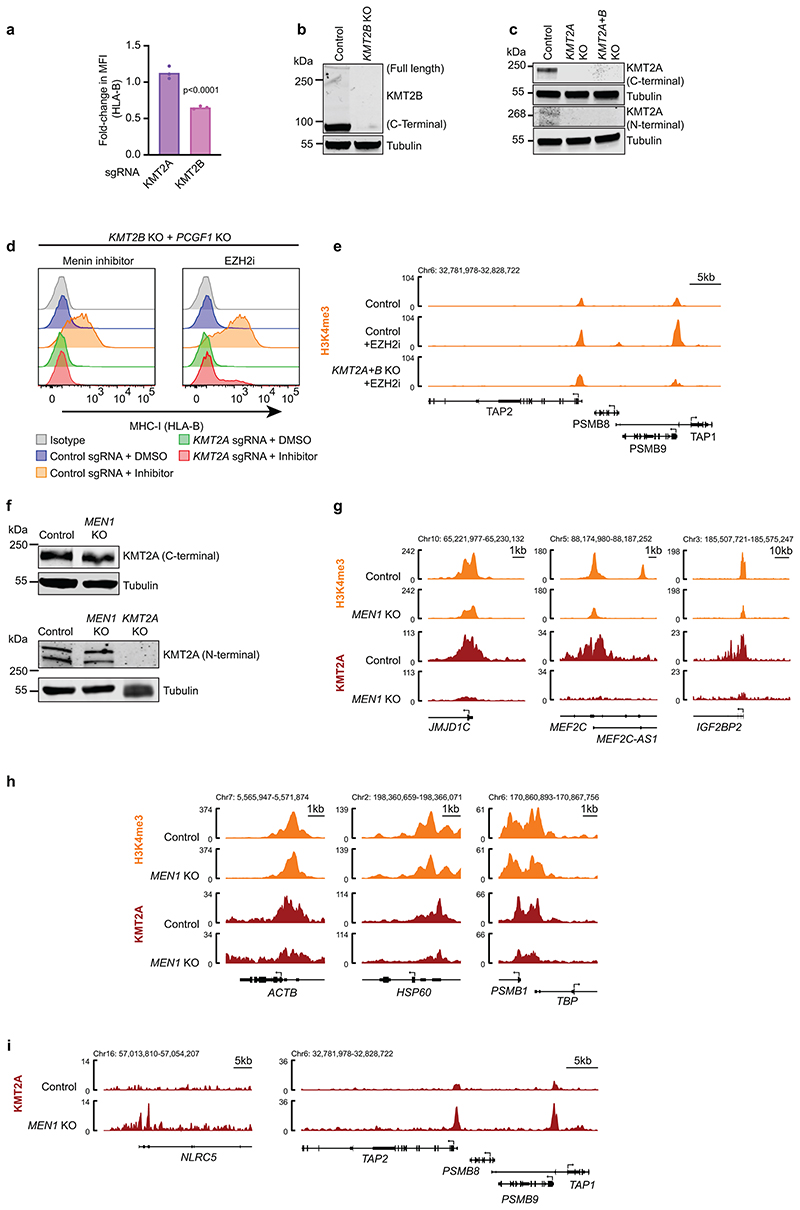
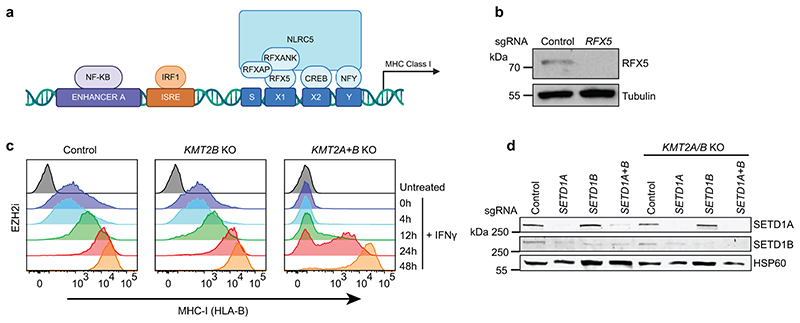
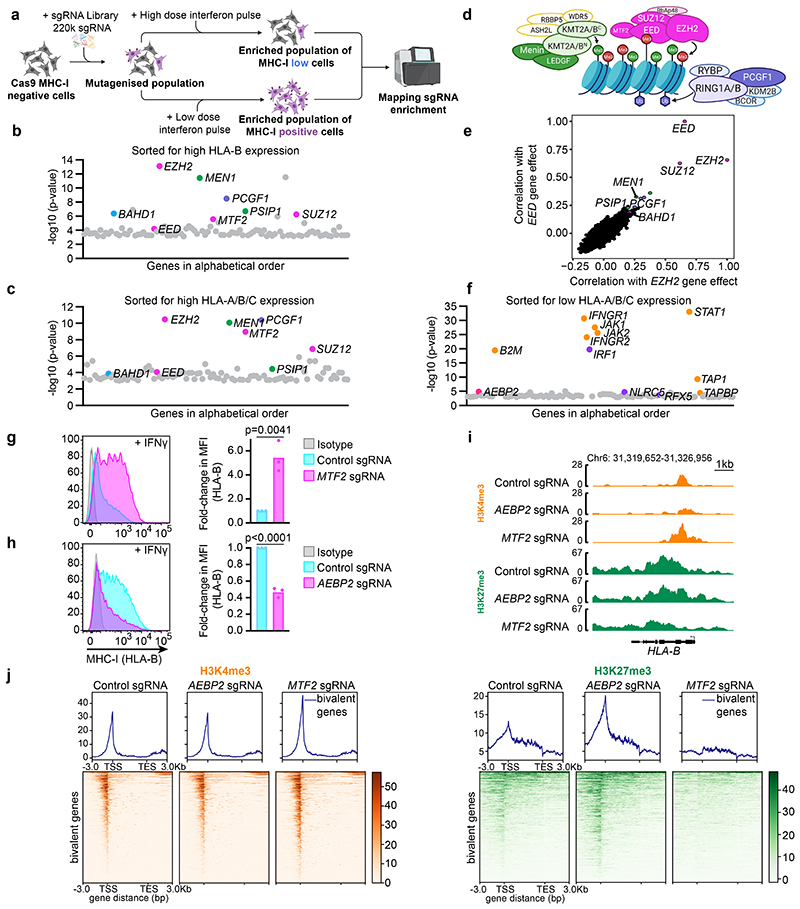
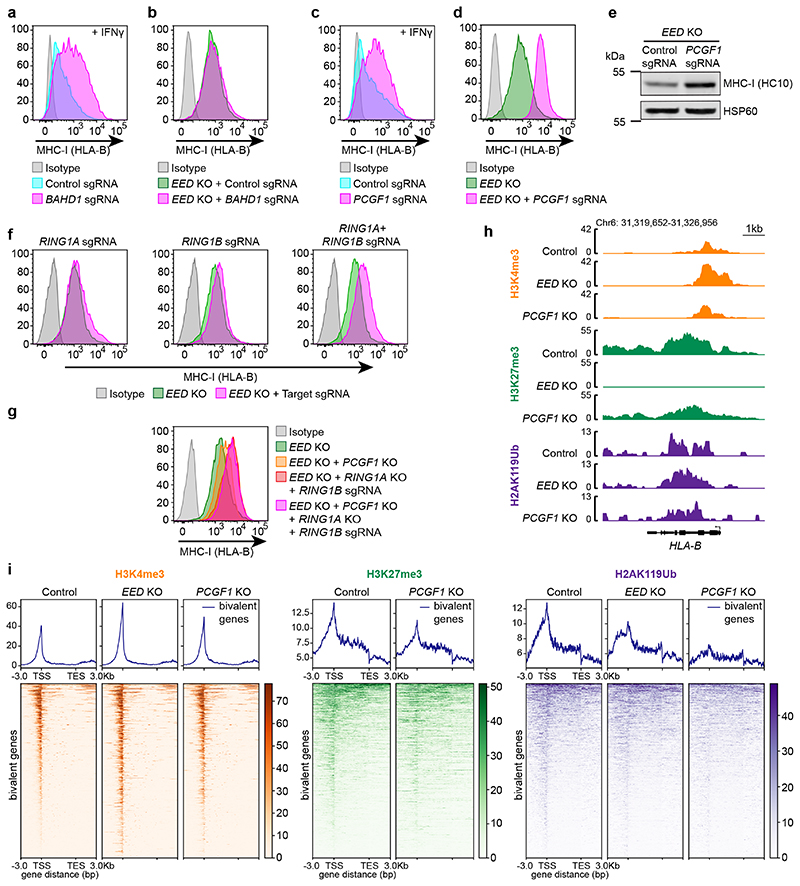
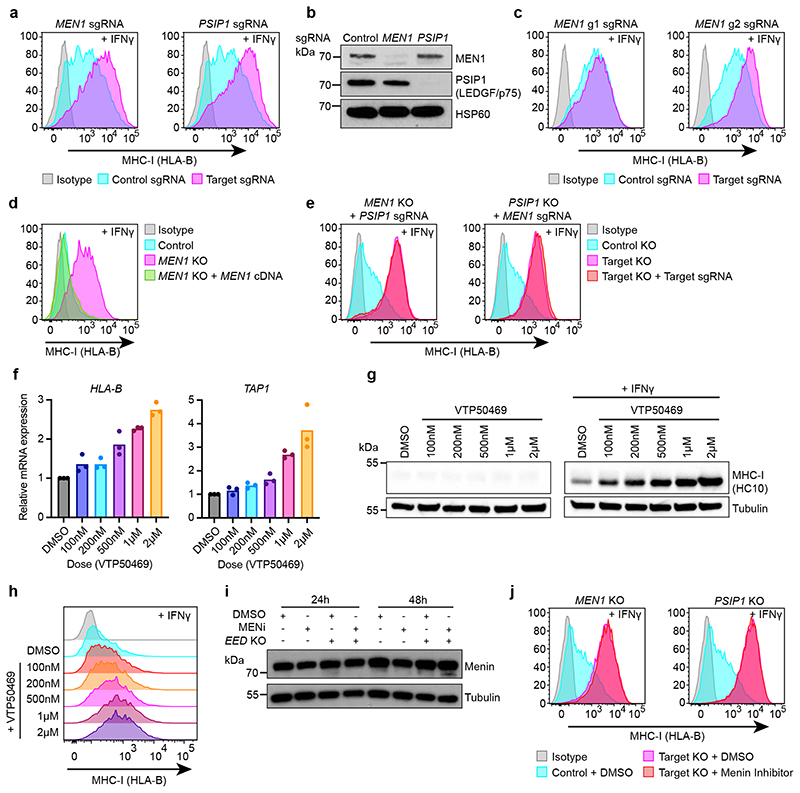
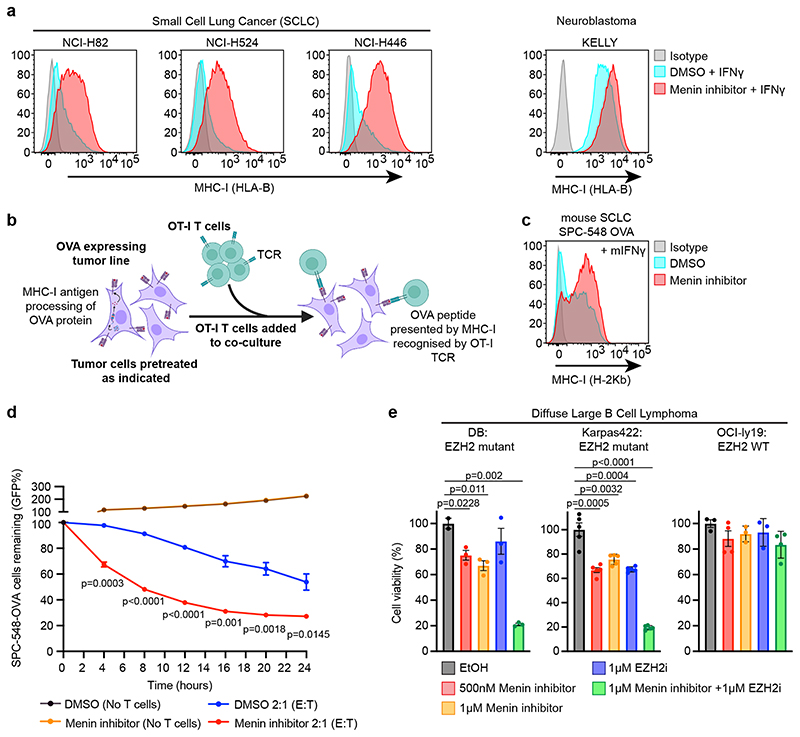
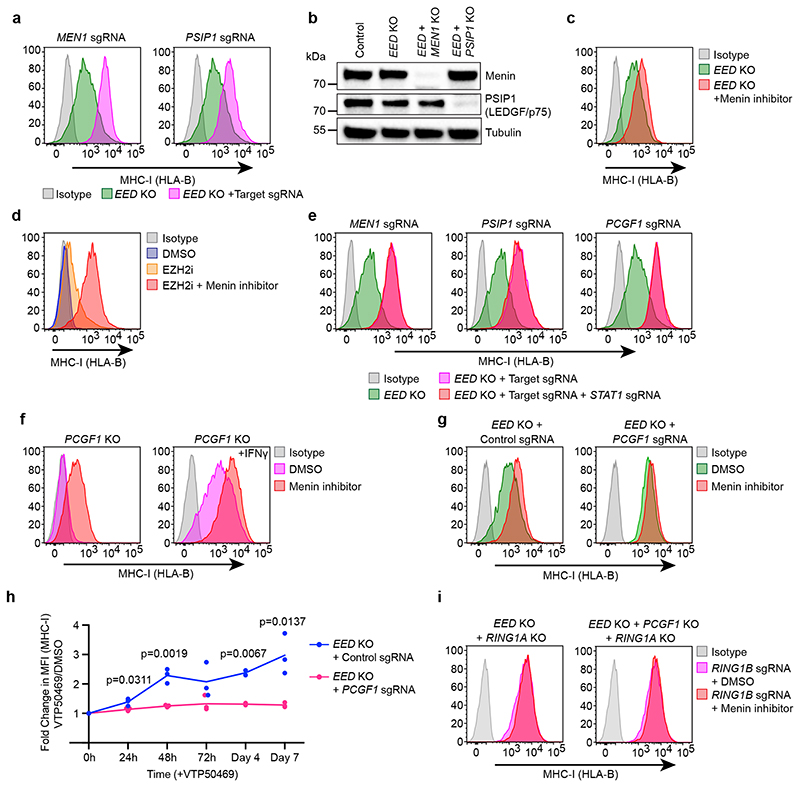
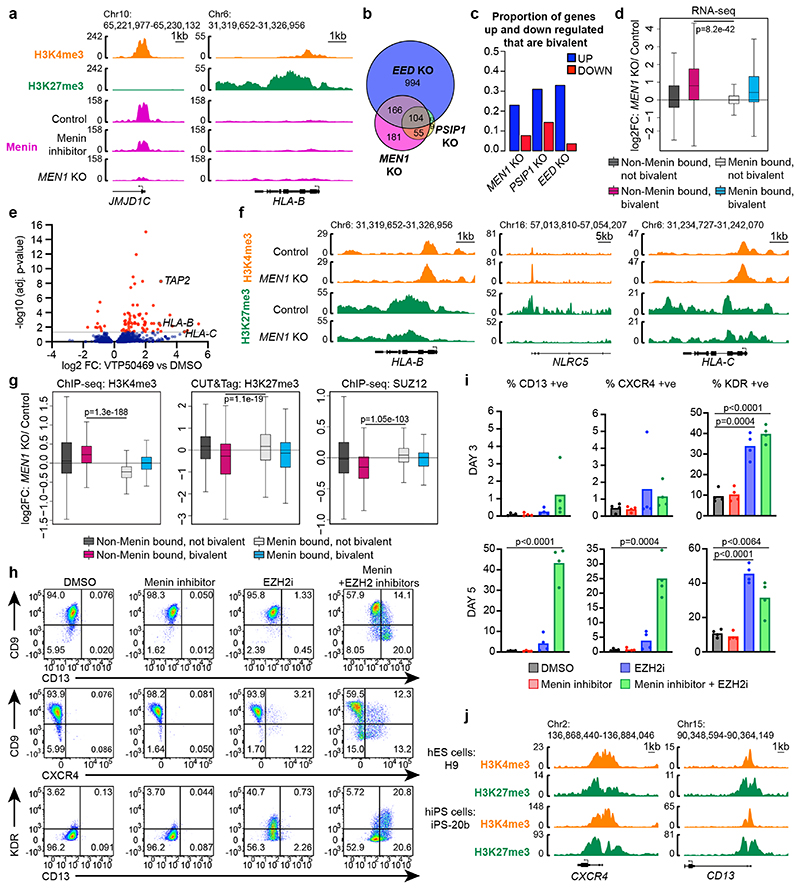
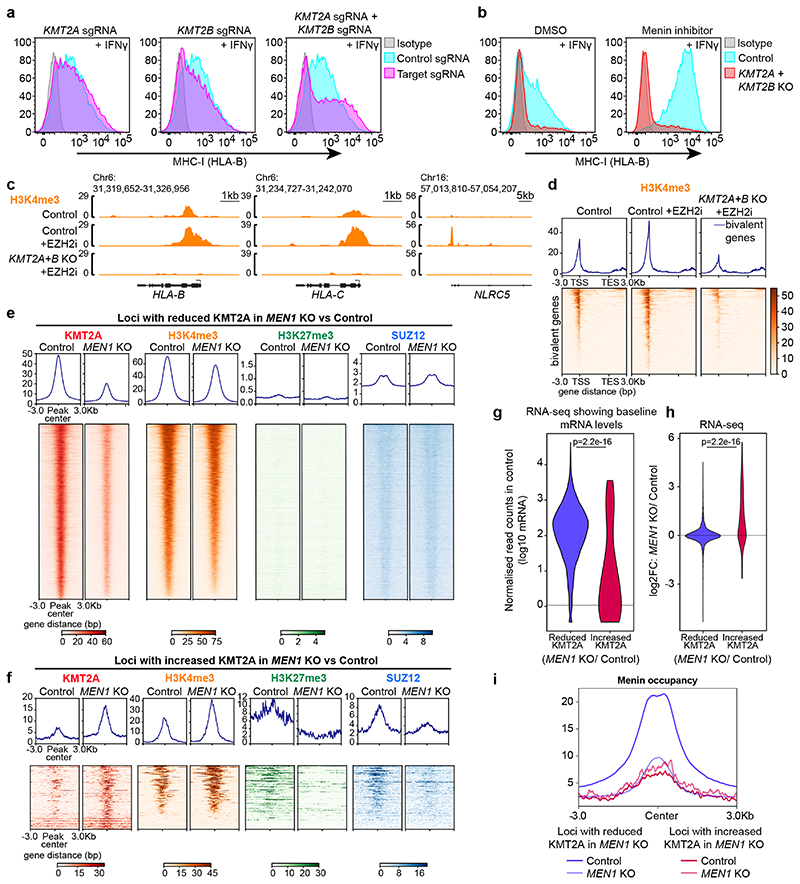
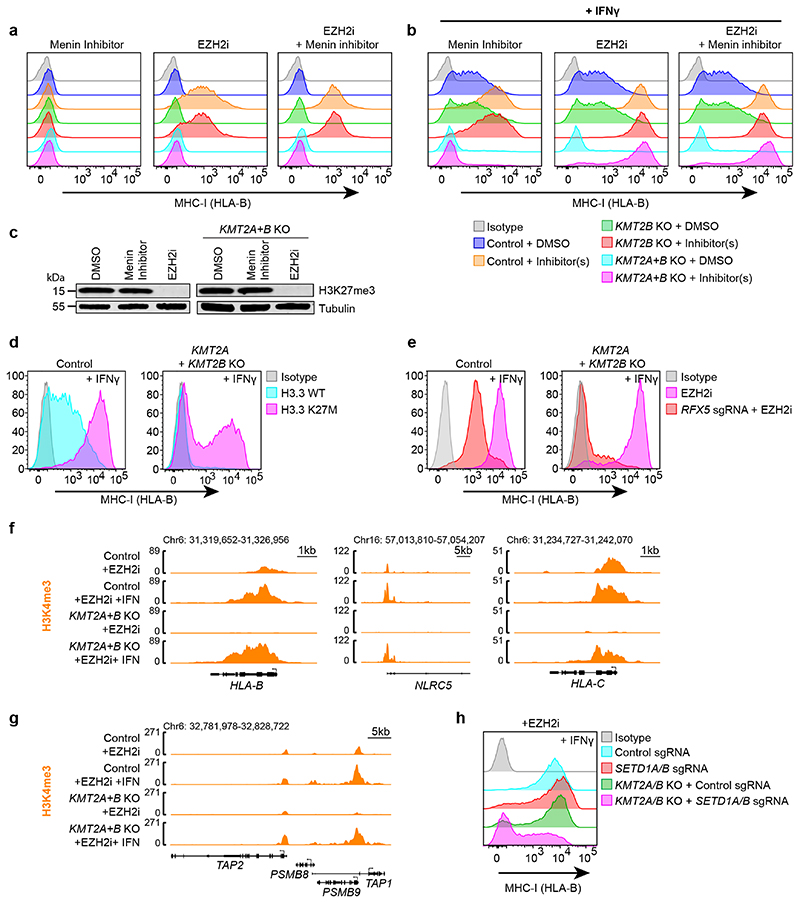
Precise control of activating H3K4me3 and repressive H3K27me3 histone modifications at bivalent promoters is essential for normal development and frequently corrupted in cancer. By coupling a cell surface readout of bivalent MHC class I gene expression with whole-genome CRISPR-Cas9 screens, we identify specific roles for MTF2-PRC2.1, PCGF1-PRC1.1 and Menin-KMT2A/B complexes in maintaining bivalency. Genetic loss or pharmacological inhibition of Menin unexpectedly phenocopies the effects of polycomb disruption, resulting in derepression of bivalent genes in both cancer cells and pluripotent stem cells. While Menin and KMT2A/B contribute to H3K4me3 at active genes, a separate Menin-independent function of KMT2A/B maintains H3K4me3 and opposes polycomb-mediated repression at bivalent genes. Release of KMT2A from active genes following Menin targeting alters the balance of polycomb and KMT2A at bivalent genes, facilitating gene activation. This functional partitioning of Menin-KMT2A/B complex components reveals therapeutic opportunities that can be leveraged through inhibition of Menin.


Conflict of interest statement

Competing interests

M.A.D. has been a member of advisory boards for GSK, CTX CRC, Storm Therapeutics, Celgene and Cambridge Epigenetix. The Dawson Laboratory is a recipient of grant funding through the emerging science fund administered through Pfizer. S.J.D. has been a member of advisory boards for Adela and Inivata. P.E. owns Amgen stocks (less than 5% value of company) and has undertaken prior consulting for Servier (less than $10,000). G.M.M is employed by Syndax Pharmaceuticals. The remaining authors declare no competing interests.

Figures

Extended Data Fig. 1
Extended Data Fig. 1. MHC-I genes harbour bivalent H3K4me3 and H3K27me3 modifications.
(a) Genomic snapshots of MHC-I genes showing H3K4me3 and H3K27me3 CUT&Tag in K-562 and ChIPseq in Neuroblastoma KELLY cell lines. The K-562 tracks are also shown in the control cells in Fig. 2h and H3K27me3 control cells in Fig. 6f. (b & c) Cell surface MHC-I in K-562 (left) and KELLY (right) cells following treatment with EPZ-011989 and (c) ± 10ng/mL IFN-γ (48h K-562, 24h KELLY). (d) Genomic snapshots of MHC-I genes showing ChIP-seq for H3K4me3, H3K27me3 and H3K27ac in KELLY cells treated with EtOH (control) or EPZ-011989 ± IFN-γ. (e & f) ChIP re-ChIP-seq of single H3K27me3, single H3K4me3 and reChIP (H3K27me3 and H3K4me3) in K-562 cells. (e) Genomic snapshots of bivalent MHC-I genes. (f) Heatmaps show bivalent genes -3kb TSS/ +3kb TES, with genomic regions ordered by H3K27me3 read density in the single H3K27me3 ChIP sample. (b/c) show representative plots from 3 experiments (Supplementary Figure 3).
Extended Data Fig. 2
Extended Data Fig. 2. Genome wide CRISPR/Cas9 screen identifies regulators of MHC Class I expression.
(a) Cell surface MHC-I, pan-HLA-A,B,C (top panel) and HLA-B (bottom) specific antibodies, in K-562 Cas9 cells treated with the indicated IFN-γ doses for 24h. (b) K-562 cells stably expressing Cas9 were mutagenised by infection with a pooled lentiviral sgRNA library and treated with 1ng/mL IFN-γ for 24h prior to FACS sorting. Rare MHC-I high cells were enriched by 2 successive rounds of FACS sorting for mCherry positive (containing sgRNA vector) MHC-I positive cells. FACS dot plots and histograms show MHC-I expression in unsorted, post sort 1 and post sort 2 in K-562 Cas9 cells transduced with the CRIPSR sgRNA library and sorted with either pan-HLA-A,B,C (top panels) or HLA-B (bottom panels) specific antibodies. (c) Table depicting correlation between CRISPR gene effect scores (Fig. 1e) for top 20 shared EZH2 and EED co-dependent genes calculated from combined CRISPR survival screens in 990 cancer cell lines in Cancer Dependency Map (httns://denman.org/nortal/), Table indicates Pearson correlation coefficients. (d & e) Immunoblots of K-562 Cas9 cells transduced with control and (d) MTF2 or (e) AEBP2 sgRNA. (f) H3K4me3 and H3K27me3 CUT&Tag. Genomic snapshots of bivalent MHC-I genes in K-562 cells transduced with control, MTF2 and AEBP2 sgRNA. The H3K4me3 control tracks are the same control tracks in Fig. 7c. (g) Cell surface MHC-I in K-562 Cas9 cells transduced with control or BAHD1-specific sgRNAs and treated with 10ng/mL IFN-γ for 48h. Representative plots from 3 experiments (Supplementary Figure 3). (h) Knockout scores of individual sgRNA targeting BAHD1 measured using Synthego Performance Analysis, Interference of CRISPR editing (ICE) Analysis.
Extended Data Fig. 3
Extended Data Fig. 3. Loss of PRC1 drives derepression of bivalent genes.
(a) Immunoblot of K-562 Cas9, PCGF1 KO and EED KO cells ± 10ng/mL IFN-γ (40h). (b & c) Cell surface MHC-I in K-562 Cas9 cells transduced with either control or PCGF1 sgRNA. (c) Bars show mean percentage of MHC-I expression from 3 experiments, indicated by points. Unpaired two-tailed t-test, p=0.0295. (d) qRT-PCR for MHC-I genes in K-562 Cas9 cells transduced with control or PCGF1 sgRNA. Bars indicate mean ± s.d. of technical triplicates from a representative experiment. (e) Cell surface MHC-I in EED KO cells transduced with control or MTF2 sgRNA. Representative plot from 3 experiments (Supplementary Figure 3). (f) Immunoblot of K-562 Cas9 and EED KO cells transduced with control and PCGF1 sgRNA. (g & h) Cell surface MHC-I in K-562 Cas9 cells transduced with RING1A and/or RING1B sgRNA, following treatment with 10ng/mL IFN-γ for 36h. (h) Bars show mean fold change in MFI from 3-5 experiments, indicated by points. Unpaired two-tailed t-test, p-values are indicated. (i) Immunoblot of K-562 Cas9 cells transduced with indicated sgRNA. (j) Genomic snapshots of bivalent MHC-I genes showing H3K4me3, H3K27me3 and H2AK119Ub CUT&Tag in K-562 Cas9 (control), EED KO and PCGF1 KO cells. The H3K4me3 and H3K27me3 control tracks are the same control tracks in Fig. 6f. (k) H2AK119Ub CUT&Tag in K-562 cells transduced with control or MTF2 sgRNA. Heatmaps show bivalent genes -3kb TSS/ +3kb TES. Genomic regions are ordered by H2AK119Ub read density in the control sample.
Extended Data Fig. 4
Extended Data Fig. 4. Depletion of Menin or LEDGF enhances basal and IFN-γ induced bivalent MHC-I gene expression.
(a & b) Cell surface MHC-I in K-562 Cas9 cells transduced with either control, MEN1 or PSIP1 sgRNA. (b) Bars show mean percentage of MHC-I expression from 3 experiments, indicated by points. Unpaired two-tailed t-test, significant changes are indicated, p=0.0356. (c) qRT-PCR for MHC-I genes in K-562 Cas9 cells transduced with control or MEN1 sgRNA. Bars indicate mean ± s.d. of technical triplicates from a representative experiment. (d) Immunoblot of K-562 Cas9, MEN1 KO and PSIP1 KO cells ± 10ng/mL IFN-γ for 40h. (e) Cell surface MHC-I in K-562 Cas9 cells transduced with control or indicated sgRNA targeting MEN1. (f & g) Immunoblots of (f) K-562 Cas9 cells transduced with control sgRNA or sgRNA targeting MEN1, (g) MEN1 KO cells ± MEN1 cDNA. (h & i) JunD is not required for enhanced MHC-I expression following MEN1 KO. K-562 Cas9 and MEN1 KO cells transduced with control or JunD sgRNA and analysed by (h) flow cytometry, following treatment with 10ng/mL IFN-γ for 48h, and (i) immunoblot. (h) Shows representative plots from 3 experiments (Supplementary Figure 3).
Extended Data Fig. 5
Extended Data Fig. 5. Pharmacological targeting of Menin-KMT2A/B and PRC2 similarly augment IFN-γ induced MHC-I expression in MHC-I low cancers and enhance T cell mediated killing.
(a) qRT-PCR analysis in K-562 cells treated ± 500nM VTP50469. Bars indicate mean ± s.d. of technical triplicates. (b) MI-503, a chemically distinct inhibitor of the Menin-KMT2A/B interaction, also enhanced IFN-γ induced MHC-I expression. Cell surface MHC-I in K562 Cas9 cells pre-treated with 500nM MI-503 and 10ng/mL IFN-γ (48h). Representative plot from 3 experiments (Supplementary Figure 3). (c) Cell surface MHC-I in cells treated with DMSO or 3μM EPZ-011989 and 10ng/mL IFN-γ (24h SCLC, 40h KELLY), (VTP50469 treatment: Figure 4a). Representative plots from independent experiments (n=2 SCLC, n=3 KELLY (Supplementary Figure 3)). (d) Cell surface MHC-I expression in SCLC cells treated with DMSO, 1μM VTP50469 or 3μM EPZ-011989 and 10ng/mL IFN-γ for 24h. Representative plots from 2 experiments (Supplementary Figure 3). (e) Scatter plot indicating MEN1 and EED CERES gene perturbation effects for neuroblastoma cell lines evaluated in combined CRISPR screens in DepMap (DepMap 21Q2 Public+Score, CERES (httos://denman.org/nortal/), (f) Flow cytometry analysis of RP-48-OVA cells pre-treated with DMSO or 1μM VTP50469 and 10ng/mL murine IFN-γ (24h) prior to co-culture with OVA antigen-specific OT-I T cells at the indicated effector:target (E:T) ratios. Bars indicate mean percent remaining mCherry positive (RP-48-OVA) cells compared to no T-cell control from 3 independent replicates, indicated by points. Unpaired two-tailed t-tests compared to respective DMSO controls. Significant changes are indicated. (g) Cytometric Beads Array (CBA) assay for mIFN-γ following 24h co-culture of RP-48-OVA cells pre-treated with DMSO or 1μM VTP50469 and 10ng/mL murine IFN-γ (24h) prior to co-culture with OVA antigen-specific OT-I T cells at a 2:1 (E:T) ratio. Bars show mean expression from 2-3 independent replicates, indicated by points. Unpaired two-tailed t-test, p=0.01. (h) Cell surface MHC-I in SPC-545-OVA cells pre-treated with DMSO, 1μM VTP50469 and/or 3μM EPZ-011989, and 1ng/mL murine IFN-γ (24h). Representative plot from 2 experiments (Supplementary Figure 3). (i) CBA assay for mIFN-γ and TNF following 4 days co-culture of pre-treated SPC-545-OVA cells (DMSO, 1μM VTP50469 and/or 3μM EPZ-011989 and 2h 20ng/mL mIFN-γ) with OVA antigen-specific OT-I T cells at a 2:1 (E:T) ratio. Bars show mean expression from 3 independent replicates, indicated by points. Unpaired two-tailed t-test compared to respective DMSO +mIFN-γ controls. Significant changes are indicated.
Extended Data Fig. 6
Extended Data Fig. 6. Targeting Menin drives expression of bivalent genes independently of interferon and NFkB signalling.
(a & b) Immunoblot in K-562 EED KO cells depleted of (a) MEN1, PSIP1 or (b) PCGF1, then transduced with indicated sgRNA. (c) Immunoblot in K-562 Cas9 and EED KO cells transduced with indicated sgRNA and treated ± 10ng/mL IFN-γ for 48h. (d-h) K-562 EED KO cells depleted of MEN1, PSIP1 or PCGF1 and transduced with indicated sgRNA, analysed by (d & f) flow cytometry, and (e, g & h) immunoblot. (i) Immunoblot in K-562 Cas9 and EED KO cells transduced with indicated sgRNA and treated ± 20ng/mL TNF-α for 48h. (j) Cell surface MHC-I expression in K-562 EED KO cells transduced with control or PCGF1 sgRNA and treated ± 25ng/mL IFN-γ for 24h. (d), (f) and (j) each show representative plots from 3 experiments (Supplementary Figure 3).
Extended Data Fig. 7
Extended Data Fig. 7. Loss of Menin alleviates repression of bivalent genes.
(a) Volcano plot showing Log2FC gene expression from RNA-seq data in K-562 cells expressing MEN1 sgRNA compared with control sgRNA. Selected MHC class I genes are labelled. Two-sided Wald test, p-values adjusted for multiple testing. (b) Venn diagram depicting overlap in genes down-regulated (p-adj <0.05 and fold-change >2) after CRISPR deletion of MEN1, PSIP1 or EED. (c) Venn diagrams depicting overlap in genes up and down-regulated (p-adj <0.05 and fold-change >2) after CRISPR deletion of MEN1 or PSIP1 or 500nM VTP50469 treatment. (d) Pharmacological inhibition of Menin-KMT2A/B induces genome wide displacement of Menin from chromatin. Menin ChIP-seq in K-562 cells treated for 48h with DMSO or 1μM VTP50469. Average profile plots (top) and heatmaps (bottom) of Menin occupied sites - 3kb TSS/ +3kb TES. Genomic regions are ordered by Menin occupancy in control sample. (e & f) Immunoblots of K-562 Cas9 (control), MEN1 KO, PSIP1 KO and PCGF1 KO cells. (g) Genomic snapshots of MHC-I genes from SUZ12 ChIP-seq data in K-562 Cas9 control and MEN1 KO cells. (h) Genomic snapshots of H3K4me3, SUZ12 ChIP-seq and H3K27me3 CUT&Tag in K-562 Cas9 control and MEN1 KO cells.
Extended Data Fig. 8
Extended Data Fig. 8. Targeting Menin potentiates bivalent gene derepression in human pluripotent stem cells.
(a) RNA-seq in H9 hESCs treated with DMSO, 1μM VTP50469 and/or 3μM EPZ-011989 for 5 days. Heatmap includes bivalent genes significantly up- or down-regulated in combination Menin/EZH2 inhibitor treated cells compared to DMSO control (p-adj <0.05 and Log2FC >1 or <-1). (b & c) RNA-seq in wildtype (WT), EZH2null (EZH2-/-) and EZH2-complemented EZH2null (EZH2-/-+EZH2) H9 hESCs (GEO: GSE76626). (b) Box-plots include the top upregulated bivalent genes in combination Menin + EZH2 inhibitor treated H9 hESCs (Log2FC >4 compared to DMSO control) and depict median Log2FC in expression in EZH2null or EZH2-complemented H9 hESCs compared to wildtype control. Whiskers represent the minimum and maximum, the box represents the interquartile range, and the centre line represents the median. (c) Heatmap shows Log2FC in expression of selected germ layer specific genes in either EZH2null or EZH2-complemented H9 hESCs compared to wildtype control. (d) Heatmap shows Log2FC in expression of selected germ layer specific genes in H9 hESCs treated with 1μM VTP50469 and/or 3μM EPZ-011989 compared to DMSO control. (e & f) ChIP-seq in H9 hESCs. Genomic snapshots showing data from (e) KMT2A, and (f) KMT2A, H3K4me3 (GEO: GSE96336) and H3K27me3 (GEO: GSE96353).
Extended Data Fig. 9
Extended Data Fig. 9. KMT2A/B is required for basal MHC-I expression.
(a) Cell surface MHC-I in K-562 Cas9 cells transduced with KMT2A or KMT2B sgRNA compared to control sgRNA and treated with 10ng/mL IFN-γ for 48h. Bars show mean percentage of MHC-I expression from 3 experiments, indicated by points. Unpaired two-tailed t-test compared to control sgRNA. Significant changes are indicated, p<0.0001. (b & c) Immunoblots in K-562 Cas9 and, (b) KMT2B KO cells, (c) KMT2A KO ± KMT2B KO cells. (d) Cell surface MHC-I in K-562 KMT2B + PCGF1 KO cells transduced with indicated sgRNA and treated for 5 days with DMSO, 1μM VTP50469 or 3μM EPZ-011989. Representative plot from 3 experiments (Supplementary Figure 3). (e) Genomic snapshots of H3K4me3 CUT&Tag in K-562 Cas9 and KMT2A/B KO cells treated ± EPZ-011989. The EZH2i treated (no IFN-γ) track is also shown in 8g. (f) Immunoblots in K-562 Cas9, MEN1 KO and KMT2A KO cells. (g-i) Genomic snapshots of K-562 Cas9, and MEN1 KO cells (g & h) H3K4me3 ChIP-seq and KMT2A CUT&RUN. The H3K4me3 tracks are also shown in Extended Data Fig. 7h. (i) KMT2A CUT&RUN.
Extended Data Fig. 10
Extended Data Fig. 10. KMT2A/B is dispensable for MHC enhanceosome driven activation.
(a) Schematic overview of cis-regulatory elements in the MHC-I promoter. NLRC5 forms an enhanceosome with the RFX (regulatory factor X) complex, made up of RFX5, RFXANK and RFAXP (RFX-associated ankyrin-containing protein); CREB (cAMP-responsive-element-binding); and NFY (nuclear transcription factor Y), which bind the SXY-molecule to activate transcription of MHC-I. (b) Immunoblot of K-562 Cas9 cells transduced with control and RFX5 sgRNA. (c) IFN-γ time-course in K-562 Cas9 and indicated KO cells treated with 3μM EPZ-011989 and 25ng/mL IFN-γ for the indicated time points. (d) Immunoblot of K-562 Cas9 and KMT2A/B KO cells transduced with control, SETD1A and/or SETD1B sgRNA.
Figure 1
Figure 1. Genome-scale CRISPR/Cas9 screens identify specific polycomb and KMT2complex components regulating bivalent gene activation.
(a) Schematic view of CRISPR screens to identify regulators that either enhance or restrict cytokine induced MHC-I expression. K-562 cells were mutagenised by infection with a genome-scale pooled lentiviral library comprising 220,000 sgRNA. Cells were pulsed with 1ng/mL or 25ng/mL IFN-γ for 24h prior to enrichment of MHC-I high or low cells by two-rounds of fluorescence-activated cell sorting (FACS). (b & c) Bubble plots show top 100 enriched genes identified in MHC-I high CRISPR screens. PRC2 complex highlighted in pink, PRC1 in purple and the KMT2A/KMT2B complex in green. p-values calculated using the RSA algorithm. (d) Schematic depicting complexes identified in CRISPR screens. KMT2A/B complex (MEN1, PSIP1/LEDGF), PRC2.1 (EED, EZH2, SUZ12, MTF2) and PRC1.1 (PCGF1). (e) EED and EZH2 co-dependent genes derived from CERES gene effect scores in combined CRISPR survival screens in 990 cancer cell lines in Cancer Dependency Map (https://depmap.org/portal/),. Plot displays correlation between CRISPR gene effect scores for indicated genes with CRISPR gene effect scores for EZH2 and EED (Pearson correlation coefficient). Genes highlighted correspond with hits identified in our CRISPR screen. (f) Bubble plot shows top 100 enriched genes identified in MHC-I low CRISPR screen. Genes highlighted in orange are known components of the interferon response pathway and MHC-I antigen processing pathway, in purple are transcription factors and enhanceosome components driving MHC-I expression, and pink, AEBP2, a PRC2.2 component. p-values calculated using the RSA algorithm. (g & h) K-562 Cas9 cells transduced with indicated sgRNA and treated with 10ng/mL IFN-γ for (g) 24h or (h) 36h. Cell surface MHC-I from a representative experiment (left). Bars (right) show mean fold change in median fluorescence intensity (MFI) from 3 experiments, indicated by points. Unpaired two-tailed t-test, p-values are (g) p=0.0041 and (h) p<0.0001. (i & j) H3K4me3 and H3K27me3 CUT&Tag in K-562 cells transduced with control, MTF2 or AEBP2 sgRNA. (i) Genomic snapshot of bivalent MHC-I gene, HLA-B. (j) Heatmaps show bivalent genes -3kb TSS/ +3kb TES. Genomic regions ordered by H3K4me3 or H3K27me3 read density in control samples.
Figure 2
Figure 2. PRC1.1 and PRC2.1 co-operate to restrict activation of bivalent genes.
(a-d) Cell surface MHC-I in K-562 Cas9 (a & c) or EED KO cells (b & d) transduced with the indicated sgRNA and treated with 10ng/mL IFN-γ for 24h as indicated. (e) Immunoblot in EED KO cells transduced with control or PCGF1 sgRNA. (f) Cell surface MHC-I in K-562 EED KO cells transduced with RING1A and/or RING1B sgRNA. (g) Cell surface MHC-I in K-562 cells with indicated knockouts, transduced with RING1B sgRNA as indicated. Representative plot from 2 experiments. (h & i) H3K4me3, H3K27me3 and H2AK119Ub CUT&Tag in K-562 Cas9 (control), EED KO and PCGF1 KO cells. (h) Genomic snapshot of bivalent MHC-I gene, HLA-B. (i) Heatmaps show bivalent genes -3kb TSS/ +3kb TES. Genomic regions are respectively ordered by H3K4me3, H3K27me3 or H2AK119Ub read density in control samples. (a-d) and (f) show representative plots from 3 experiments (Supplementary Figure 2).
Figure 3
Figure 3. Targeting Menin drives derepression of bivalent genes.
(a-c) K-562 Cas9 cells transduced with indicated sgRNA, treated ± 10ng/mL IFN-γ (48h) as indicated and analysed by (a & c) flow cytometry (a) from 2 (Supplementary Figure 2), and (c) from 4 experiments (Supplementary Figure 2), and (b) immunoblot. (d) Cell surface MHC-I in K-562 MEN1 KO cells transduced with a vector encoding MEN1 cDNA, treated with 10ng/mL IFN-γ for 24h. (e) K-562 MEN1 KO cells transduced with PSIP1 sgRNA and PSIP1 KO cells transduced with MEN1 sgRNA analysed by flow cytometry following treatment with 10ng/mL IFN-γ for 36h. (f) K-562 cells treated with indicated doses of VTP50469 for 48h and analysed by qRT-PCR, points indicate 3 independent replicates. (g & h) K-562 cells treated with the indicated doses of VTP50469 for 4 days ± 10ng/mL IFN-γ for 40h and analysed by (g) flow cytometry and (h) immunoblot. (i) Menin immunoblot in K-562 and EED KO cells treated ± 2μM VTP50469 for 24h or 48h. (j) Cell surface MHC-I in K-562 Cas9, MEN1 KO or PSIP1 KO cells treated ± 500nM VTP50469 and 10ng/mL IFN-γ for 36h. Representative plots from 2 experiments (Supplementary Figure 2). (d/e) each show representative plots from 3 experiments (Supplementary Figure 2).
Figure 4
Figure 4. Pharmacological inhibitors targeting the Menin-KMT2A/B interaction drive derepression of bivalent MHC-I genes in MHC-I low cancer cells and enhance T cell mediated tumour killing.
(a) Cell surface MHC-I in cells treated ± 1μM VTP50469 and 10ng/mL (SCLC) or 25ng/mL (Neuroblastoma) IFN-γ for 24h. Representative plots from 2 (SCLC) and 3 (KELLY) experiments (Supplementary Figure 2). (b) Schematic view of co-culture assay. (c) Cell surface MHC-I in SPC-548-OVA cells treated ± 1μM VTP50469 and 1ng/mL murine IFN-γ for 24h. Representative plot from 3 experiments (Supplementary Figure 2). (d) IncuCyte live cell analysis of SPC-548-OVA cells treated ± 1μM VTP50469 prior to co-culture with OVA antigen-specific OT-I T cells at a 2:1 effector:target (E:T) ratio. Points indicate mean ± s.e.m. percent remaining GFP positive (SPC-548-OVA) cells compared to baseline from 3 independent replicates. p-values calculated using unpaired two-tailed t-test comparing Menin inhibitor treated sample to DMSO control. p-values are indicated. (e) CellTiter-Glo assay in specified DLBCL cell lines treated with VTP50469 and/or EPZ-011989 for 5 days. Points indicate mean percent signal relative to vehicle treated control ± s.e.m. Points indicate biologically independent replicates (DB n=2-3, Karpas422 n=5 and OCI-ly19 n=3-4). p-values calculated using unpaired two-tailed t-tests comparing each sample to respective EtOH control. Significant changes are indicated.
Figure 5
Figure 5. Targeting Menin alleviates polycomb-mediated repression of bivalent genes.
(a) Cell surface MHC-I in K-562 EED KO cells transduced with indicated sgRNA. (b) Immunoblot in K-562 Cas9 (control) and EED KO cells transduced with indicated sgRNA. (c) Cell surface MHC-I in K-562 EED KO cells treated ± 500nM VTP50469 for 48h. (d) Cell surface MHC-I in K-562 Cas9 treated with DMSO, 3μM EPZ-011989 ± 500nM VTP50469. (e) Loss of MEN1, PSIP1 and PCGF1 upregulates MHC-I independently of STAT1. Cell surface MHC-I in K-562 EED KO cells transduced with indicated target sgRNA ± STAT1 sgRNA. (f) Combined targeting of PRC1 and Menin enhances MHC-I expression. Cell surface MHC-I in K-562 PCGF1 KO cells pre-treated ± 500nM VTP50469 and ± 10ng/mL IFN-γ (40h) where indicated. (g-i) Menin inhibition does not further induce MHC-I in polycomb deficient cells. (g & h) Cell surface MHC-I in K-562 EED KO cells transduced with control or PCGF1 sgRNA, treated with 1μM VTP50469 for (g) 48h and (h) indicated time points. Points show mean fold change in MFI from 3 experiments. p-values calculated using unpaired two-tailed t-tests comparing PCGF1 sgRNA to Control sgRNA at each time-point. Significant changes are indicated. (i) Cell surface MHC-I in K-562 cells with indicated knockouts, transduced with RING1B sgRNA and treated with DMSO or 1μM VTP50469. Representative plots from 2 experiments (Supplementary Figure 2). (a) and (c-h) each show representative plots from 3 experiments (Supplementary Figure 2).
Figure 6
Figure 6. Displacement of Menin from distant genomic loci activates bivalent gene expression.
(a) H3K4me3 ChIP-seq and H3K27me3 CUT&Tag in K-562 Cas9 cells, and Menin ChIP-seq data in Cas9, 1μM VTP50469 treated (48h) and MEN1 KO cells. Genomic snapshots of Menin-KMT2A/B target gene, JMJD1C, and bivalent MHC-I gene, HLA-B. The H3K4me3 and H3K27me3 tracks are the same control tracks in Fig. 2h. (b) Venn diagram depicting overlap in genes up-regulated (FDR p-adj <0.05 and fold-change >2) after CRISPR deletion of MEN1, PSIP1 and EED. (c) Proportion of genes that are bivalent amongst genes showing increased or decreased expression (FDR p-adj <0.05 and fold-change >2) following CRISPR deletion of MEN1, PSIP1 and EED. (d) Box-plot depicting Log2FC in gene expression in K-562 MEN1 KO cells compared to Cas9 control from 3 biological replicates. Two-sided Welch’s t-tests, p=8.2e-42. (e) Volcano plot of the top 3,000 genes (Log2FC) from RNA-seq in K-562 cells treated with DMSO or 500nM VTP50469. Selected MHC-I genes are labelled. Two-sided Wald test, p-values adjusted for multiple testing. (f & g) H3K4me3, SUZ12 ChIP-seq and H3K27me3 CUT&Tag in K-562 Cas9 control and MEN1 KO cells. (f) Genomic snapshots of MHC-I genes. The tracks in control cells are the same control tracks in Fig. 2h. (g) Box-plots, from a representative experiment, depicting changes H3K4me3 (left), H3K27me3 (middle) and SUZ12 (right) at Menin and non-Menin bound, bivalent and not-bivalent genes (Log2FC). Two-sided Welch’s t-tests, p-values indicated. (h & i) Flow cytometry in human iPSCs treated with VTP50469 and/or EPZ-011989 for 5 days or indicated times. (h) Cell surface CD9, CD13, CXCR4 and KDR. (i) Points show mean percentage of CD13, CXCR4 and KDR positive cells from 4 independent experiments. p-values calculated using unpaired two-tailed t-tests comparing each sample to respective DMSO control. Significant changes are indicated. (j) Genomic snapshots of bivalent genes CD13 (ANPEP) and CXCR4 showing H3K4me3 and H3K27me3 ChIP-seq data in human embryonic cell line H9 (GEO:GSE96336, GEO:GSE96353) and human induced pluripotent stem cell line iPS-20b (GEO:GSM772844, GEO:GSM772847) . (d & g) Whiskers represent minimum and maximum, the box represents the interquartile range, and the centre line represents the median.
Figure 7
Figure 7. Opposing functions of KMT2A/B and Menin in regulation of bivalent gene expression.
(a & b) MHC-I gene expression is dependent on KMT2A/B. (a) Cell surface MHC-I in K-562 Cas9 cells transduced with sgRNA targeting KMT2A and/or KMT2B (polyclonal population) and treated with 25ng/mL IFN-γ for 48h. (b) Cell surface MHC-I in K-562 Cas9 and KMT2A/B KO clone pre-treated with DMSO or 1μM VTP50469 and 25ng/mL IFN-γ for 36h. (c & d) H3K4me3 CUT&Tag in K-562 Cas9 and KMT2A/B KO cells treated ± EPZ-011989. (c) Genomic snapshots of MHC-I genes. The control cell tracks are also shown in Fig. 1i. (d) Average profile plots (top) and heatmaps (bottom) of bivalent genes -3kb TSS/ +3kb TES. Genomic regions ordered by read density in the control sample. (e-i) KMT2A (CUT&Run), H3K4me3, SUZ12 (ChIP-seq) and H3K27me3 (CUT&Tag) in K562 Cas9 control and MEN1 KO cells. (e & f) Heatmaps show loci with (e) reduced, or (f) increased KMT2A occupancy in MEN1 KO cells compared to control. Genomic regions are ordered by H3K4me3 read density in control samples. (g/h) Violin-plots show (g) baseline mRNA expression (normalised read counts), and (h) Log2FC in gene expression, for genes showing either reduced or increased KMT2A occupancy in MEN1 KO cells compared to control. Two-sided Wilcoxan t-test, p=2.2e-16. (i) Average profile plot of Menin occupancy from Menin ChIP-seq data in K-562 Cas9 control and MEN1 KO cells at loci that have reduced or increased KMT2A occupancy in MEN1 KO cells compared to control. (a/b) show representative plots from 3 experiments (Supplementary Figure 2).
Figure 8
Figure 8. Transcription factor binding bypasses the requirement for KMT2A/B for bivalent gene activation.
(a & b) Cell surface MHC-I in K-562 Cas9, KMT2B KO and KMT2A/KMT2B KO cells treated with 1μM VTP50469 (left), 3μM EPZ-011989 (middle) and combination (right), and (b) treated with 25ng/mL IFN-γ for 48h. (c) Immunoblot of K-562 Cas9 and KMT2A/B KO cells treated with DMSO, 1μM VTP50469 or 3μM EPZ-011989. (d) Cell surface MHC-I in K-562 Cas9 and KMT2A/KMT2B KO cells transduced with lentiviral vectors encoding H3.3 WT or K27M and treated with 25ng/mL IFN-γ for 48h. Representative plots from 2 experiments (Supplementary Figure 2). (e) Overcoming dependence on KMT2A/B is reliant on the NLCRC5-RFX5-enhanceosome. Cell surface MHC-I in K-562 Cas9 and KMT2A/KMT2B KO cells transduced with RFX5 sgRNA and treated with 3μM EPZ-011989 and 25ng/mL IFN-γ (48h). (f & g) Genomic snapshots of MHC-I genes showing H3K4me3 CUT&Tag in K-562 Cas9 and KMT2A/B KO cells pre-treated with EPZ-011989 ± 25ng/mL IFN-γ (48h). The EZH2i treated (no IFN-γ) tracks are also shown in Fig. 7c. (h) Cell surface MHC-I in K-562 Cas9 and KMT2A/B KO cells transduced with control or SETD1A + SETD1B sgRNA, treated with EPZ-011989 and 25ng/mL IFN-γ (48h). Representative plot from 4 experiments (Supplementary Figure 2). (a/b) and (e) are representative plots from 3 experiments (Supplementary Figure 2).

Comment in

Similar articles

Cited by

References

    1. Kuroda MI, Kang H, De S, Kassis JA. Dynamic Competition of Polycomb and Trithorax in Transcriptional Programming. Annu Rev Biochem. 2020;89:235–253. - PMC - PubMed
    1. Yu JR, Lee CH, Oksuz O, Stafford JM, Reinberg D. PRC2 is high maintenance. Genes Dev. 2019;33:903–935. - PMC - PubMed
    1. Hughes AL, Kelley JR, Klose RJ. Understanding the interplay between CpG island-associated gene promoters and H3K4 methylation. Biochim Biophys Acta Gene Regul Mech. 2020;1863:194567. - PMC - PubMed
    1. Cenik BK, Shilatifard A. COMPASS and SWI/SNF complexes in development and disease. Nat Rev Genet. 2021;22:38–58. - PubMed
    1. Laugesen A, Hojfeldt JW, Helin K. Molecular Mechanisms Directing PRC2 Recruitment and H3K27 Methylation. Mol Cell. 2019;74:8–18. - PMC - PubMed

Publication types

Substances