. 2023 Jan;25(1):134-144.
doi: 10.1038/s41556-022-01047-y. Epub 2023 Jan 12.

Polycomb repressive complexes 1 and 2 are each essential for maintenance of X inactivation in extra-embryonic lineages

Affiliations

Polycomb repressive complexes 1 and 2 are each essential for maintenance of X inactivation in extra-embryonic lineages

Osamu Masui et al. Nat Cell Biol. 2023 Jan.

Abstract

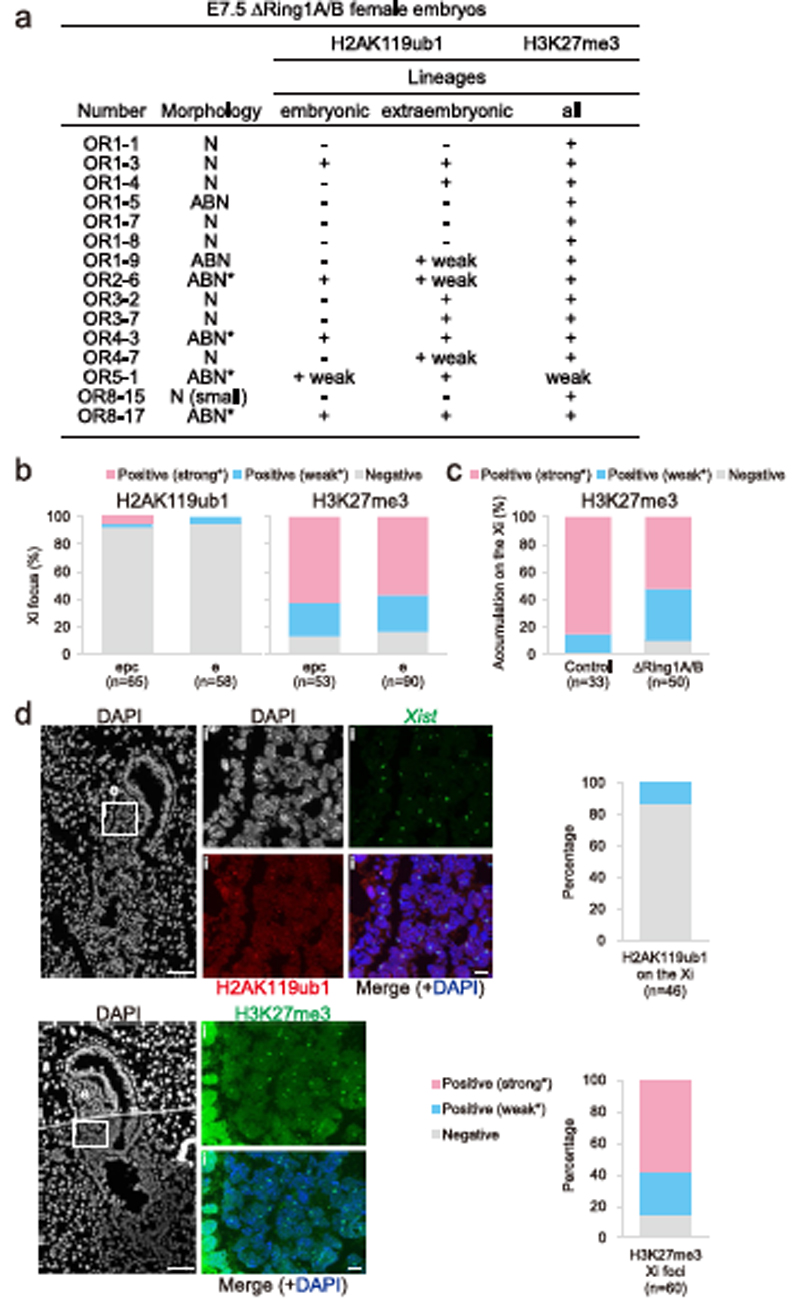
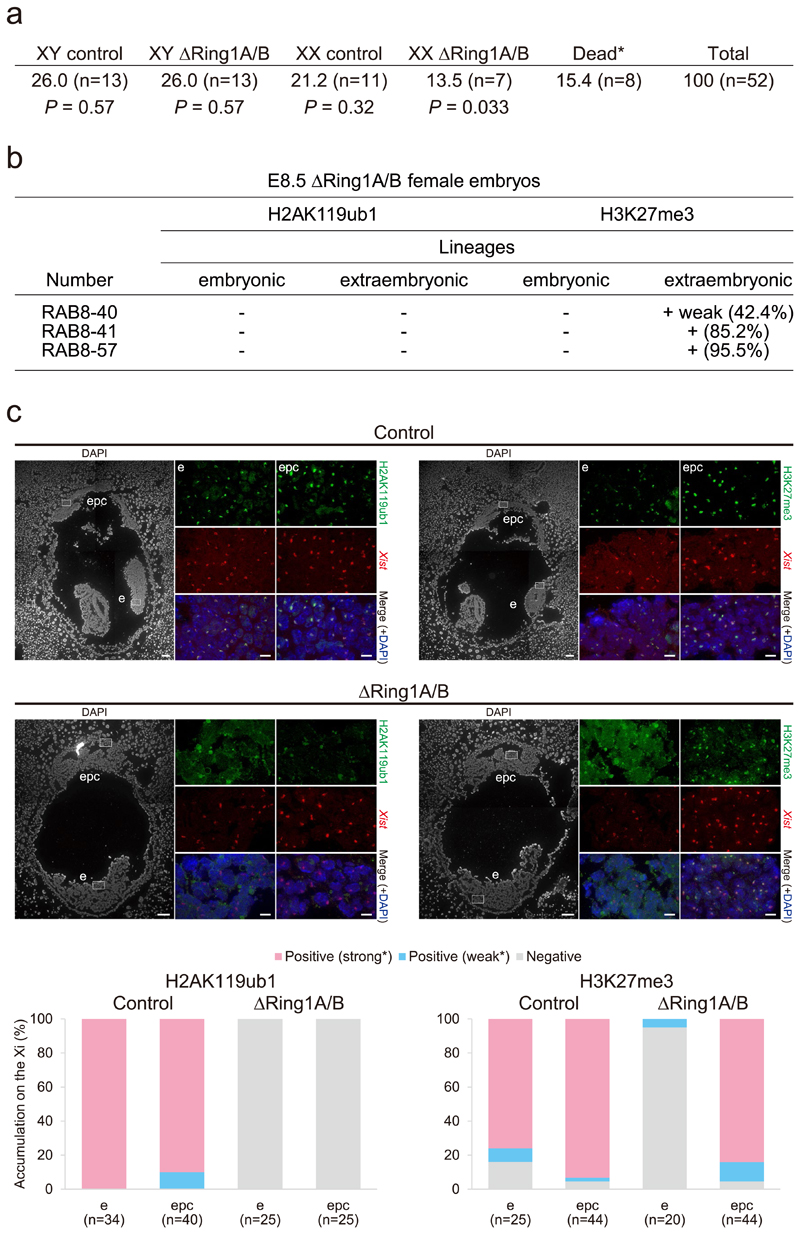
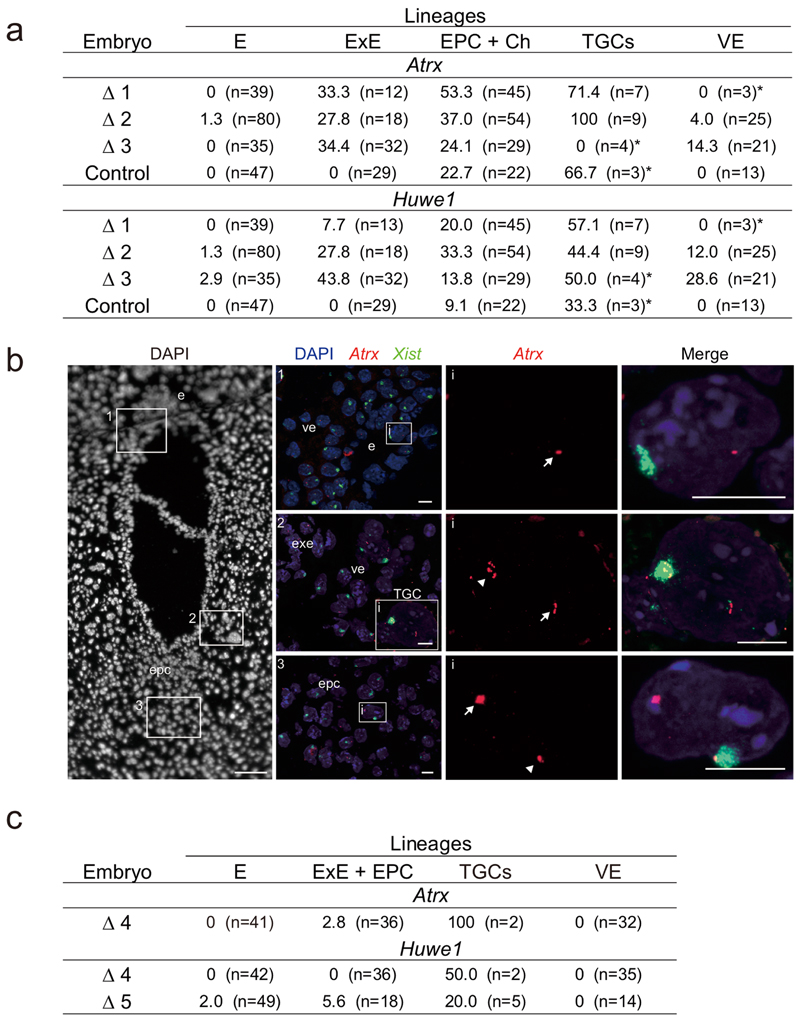
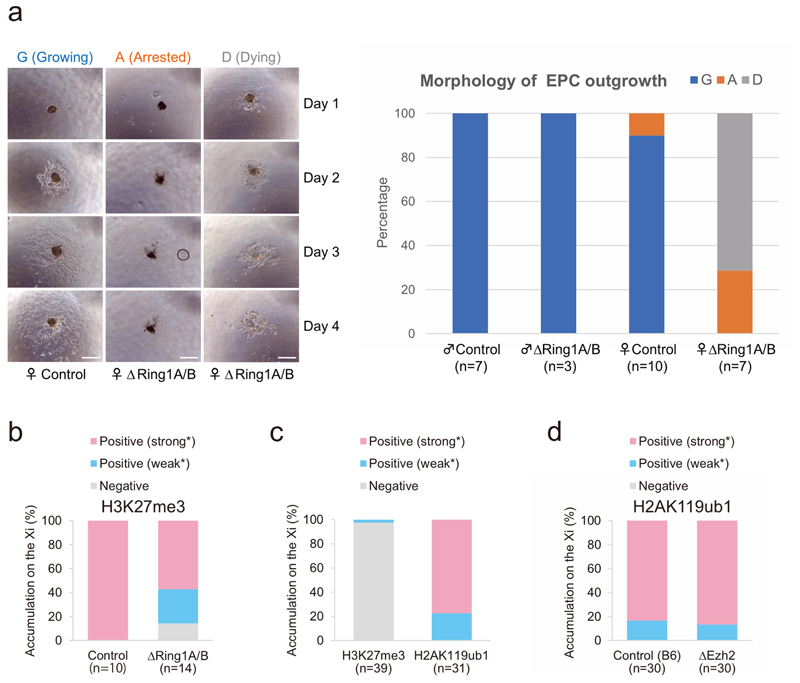
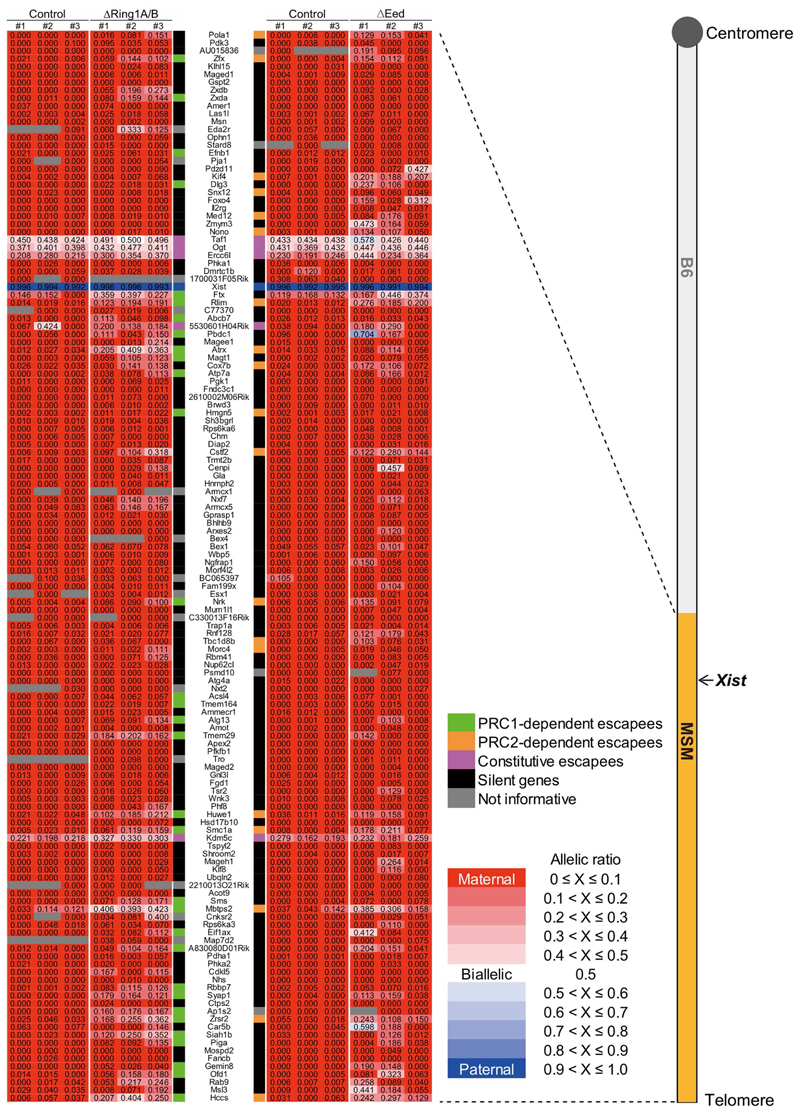
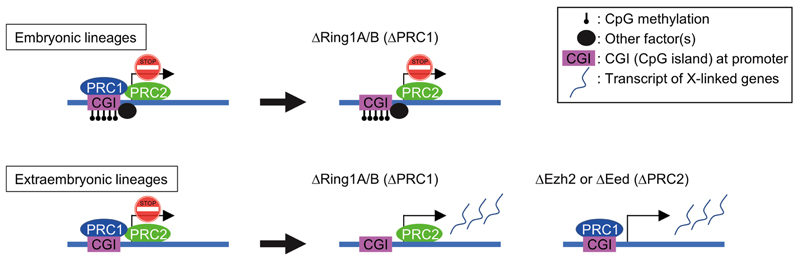
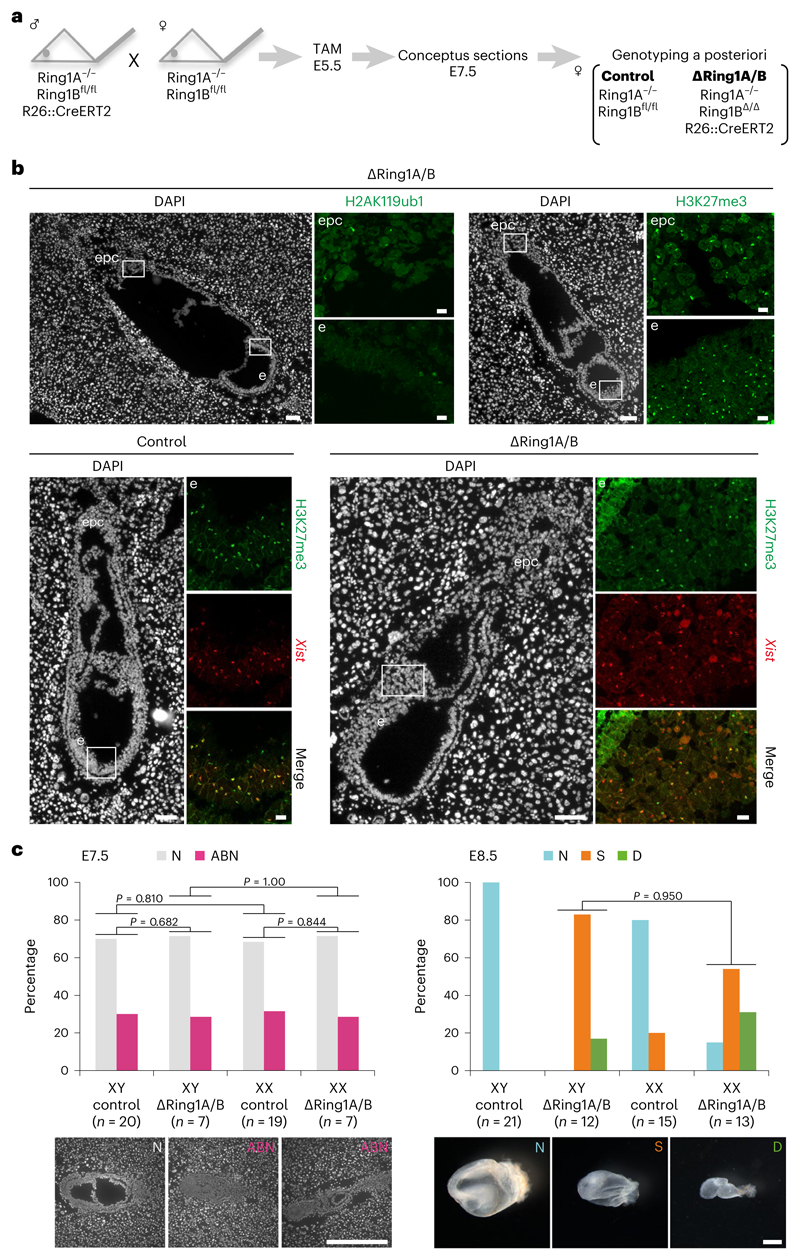
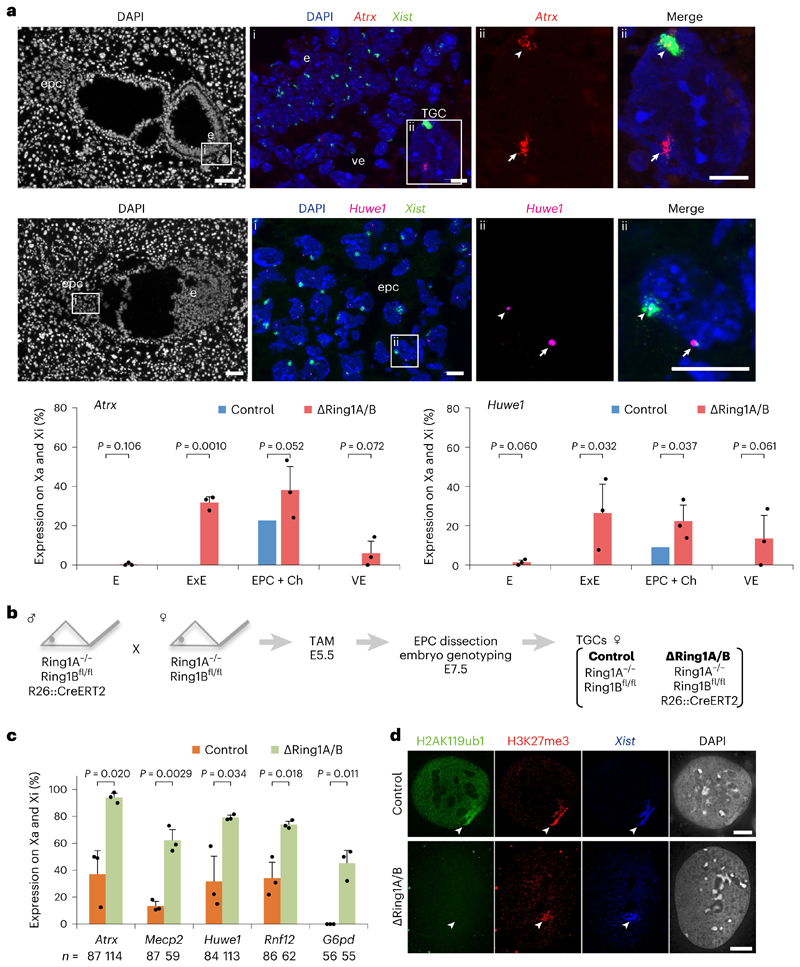
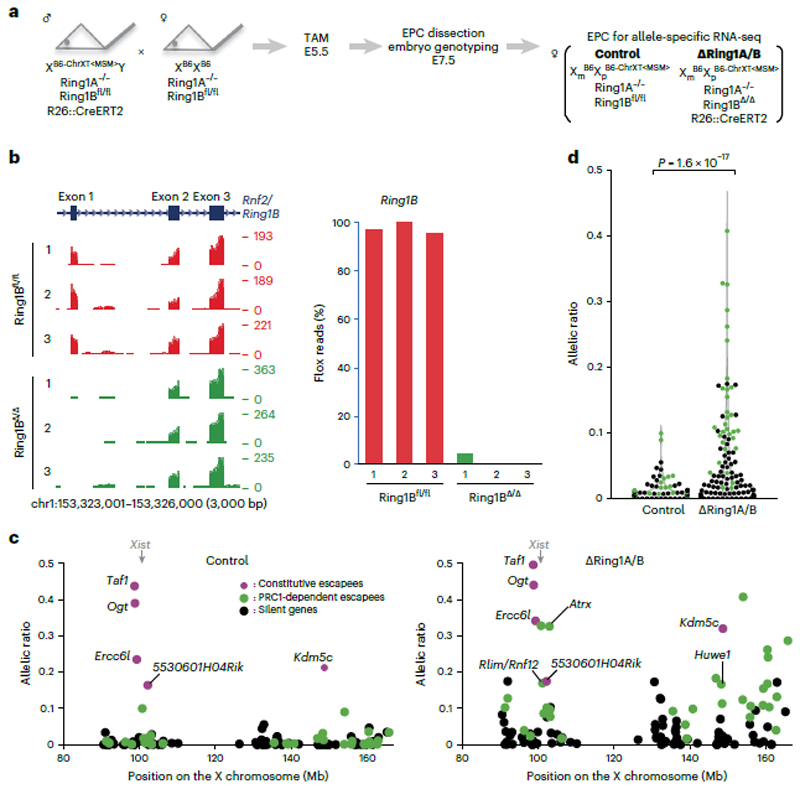
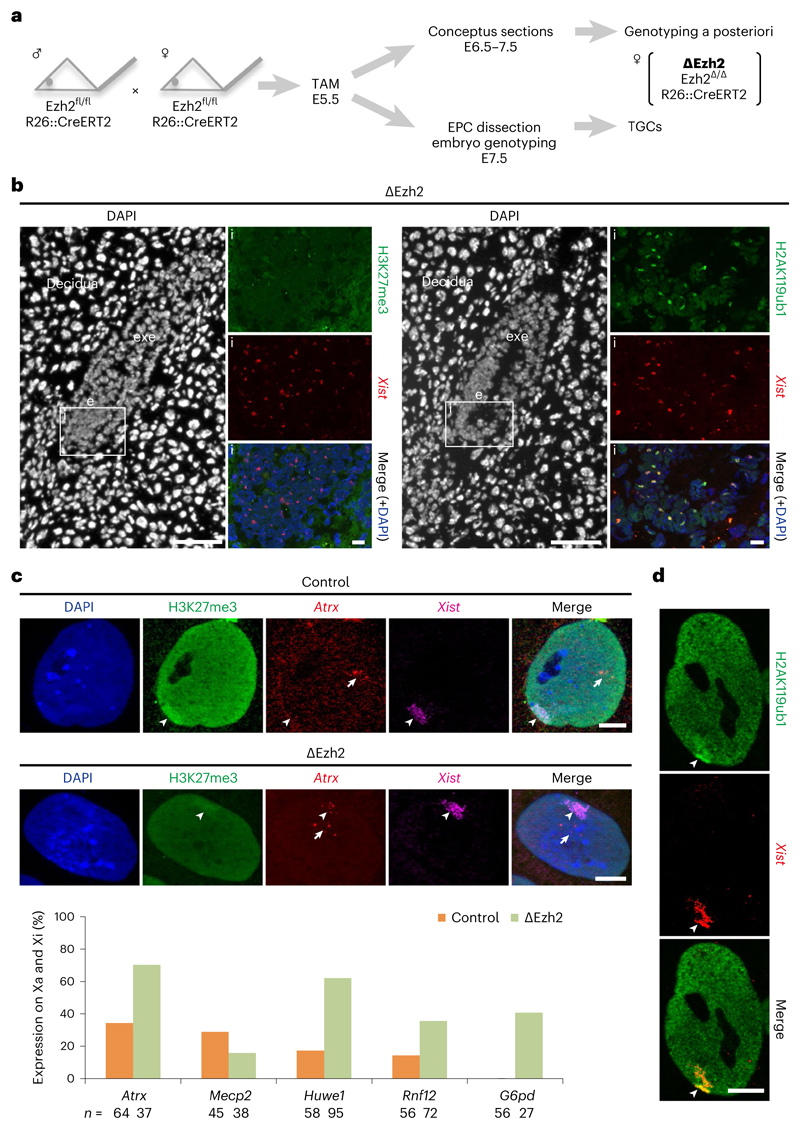
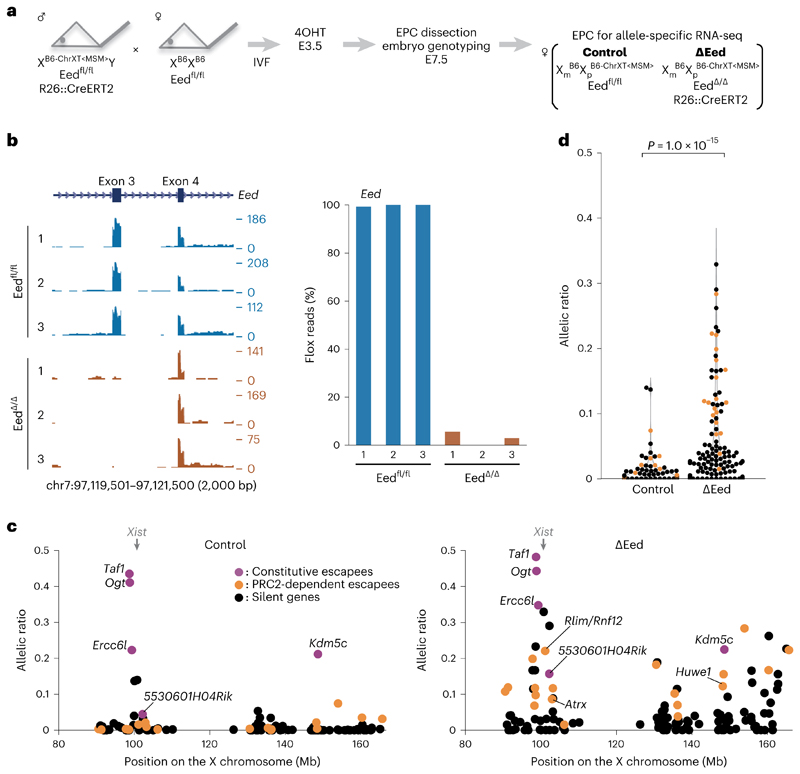
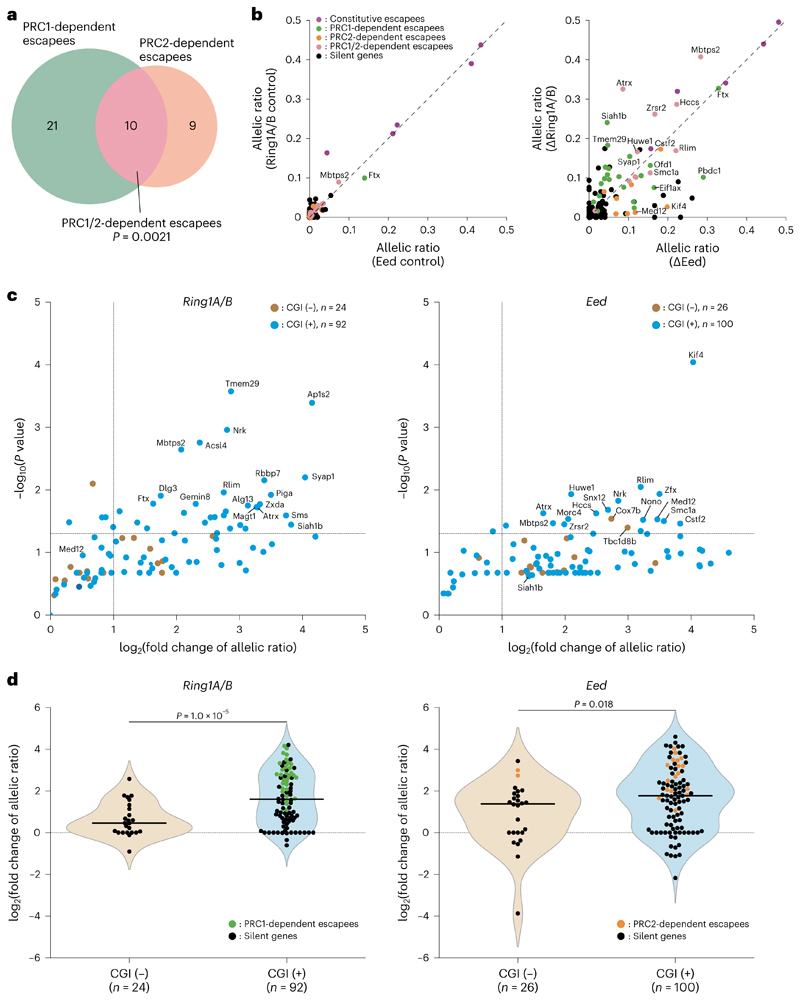
In female mammals, one of the two X chromosomes becomes inactivated during development by X-chromosome inactivation (XCI). Although Polycomb repressive complex (PRC) 1 and PRC2 have both been implicated in gene silencing, their exact roles in XCI during in vivo development have remained elusive. To this end, we have studied mouse embryos lacking either PRC1 or PRC2. Here we demonstrate that the loss of either PRC has a substantial impact on maintenance of gene silencing on the inactive X chromosome (Xi) in extra-embryonic tissues, with overlapping yet different genes affected, indicating potentially independent roles of the two complexes. Importantly, a lack of PRC1 does not affect PRC2/H3K27me3 accumulation and a lack of PRC2 does not impact PRC1/H2AK119ub1 accumulation on the Xi. Thus PRC1 and PRC2 contribute independently to the maintenance of XCI in early post-implantation extra-embryonic lineages, revealing that both Polycomb complexes can be directly involved and differently deployed in XCI.


Conflict of interest statement

Competing interests

The authors declare no competing interests

Figures

Extended Data Fig. 1
Extended Data Fig. 1. Replicates of E7.5 ΔRing1A/B female embryos.
a Features of all fifteen E7.5 ΔRing1A/B female embryos. Morphologies of embryos: N: normal, ABN: abnormal E7.5 morphology or (*) small E6.5-like morphology. H2AK119ub1 accumulation status on the Xi for embryonic and/or extraembryonic lineages. H3K27me3 accumulation status on the Xi for all lineages: embryonic and extraembryonic. 15 out of 27 female embryos were ΔRing1A/B among 68 embryos analysed. b, Quantification of H2AK119ub1 and H3K27me3 Xi focus expression in nuclei from sections in Fig. 1b (upper part). Both embryo (e) and ectoplacental cone (epc) nuclei from ΔRing1A/B E7.5 (OR1-1) embryos are analysed as positive (strong* or weak* expression as an Xi focus) or negative. Percentage and number of cells analysed are given for both histone marks. c, Quantification of H3K27me3 Xi accumulation in nuclei from sections in Fig. 1b (lower part). Results are given for control and ΔRing1A/B E7.5 female embryo (OR3-2). All nuclei are analysed as positive (strong* or weak* expression as an Xi focus) or negative. Percentage and number of cells analysed are given. d, Another example of ΔRing1A/B E7.5 female embryo (OR1–9) showing lack of H2AK119ub1 and presence of H3K27me3 on the Xi on sections. Upper part: General view of the embryo with DAPI staining is shown on the left. i: higher magnification of embryonic region (e) analyzed by immuno-RNA FISH for H2AK119ub1 and Xist. Quantification of H2AK119ub1 Xi accumulation in nuclei from the represented section. Lower part: Consecutive section. General view of the whole embryo with DAPI staining is shown on the left. i: higher magnification of embryonic region (e) immunostained for H3K27me3. Note; because the DAPI image of this cryosection was accidently lost, a consecutive section was DAPI stained and displayed here. Quantification of H3K27me3 Xi foci expression in nuclei from the represented section. All nuclei are analysed as positive (strong* or weak* expression as an Xi focus) or negative. Percentage and number of cells analysed are given for both histone marks. Scale bars: 100 μm for the whole embryo and 10 μm for the enlarged images indicated with white rectangles.
Extended Data Fig. 2
Extended Data Fig. 2. ΔRing1A/B E8.5 embryos are deprived of H2AK119ub1, but not H3K27me3 on the Xi in extraembryonic tissues.
a Female specific lethality upon deletion of Ring1A/B at E8.5. E8.5 control and ΔRing1A/B male and female embryos were analysed. Percentage and number are given. A significantly lower than expected number of ΔRing1A/B female embryos at E8.5 (13.5% instead of 25%, P = 0.033) and an increased number of empty deciduae (15.4%), suggesting female ΔRing1A/B embryo lethality at this stage. *empty decidua that is, dead embryo. Under the assumption that all genotypes are observed in 25% of the cases, one-sided binomial distribution was used to calculate p-values less than the expected number of embryos. b, H2AK119ub1/H3K27me3 accumulation status on the Xi analysed on sections for three E8.5 ΔRing1A/B female embryos. Percentage of H3K27me3-positive cells on the Xi is given. c, ΔRing1A/B E8.5 embryos are deprived of H2AK119ub1, but not H3K27me3 on the Xi in extraembryonic lineages, for example epc. Analyses on longitudinal sections; boxed regions (e and epc) are shown with higher magnification. Upper part: control embryo studied by immuno-RNA FISH for two histone marks, H2AK119ub1 (left), H3K27me3 (right) and Xist; consecutive sections. Lower part: ΔRing1A/B female embryo (RAB8–57). Quantifications of H2AK119ub1 and H3K27me3 Xi accumulation in nuclei from these sections are shown below. All nuclei are analysed as positive (strong* or weak* expression as an Xi focus) or negative. Percentage and numbers of cells analyzed are given. e: embryo proper, epc: ectoplacental cone. Scale bars: 100 μm for the whole embryos and 10 μm for the enlarged images.
Extended Data Fig. 3
Extended Data Fig. 3. Replicates of E7.5 ΔRing1A/B female embryos analyzed by RNA FISH.
a Quantification of Atrx and Huwe1 biallelic expression on both Xa and Xi in embryonic and extraembryonic lineages in three ΔRing1A/B E7.5 embryos totally deprived of H2AK119ub1 accumulation on the Xi: Δ1, Δ2 and Δ3 (OR1–7, OR1–8 and OR8–15, respectively) and in one control (OR2–17). Percentage and numbers of cells analyzed for each lineage including TGCs. *Not significant due to low number of analyzed cells. b, Another example of ΔRing1A/B female embryo (Δ1, OR1–7) showing escape of Atrx in extraembryonic tissues. Three different regions are shown. 1 (ve and e), i: higher magnification showing a cell from the embryo proper in which Atrx is monoallelically expressed from the Xa. 2 (exe, ve and TGC), i: higher magnification of a TGC in which Atrx is biallelically expressed on both Xa and Xi; 3 (epc), i: higher magnification showing a cell from epc in which Atrx is biallelically expressed on both Xa and Xi. Arrowheads: Xist-coated Xi. Arrows: Xa. Scale bars: 100 μm for DAPI staining of the whole embryos and 10 μm for the enlarged images indicated with white rectangles. e; embryo proper, epc; ectoplacental cone, ve; visceral endoderm, exe; extraembryonic ectoderm, TGC; trophoblast giant cell. Three independent embryos (Δ1: OR1–7, Δ2: OR1–8 and Δ3: OR8–15) were examined and all showed similar results. Δ2 (OR1–8) is shown in Fig. 2a. c, H2AK119ub1 level on the Xi in extraembryonic lineages correlates with the degree of derepression on the Xi. Quantification of Atrx and Huwe1 biallelic expression on both Xa and Xi in embryonic and extraembryonic lineages in two ΔRing1A/B E7.5 embryos which partially lost H2AK119ub1 accumulation on the Xi in extraembryonic lineages: Δ4 and Δ5 (OR1–4 and OR1–9 respectively; see Extended Data Fig. 1a). Percentage and numbers of cells analyzed for each lineage including TGCs.
Extended Data Fig. 4
Extended Data Fig. 4. Morphology of ΔRing1A/B TGCs derived from E7.5 ectoplacental cone and quantification of H3K27me3 and H2AK119ub1 Xi accumulation.
a Female-specific lethality of TGCs upon Ring1A/B (PRC1) deletion. Morphology of EPC outgrowths, containing TGCs were recorded from days 1 to 4 of culture. Each TGC culture was categorized into three categories, Growing (G), Arrested (A), and Dying (D), based on their morphologies. Representative pictures are shown on the left. Scale bar: 100 μm. Summary chart is shown on the right. ΔRing1A/B female EPC outgrowth showed more severe phenotypes such as Arrested (A) and Dying (D) than male mutants and controls. b, Quantification of H3K27me3 Xi accumulation in control and ΔRing1A/B TGCs illustrated in Fig. 2d. c, Quantification of H3K27me3 and H2AK119ub1 Xi accumulation in nuclei from sections in Fig. 4b. d, Quantification of H2AK119ub1 Xi accumulation in ΔEzh2 TGCs as illustrated in Fig. 4d. b–d, All nuclei are analysed as positive (strong* or weak* expression as an Xi focus) or negative. Percentage and numbers of cells analyzed are given.
Extended Data Fig. 5
Extended Data Fig. 5. Details of allele-specific RNA-seq.
(Right) Schematic of B6-ChrXTMSM chromosome used in this study. Telomeric half of the B6 X chromosome is replaced with MSM/Ms X chromosome. (Left) Allele-specific expression ratio in 3 independent EPCs of Ring1A/B control, ΔRing1A/B, Eed control and ΔEed E7.5 embryos are represented as heat maps. Maternal expression in red and paternal expression in blue. Total 136 informative genes (122 for Ring1A/B and 132 for Eed) including 5 constitutive escapees (magenta), Xist (Blue), significant escapees upon PRC1 deletion (green), significant escapees upon PRC2 deletion (orange), not informative genes (gray) and silenced genes even in the absence of PRC1 or PRC2 (black) are shown. Values are allele-specific expression ratios in each EPC.
Extended Data Fig. 6
Extended Data Fig. 6. A model for the role of Polycomb complexes in the maintenance of XCI.
(Left) X-linked genes in embryonic and extraembryonic lineages on the Xi are silenced by XCI. CGIs on the Xi are heavily methylated in embryonic lineages, but maintained as hypo-methylated in extraembryonic lineages. (Middle) Ring1A/B knockout resulted in a depletion of all PRC1 subcomplexes on the Xi, but PRC2 is still retained on the Xi, at least in extraembryonic lineages. In this situation, PRC2 accumulation on the Xi is retained at E7.5 but lost at E8.5 in embryonic lineages (here E7.5 is shown). (Right) Ezh2 or Eed knockout resulted in a depletion of PRC2 on the Xi, but PRC1 is still retained on the Xi, in extraembryonic lineages. (Middle and Right) In these situations, many of X-linked genes undergo robust reactivation from the Xi only in extraembryonic lineages. In embryonic lineages, however, X-linked genes are still silenced in the absence of PRC1 or PRC2. DNA methylation of CGIs and/or some other factor(s) might compensate a lack of PRC1 or PRC2 to secure a tight silencing of X-linked genes on the Xi in embryonic lineages.
Fig. 1
Fig. 1. Deletion of Ring1A/B (PRC1) does not impact H3K27me3 accumulation on the Xi in E7.5 embryos.
a, Schematic representation of ΔRing1A/B mouse deletion strategy. Tamoxifen (TAM) was injected intraperitoneally to pregnant mother at E5.5 for both control (without R26::CreERT2) and ΔRing1A/B (bearing R26::CreERT2). Embryos were recovered at E7.5 for the experiments. For more details, see Methods. b, ΔRing1A/B E7.5 embryos are deprived of H2AK119ub1, but not H3K27me3 on the Xi. Analyses on longitudinal cryosections; boxed regions are shown with higher magnification. Top: ΔRing1A/B E7.5 (OR1-1) embryo studied by IF for two histone marks, H2AK119ub1 (left) and H3K27me3 (right); consecutive sections; lack of H2AK119ub1 accumulation on the Xi and H3K27me3 accumulation on the Xi in most cells. For quantification, see Extended Data Fig. 1b. Four independent embryos were examined, and all showed similar results. Bottom: immuno-RNA FISH (H3K27me3 and Xist) for control (left) and another ΔRing1A/B (OR3-2) E7.5 embryos (right); similar accumulation of H3K27me3 on the Xi. For quantification, see Extended Data Fig. 1c. Eight independent embryos were examined, and all showed similar results. epc, ectoplacental cone; e, embryo proper. Scale bars: 100 μm (whole embryos) and 10 μm (enlarged images). c, Morphology of E7.5 and E8.5 control and ΔRing1A/B male and female embryos. Left: E7.5 embryos on sections; N, normal; ABN, abnormal. Scale bar, 500 μm. Sum of six independent litters. Right: E8.5 embryos in the yolk sac; N, normal; S, small; D, dying. Scale bar, 500 μm. Sum of nine independent litters. P values were calculated using one-sided binomial test.
Fig. 2
Fig. 2. Deletion of Ring1A/B (PRC1) results in loss of gene silencing on the Xi in extra-embryonic lineages.
a, X-linked gene expression on the Xi in extraembryonic tissues upon Ring1A/B deletion. Consecutive sections of ΔRing1A/B E7.5 embryo (Δ2) showing transcripts of two X-linked genes (Atrx and Huwe1) and Xist by RNA FISH. Top: Atrx and Xist. (i) Boxed area showing embryo proper (e), visceral endoderm (ve) and TGC. TGC has endoreplicated genome DNA and shows multi-spot RNA FISH signal (here, Atrx). (ii) Boxed region in i showing a TGC with biallelic Atrx expression (Xa and Xi). Middle: Huwe1 and Xist. (i) Boxed area showing ectoplacental cone (epc). (ii) Boxed region in i showing a cell with biallelic Huwe1 expression (Xa and Xi). Three independent embryos (Δ1: OR1–7, Δ2: OR1–8 and Δ3: OR8–15) were examined, and all showed similar results. Δ1 is shown in Extended Data Fig. 3b. Bottom: quantification of Atrx and Huwe1 biallelic expression (Xa and Xi) in three ΔRing1A/B E7.5 embryos totally deprived of H2AK119ub1 on the Xi (Δ1, Δ2 and Δ3). Mean (percentage of nuclei) ± standard deviation (s.d.) from three independent embryos. P values were calculated using two-sided t-test. For the number of analysed cells, see Extended Data Fig. 3a. Scale bars: 100 μm (whole embryos) and 10 μm (enlarged images). Arrowheads: Xist-coated Xi. Arrows: Xa. ExE: extra-embryonic ectoderm. Ch: chorion. b, Schematic of the experiment to generate TGCs. Embryos were recovered at E7.5 after intraperitoneal tamoxifen (TAM) injection to pregnant mother at E5.5. EPC was isolated and cultivated for 3 or 4 days to derive TGCs (Methods). c, Deletion of Ring1A/B induces escape of X-linked genes in TGCs. Percentage of cells showing biallelic expression (Xa and Xi) of five X-linked genes in control and ΔRing1A/B TGCs. Mean (percentage of nuclei) ± s.d.; n indicates number of TGCs from three experiments. The expected ratio and variance of biallelic expression in the control and knockout were calculated assuming a binomial distribution, and the differences between them were evaluated by two-sided binomial test. d, Immuno-RNA FISH showing lack of H2AK119ub1 but accumulation of H3K27me3 on the Xi in ΔRing1A/B TGC. Arrowheads: Xist-coated Xi. Scale bar, 10 μm. For quantification, see Extended Data Fig. 4b.
Fig. 3
Fig. 3. Deletion of Ring1A/B (PRC1) results in loss of chromosome-wide gene silencing on the Xi in EPC.
a Schematic of allele-specific RNA-seq using ΔRing1A/B conditional knockout mouse. Embryos were recovered at E7.5 after intraperitoneal tamoxifen (TAM) injection to pregnant mother at E5.5. EPC, which retains imprinted XCI where B6-ChrXTMSM is dominantly silenced, was isolated and applied for RNA-seq library preparation. b, Genome browser plots showing allele-specific RNA-seq reads of three controls and three ΔRing1A/B EPCs at Ring1B locus. The first coding exon including ATG start codon is deleted upon CreERT2 activation. c, Allele-specific RNA-seq shows chromosome-wide gene escape from XCI upon PRC1 deletion. A total of 122 informative genes including Xist and 5 constitutive escapees (magenta), 32 significant escapees upon PRC1 deletion (green) and 84 silenced genes even in the absence of PRC1 (black) are shown in both control and ΔRing1A/B EPCs. Average of three independent EPCs. P values were calculated using one-sided Student’s t-test and are presented in Supplementary Table 2. d, Total change of allelic ratio upon PRC1 deletion. Allelic ratios of each X-linked gene in control and ΔRing1A/B E7.5 EPCs. A total of 116 informative genes including 32 significant escapees upon PRC1 deletion (green) and 84 silenced genes even in the absence of PRC1 (black) are shown in both control and ΔRing1A/B EPCs. Average of three independent EPCs. P values were calculated using one-sided Brunner–Munzel test.
Fig. 4
Fig. 4. Deletion of Ezh2 (PRC2) results in loss of gene silencing on the Xi in TGCs without affecting H2AK119ub1 accumulation.
a Schematic representation of ΔEzh2 experiments. Tamoxifen (TAM) was injected same as ΔRing1A/B experiments (Fig. 1a). Embryos were recovered at E6.5 or E7.5 and used for either cryosectioning or TGC derivation. For more details, see Methods. b, ΔEzh2 E6.5 embryos are deprived of H3K27me3, but not H2AK119ub1 on the Xi. Immuno-RNA FISH for two histone marks, H3K27me3 (left) or H2AK119ub1 (right), and Xist; consecutive sections; (i) boxed area showing the embryo proper (e); lack of H3K27me3 but accumulation of H2AK119ub1 shown here for the embryo proper. exe, extra-embryonic ectoderm. Scale bars: 100 μm (whole embryos) and 10 μm (enlarged images). For quantification, see Extended Data Fig. 4c. Two independent embryos for both control and ΔEzh2 were examined, and all showed similar results. c, Deletion of Ezh2 leads to aberrant expression of X-linked genes from the Xi in TGCs. Upper part shows immuno-RNA FISH for H3K27me3, Xist and an X-linked gene Atrx. Top: example of control TGC showing H3K27me3 accumulation on the Xi and monoallelic expression of Atrx on the Xa. Bottom: example of ΔEzh2 TGC showing strong decrease of H3K27me3 accumulation on the Xi and biallelic expression of Atrx on both Xa and Xi. Arrowheads: Xist-coated Xi. Arrows: Xa. Scale bar, 10 μm. Lower part shows percentage of cells showing biallelic expression of five X-linked genes on both Xa and Xi in ΔEzh2 and control TGCs (from WT B6D2F1). n indicates number of TGCs from two experiments. d, Deletion of Ezh2 does not impact H2AK119ub1 accumulation on the Xi in TGCs. Immuno-RNA FISH showing accumulation of H2AK119ub1 on the Xi in ΔEzh2 TGC. Arrowheads: Xist-coated Xi. Scale bar, 10 μm. For quantification, see Extended Data Fig. 4d. Thirty control TGCs derived from a single control embryo and 30 ΔEzh2 TGCs derived from a single ΔEzh2 embryo were analysed.
Fig. 5
Fig. 5. Deletion of Eed (PRC2) results in loss of chromosome-wide gene silencing on the Xi in EPC.
a Schematic of allele-specific RNA-seq using ÄEed conditional knockout mouse. Embryos were recovered at E7.5 after 4-hydroxytamoxifen (4OHT) treatment of blastocysts obtained from in vitro fertilization (IVF) at E3.5 (Methods). EPC was isolated and applied for RNA-seq library preparation. b, Genome browser plots showing allele-specific RNA-seq reads of three controls and three ÄEed EPCs at Eed locus. The third coding exon is deleted upon CreERT2 activation. c, Allele-specific RNA-seq shows chromosomewide gene escape from XCI upon PRC2 deletion. A total of 132 informative genes including Xist and 5 constitutive escapees (magenta), 19 significant escapees upon PRC2 deletion (orange) and 107 silenced genes even in the absence of PRC2 (black) are shown in both control and ÄEed EPCs. Average of three independent EPCs. P values were calculated using one-sided Student’s t-test, and each P value is shown in Supplementary Table 3. d, Total change of allelic ratio upon PRC2 deletion. Allelic ratios of each X-linked gene in control and ÄEed E7.5 EPCs. A total of 126 informative genes including 19 significant escapees upon PRC2 deletion (orange) and 107 silenced genes even in the absence of PRC2 (black) are shown in both control and ÄEed EPCs. P values were calculated using one-sided Brunner–Munzel test.
Fig. 6
Fig. 6. PRC1-dependent escapees are enriched with CGI at the promoter.
a, A Venn diagram showing the degree of overlap between PRC1-dependent escapees (N = 31) and PRC2-dependent escapees (N = 19) in 112 commonly informative X-linked genes. Average of three independent EPCs. Ap1s2 was omitted from the analysis as it was not informative in the Eed dataset. Detailed information is indicated in Supplementary Table 4. P value was calculated using chi-square test. b, Correlation of PRC1- and PRC2-dependent escapees. Allelic ratio of each informative X-linked gene was plotted. A total of 117 informative genes including 5 constitutive escapees (magenta), 21 PRC1-dependent escapees (green), 9 PRC2-dependent escapees (orange), 10 PRC1/2-dependent escapees (pink) and 72 silenced genes (black) are shown in both Ring1A/B and Eed control EPCs (left) and ΔRing1A/B and ΔEed EPCs (right). Average of three independent EPCs. Detailed information is indicated in Supplementary Tables 1 and 4. c, PRC1-dependent escapees are significantly enriched with promoter-associated CGI. Left: distribution of 32 PRC1-dependent escapees and 84 silent genes. All 32 PRC1-dependent escapees have CGI at their promoter (P = 6.9 × 10⁻⁴, chi-square test). For processed data, see Supplementary Table 2. Right: distribution of 19 PRC2-dependent escapees and 107 silent genes. Seventeen out of 19 PRC2-dependent escapees have CGI at their promoter (P = 0.24, chi-square test). For processed data, see Supplementary Table 3. P values for each gene were calculated using one-sided Student’s t-test and converted to −log10 values (see also Supplementary Tables 2 and 3). d, Correlation of promoter-associated CGI and degree of escape. Left: a total of 116 informative genes analysed in ΔRing1A/B mutant EPCs including 32 PRC1-dependent escapees (green circles) and 84 silent genes (black circles). For processed data, see Supplementary Table 2. Right: a total of 126 informative genes analysed in ΔEed mutant EPCs including 19 PRC2-dependent escapees (orange circles) and 107 silent genes (black circles). For processed data, see Supplementary Table 3. P values were calculated using two-sided Brunner–Munzel test. In c and d, each dot represents an average of three independent experiments. To all allelic ratio values, 1% dispersion (0.01) was added to calculate the fold change of allelic ratio (Methods). CGI (−) and CGI (+): genes without and with CGI at promoter (±2 kb from transcription start site), respectively.

References

    1. Lyon MF. Gene action in the X-chromosome of the mouse (Mus musculus L.) Nature. 1961;190:372–373. - PubMed
    1. Żylicz JJ, Heard E. Molecular mechanisms of facultative heterochromatin formation: an X-chromosome perspective. Annu Rev Biochem. 2020;89:255–282. - PubMed
    1. Brockdorff N, et al. The product of the mouse Xist gene is a 15 kb inactive X-specific transcript containing no conserved ORF and located in the nucleus. Cell. 1992;71:515–526. - PubMed
    1. Brown CJ, et al. The human XIST gene: analysis of a 17 kb inactive X-specific RNA that contains conserved repeats and is highly localized within the nucleus. Cell. 1992;71:527–542. - PubMed
    1. Ku M, et al. Genomewide analysis of PRC1 and PRC2 occupancy identifies two classes of bivalent domains. PLoS Genet. 2008;4:e1000242. doi: 10.1371/journal.pgen.1000242. - DOI - PMC - PubMed

Publication types

MeSH terms

Substances