. 2023 Jan 12;21(1):20.
doi: 10.1186/s12967-023-03872-7.

A machine learning framework develops a DNA replication stress model for predicting clinical outcomes and therapeutic vulnerability in primary prostate cancer

Affiliations

A machine learning framework develops a DNA replication stress model for predicting clinical outcomes and therapeutic vulnerability in primary prostate cancer

Rong-Hua Huang et al. J Transl Med. .

Abstract

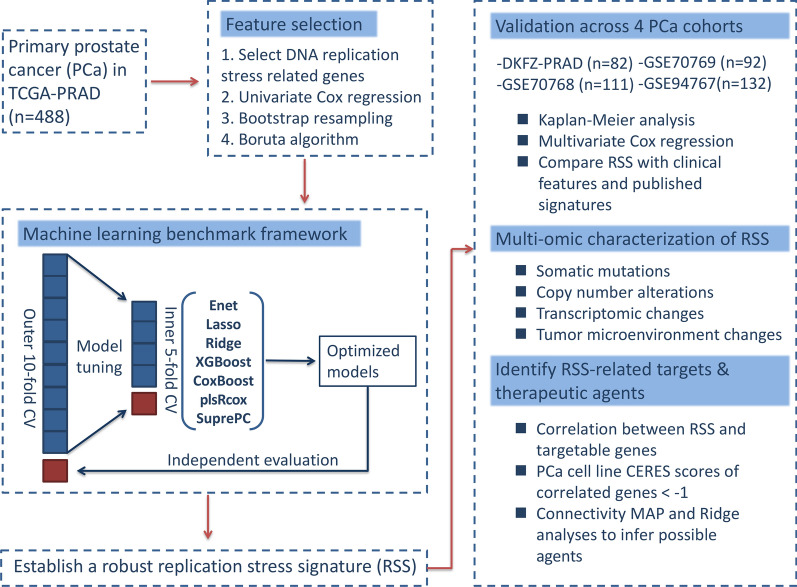
Recent studies have identified DNA replication stress as an important feature of advanced prostate cancer (PCa). The identification of biomarkers for DNA replication stress could therefore facilitate risk stratification and help inform treatment options for PCa. Here, we designed a robust machine learning-based framework to comprehensively explore the impact of DNA replication stress on prognosis and treatment in 5 PCa bulk transcriptomic cohorts with a total of 905 patients. Bootstrap resampling-based univariate Cox regression and Boruta algorithm were applied to select a subset of DNA replication stress genes that were more clinically relevant. Next, we benchmarked 7 survival-related machine-learning algorithms for PCa recurrence using nested cross-validation. Multi-omic and drug sensitivity data were also utilized to characterize PCa with various DNA replication stress. We found that the hyperparameter-tuned eXtreme Gradient Boosting model outperformed other tuned models and was therefore used to establish a robust replication stress signature (RSS). RSS demonstrated superior performance over most clinical features and other PCa signatures in predicting PCa recurrence across cohorts. Lower RSS was characterized by enriched metabolism pathways, high androgen activity, and a favorable prognosis. In contrast, higher RSS was significantly associated with TP53, RB1, and PTEN deletion, exhibited increased proliferation and DNA replication stress, and was more immune-suppressive with a higher chance of immunotherapy response. In silico screening identified 13 potential targets (e.g. TOP2A, CDK9, and RRM2) from 2249 druggable targets, and 2 therapeutic agents (irinotecan and topotecan) for RSS-high patients. Additionally, RSS-high patients were more responsive to taxane-based chemotherapy and Poly (ADP-ribose) polymerase inhibitors, whereas RSS-low patients were more sensitive to androgen deprivation therapy. In conclusion, a robust machine-learning framework was used to reveal the great potential of RSS for personalized risk stratification and therapeutic implications in PCa.

Keywords: DNA replication stress; Machine learning; Precision oncology; Prostate cancer.


Conflict of interest statement

The authors declare no competing interests.

Figures

Fig. 1
Fig. 1
The workflow of the present study. (1) Feature selection and machine-learning benchmark were performed in the TCGA-PRAD dataset. (2) A replication stress signature was established and externally validated in 4 independent cohorts. (3) Potential therapeutic targets and drugs were identified through in silico screening
Fig. 2
Fig. 2
A robust replication stress signature (RSS) was developed by machine learning benchmark. A The Boruta algorithm identified 47 replication stress-related genes that were associated with PCa recurrence. Yellow represents confirmed features while other colors denote shadow attributes. The corresponding boxplots compared the concordance index (C-index) values (B) and integrated brier score (IBS) (C) of 7 survival-related machine learning algorithms using nest cross-validation. The individual dots correspond to the results of each independent validation. D Comparison of time-dependent area under the receiver operating characteristic curve (AUC) values at 1-, 3-, 5-, and 10-year among the machine learning algorithms. Dots indicate the average AUC values. E Bar plot of feature importance. Contributions of included genes for prostate cancer recurrence to the XGBoost model in the TCGA-PRAD cohort
Fig. 3
Fig. 3
Evaluation of the DNA replication stress signature (RSS) in multiple cohorts. Time-dependent area under the receiver operating characteristic curve (AUC) at 1-, 3-, and 5-year in the A TCGA-PRAD, B DKFZ-PRAD, C GSE70768, D GSE70769, E GSE94767 datasets. F Forest plots demonstrate the hazard ratio (HR), 95% confidence interval (CI), and the corresponding P values of both univariate Cox regression analysis (shown in the pink shading area) and multivariate Cox regression analysis (shown in the blue shading area) in 5 prostate cancer cohorts. Kaplan–Meier plots of the G TCGA-PRAD, H DKFZ-PRAD, I GSE70768, J GSE70769, K GSE94767 datasets. High- and low-risk groups are determined by the universal cutoff of 0.536. P values are derived from log-rank test. PSA stands for prostate-specific antigen; pT refers to the pathological T stage; pN refers to the pathological N stage; RSS represents replication stress signature
Fig. 4
Fig. 4
The predictive performance of replication stress signature (RSS) was compared with that of clinical features and prognostic signatures. Comparison of C-index between RSS and clinical features in the A TCGA-PRAD, B DKFZ-PRAD, C GSE70768, D GSE70769, E GSE94767 datasets. Data are presented as mean ± 95% confidence interval. F Univariate Cox regression analysis of prognostic signatures in 5 prostate cancer cohorts. Dots represent log2(hazard ratio). The upper and lower bounds of the bars indicate log2(95% confidence interval). G Comparison of C-index between RSS and other prognostic signatures across cohorts. Dots represent the mean C-index while the upper and lower bounds of the bars indicate a 95% confidence interval. Comparison of Time-dependent area under the receiver operating characteristic curve (AUC) among prognostic signatures at H 1-, I 3-, and J 5-years in the TCGA-PRAD dataset. The asterisks are used to denote the statistical P value (*P < 0.05; **P < 0.01; ***P < 0.001, ****P < 0.0001)
Fig. 5
Fig. 5
Multi-omic characterization of RSS-high and RSS-low patients. Recurrent copy number A amplification and B deletion regions detected in the RSS-high group. Recurrent copy number C amplification and D deletion regions detected in the RSS-low group. E The oncoprint of genes affected by recurrent copy number alterations. The bar plot on the right side of the oncoprint indicates the corresponding proportion of alterations in each group. F The oncoprint of common somatic gene mutations. The bar plot on the right side of the oncoprint indicates the corresponding proportion of somatic mutations in each group. The distribution of G aneuploidy score, H tumor mutation burden, and I tumor neoantigen burden between RSS-high and RSS-low patients in the TCGA-PRAD dataset. The upper and lower bounds of the boxes represented 75th and 25th percentiles while the center lines in the boxes indicate the median values. The asterisks denote the statistical P value (*P < 0.05; **P < 0.01; ***P < 0.001, ****P < 0.0001)
Fig. 6
Fig. 6
The associations of clinicopathologic and biological features with the replication stress signature. The upper panel of the heatmap showed the distribution of clinical characteristics between RSS-high and RSS-low patients. The lower panel demonstrated z-scores of single sample gene set enrichment analysis. The different colors of right-sided text annotation indicate the relative enrichment of pathways in the corresponding groups. The annotations on the left side indicate statistical P values
Fig. 7
Fig. 7
The association between replication stress signature and immune cell infiltrations in the Meta-cohort. A The result of CIBERSOR analysis. B The scatterplot between RSS and CD8 + T cells. C The scatterplot between RSS and regulatory T cells. D The scatterplot between RSS and M2 macrophages. The correlation coefficient R and corresponding P values are derived from Spearman’s rank correlation analysis. E The expression of immune-related genes in RSS-high and RSS-low patients. F The distribution of RSS between atezolizumab responders and non-responders. G The percentages of responders and non-responders in RSS-high and RSS-low groups. “R” represents responders while “NR” indicates non-responders in F and G. The upper and lower bounds of the boxes represented 75th and 25th percentiles while the center lines in the boxes indicate the median values. The asterisks represented the statistical P-value (*P < 0.05; **P < 0.01; ***P < 0.001, ****P < 0.0001)
Fig. 8
Fig. 8
Identification of potential therapeutic targets and agents for RSS-high patients. Dot plots of the correlation coefficients derived from Spearman’s rank correlation analysis between RSS and druggable mRNA expression in the A TCGA-PRAD and B DKFZ-PRAD datasets. Light-colored dots represent potential targets that pass the threshold in Spearman’s rank correlation analysis (R > 0.3 and adjusted P < 0.05), while dark-colored dots indicate targets that were also selected by CERES analysis. C The distribution of CERES scores of identified targets in prostate cancer cell lines. D The composition of chemical compounds selected by CMap analysis. Only the top 10 drug categories are displayed. The inferred AUC values of irinotecan and topotecan were compared between RSS-high and RSS-low patients in the E TCGA-PRAD and F DKFZ-PRAD datasets. The inferred AUC values of ADT, taxanes, and PARP inhibitors were compared between RSS-high and RSS-low patients in the G TCGA-PRAD and H DKFZ-PRAD datasets. The upper and lower bounds of the boxes represented 75th and 25th percentiles while the center lines in the boxes indicate the median values. The asterisks represented the statistical P-value (*P < 0.05; **P < 0.01; ***P < 0.001, ****P < 0.0001)
Fig. 9
Fig. 9
Knockdown of FEN1 and RFC5 inhibits cell growth and promotes apoptosis. Levels of FEN1 and RFC expression in C4-2B and PC-3 are decreased by siRNA knockdown as measured in the A real-time qPCR and B Western blot analysis. Comparison of cell growth among the control, FEN1, and RFC5 knockdown groups in C4-2B and PC-3 via C CCK-8 and D colony formation assays. E Measurement of cell apoptosis in control, FEN1, and RFC5 knockdown groups by flow cytometry. Cells are stained with Annexin V-fluorescein 5-isothiocyanate/PI assay. The asterisks represented the statistical P-value (*P < 0.05; **P < 0.01; ***P < 0.001, ****P < 0.0001)

Similar articles

Cited by

References

    1. Sung H, Ferlay J, Siegel RL, et al. Global cancer statistics 2020: GLOBOCAN estimates of incidence and mortality worldwide for 36 cancers in 185 countries. CA Cancer J Clin. 2021;71(3):209–249. doi: 10.3322/caac.21660. - DOI - PubMed
    1. Schaefer A, Stephan C, Busch J, et al. Diagnostic, prognostic and therapeutic implications of microRNAs in urologic tumors. Nat Rev Urol. 2010;7:286–297. doi: 10.1038/nrurol.2010.45. - DOI - PubMed
    1. Haffner MC, Zwart W, Roudier MP, et al. Genomic and phenotypic heterogeneity in prostate cancer. Nat Rev Urol. 2021;18:79–92. doi: 10.1038/s41585-020-00400-w. - DOI - PMC - PubMed
    1. Tolkach Y, Kristiansen G. The heterogeneity of prostate cancer: a practical approach. Pathobiology. 2018;85:108–116. doi: 10.1159/000477852. - DOI - PubMed
    1. Sztupinszki Z, Diossy M, Krzystanek M, et al. Detection of molecular signatures of homologous recombination deficiency in prostate cancer with or without BRCA1/2 mutations. Clin Cancer Res. 2020;26:2673–2680. doi: 10.1158/1078-0432.CCR-19-2135. - DOI - PMC - PubMed

Publication types