

Evaluation of an open forecasting challenge to assess skill of West Nile virus neuroinvasive disease prediction
- PMID: 36635782
- PMCID: PMC9834680
- DOI: 10.1186/s13071-022-05630-y
Evaluation of an open forecasting challenge to assess skill of West Nile virus neuroinvasive disease prediction
Abstract
Background: West Nile virus (WNV) is the leading cause of mosquito-borne illness in the continental USA. WNV occurrence has high spatiotemporal variation, and current approaches to targeted control of the virus are limited, making forecasting a public health priority. However, little research has been done to compare strengths and weaknesses of WNV disease forecasting approaches on the national scale. We used forecasts submitted to the 2020 WNV Forecasting Challenge, an open challenge organized by the Centers for Disease Control and Prevention, to assess the status of WNV neuroinvasive disease (WNND) prediction and identify avenues for improvement.
Methods: We performed a multi-model comparative assessment of probabilistic forecasts submitted by 15 teams for annual WNND cases in US counties for 2020 and assessed forecast accuracy, calibration, and discriminatory power. In the evaluation, we included forecasts produced by comparison models of varying complexity as benchmarks of forecast performance. We also used regression analysis to identify modeling approaches and contextual factors that were associated with forecast skill.
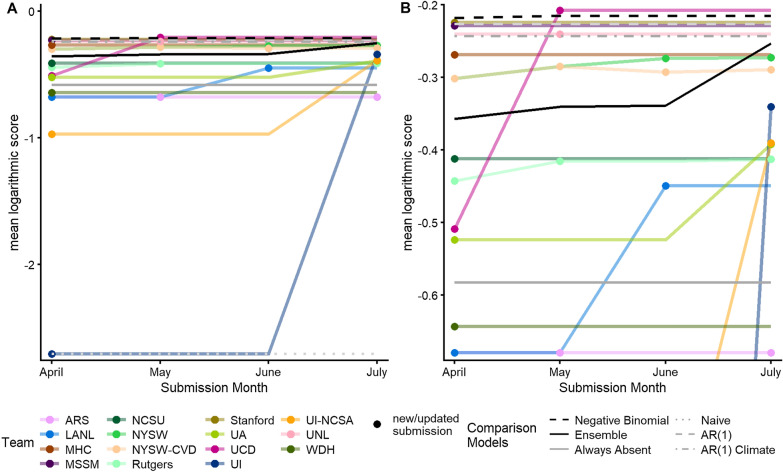
Results: Simple models based on historical WNND cases generally scored better than more complex models and combined higher discriminatory power with better calibration of uncertainty. Forecast skill improved across updated forecast submissions submitted during the 2020 season. Among models using additional data, inclusion of climate or human demographic data was associated with higher skill, while inclusion of mosquito or land use data was associated with lower skill. We also identified population size, extreme minimum winter temperature, and interannual variation in WNND cases as county-level characteristics associated with variation in forecast skill.
Conclusions: Historical WNND cases were strong predictors of future cases with minimal increase in skill achieved by models that included other factors. Although opportunities might exist to specifically improve predictions for areas with large populations and low or high winter temperatures, areas with high case-count variability are intrinsically more difficult to predict. Also, the prediction of outbreaks, which are outliers relative to typical case numbers, remains difficult. Further improvements to prediction could be obtained with improved calibration of forecast uncertainty and access to real-time data streams (e.g. current weather and preliminary human cases).
Keywords: Calibration; Discriminatory power; Forecasting; Logarithmic score; Multi-model assessment; United States; West Nile neuroinvasive disease; West Nile virus.
© 2023. This is a U.S. Government work and not under copyright protection in the US; foreign copyright protection may apply.
Conflict of interest statement
The authors declare that they have no competing interests.
Figures


References
-
- Centers of Disease Control and Prevention. Final cumulative maps and data for 1999–2020. 2021. https://www.cdc.gov/westnile/statsmaps/cumMapsData.html. Accessed July 2022.
MeSH terms
Grants and funding
LinkOut - more resources
Full Text Sources
Medical
