. 2022 Oct 4;9(5):ENEURO.0147-21.2022.
doi: 10.1523/ENEURO.0147-21.2022. Print 2022 Sep-Oct.

Measuring Nonapoptotic Caspase Activity with a Transgenic Reporter in Mice

Affiliations

Measuring Nonapoptotic Caspase Activity with a Transgenic Reporter in Mice

P J Nicholls et al. eNeuro. .

Abstract

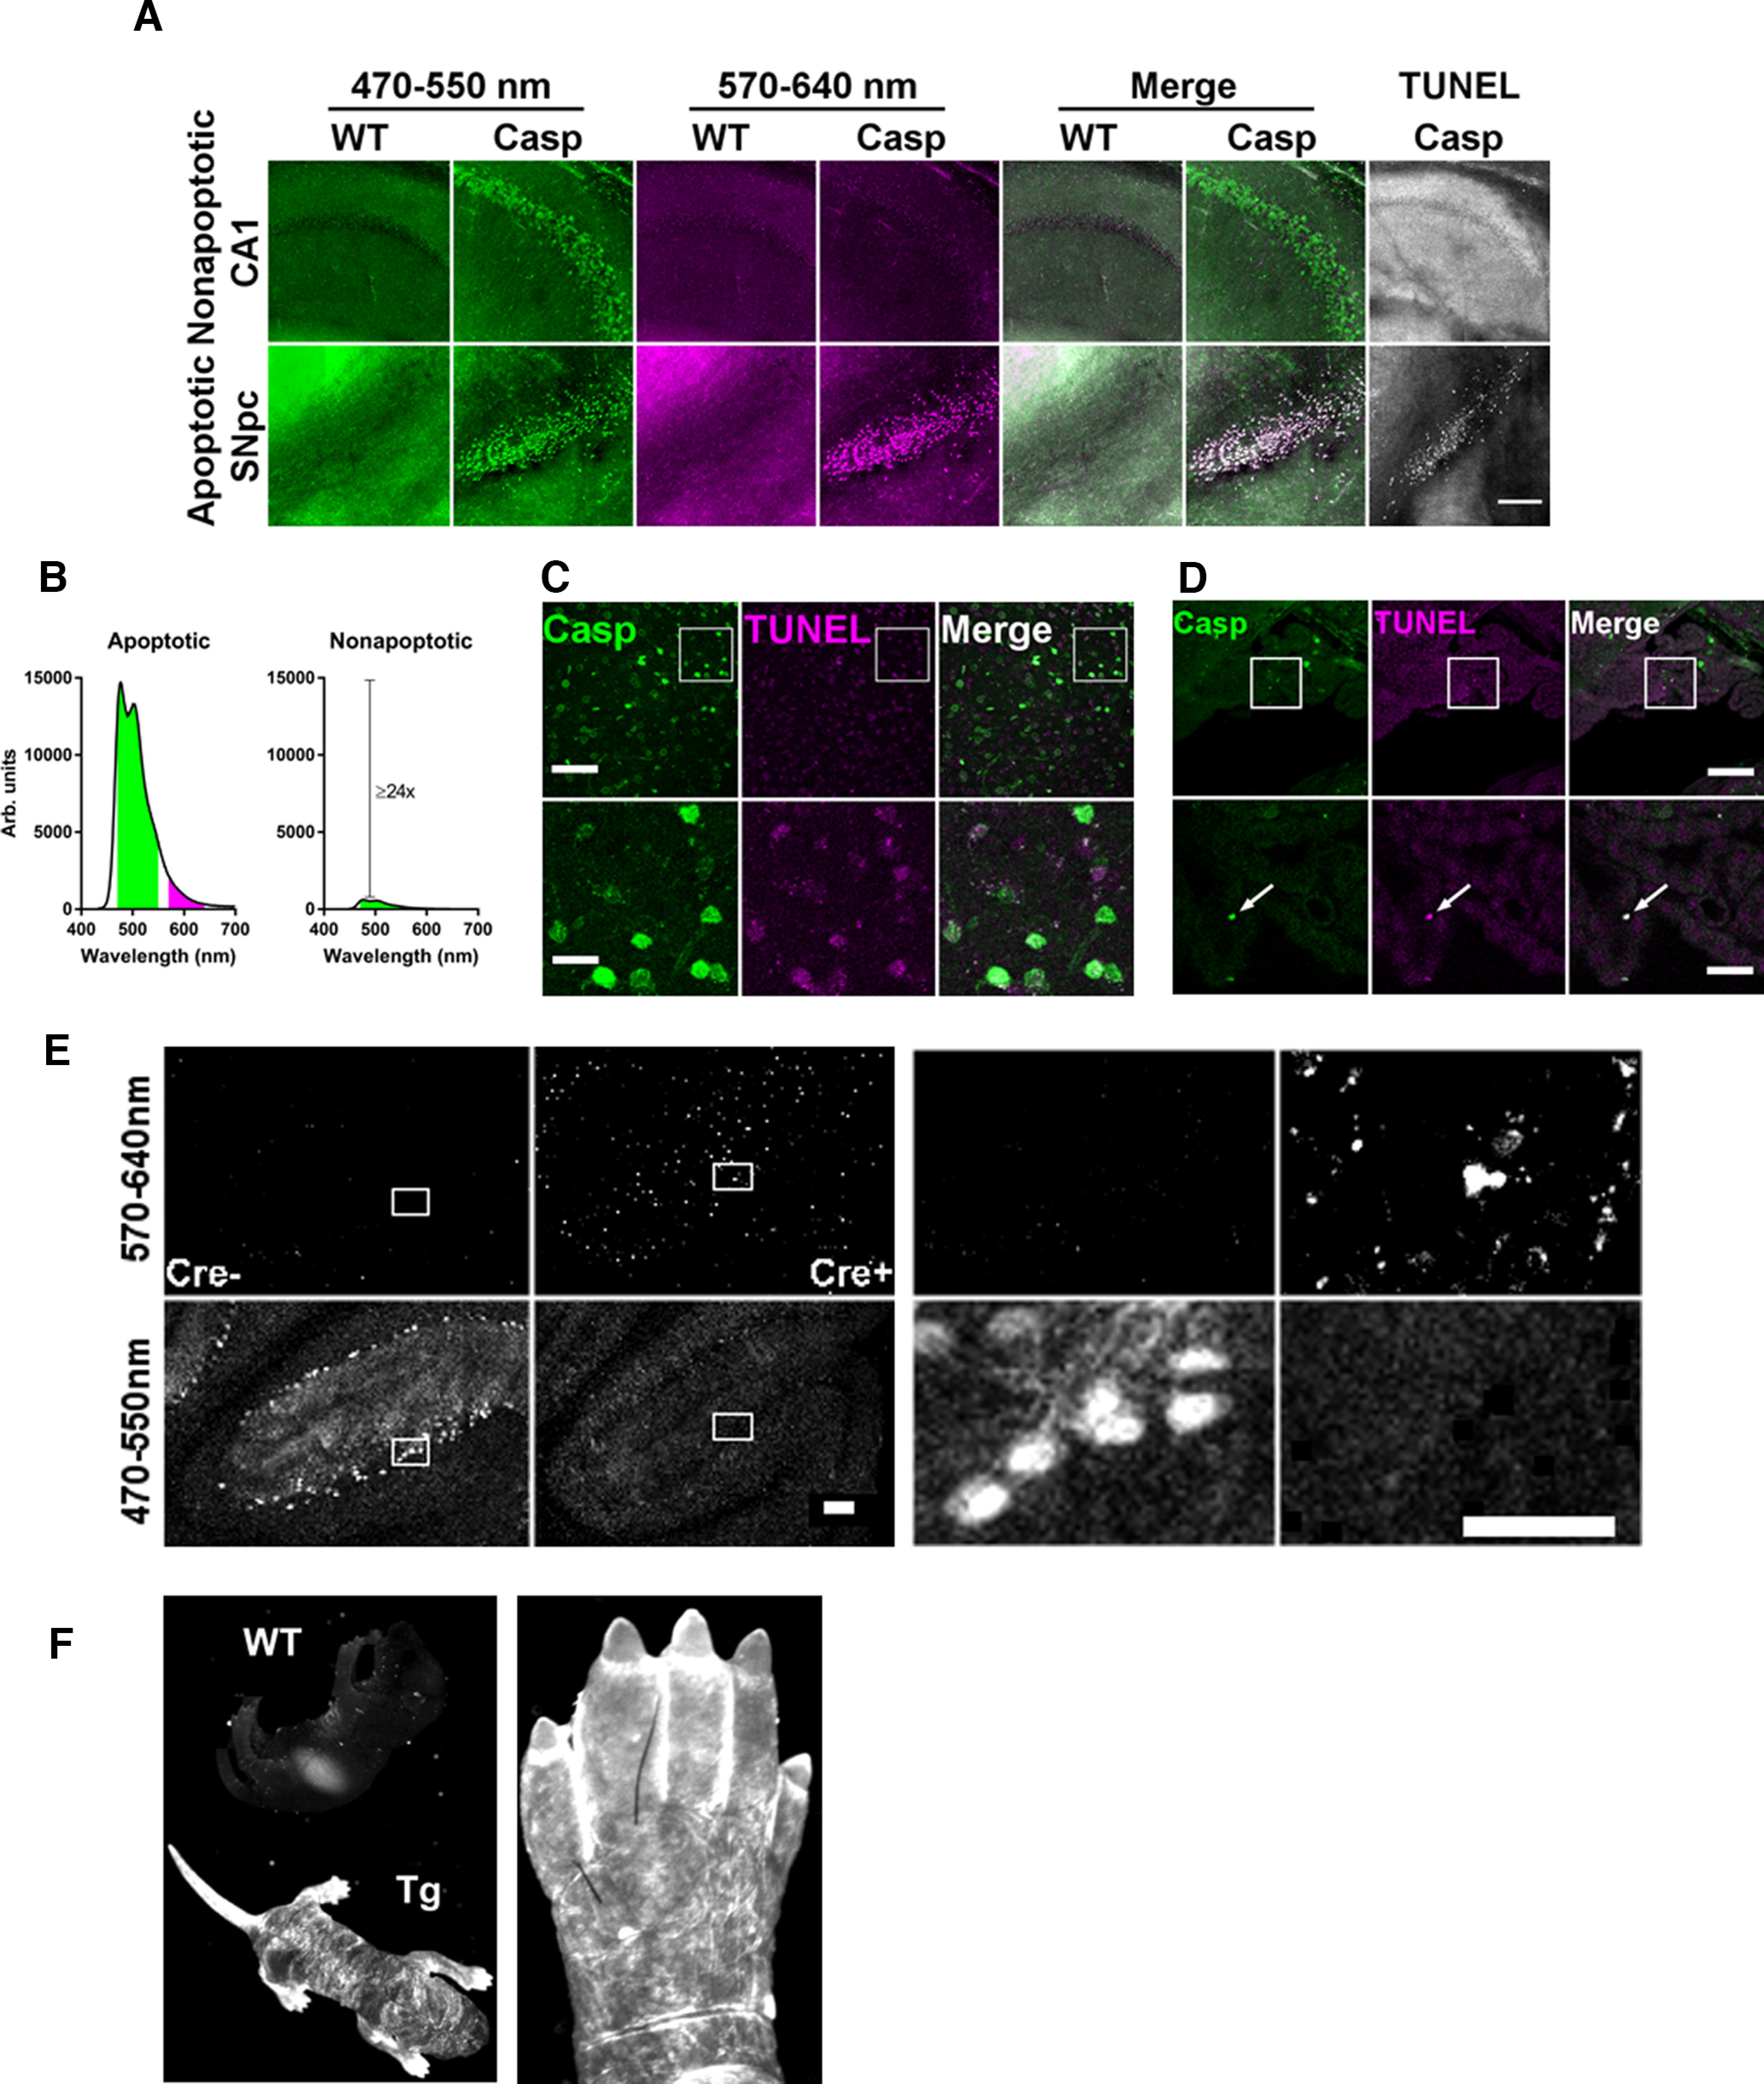
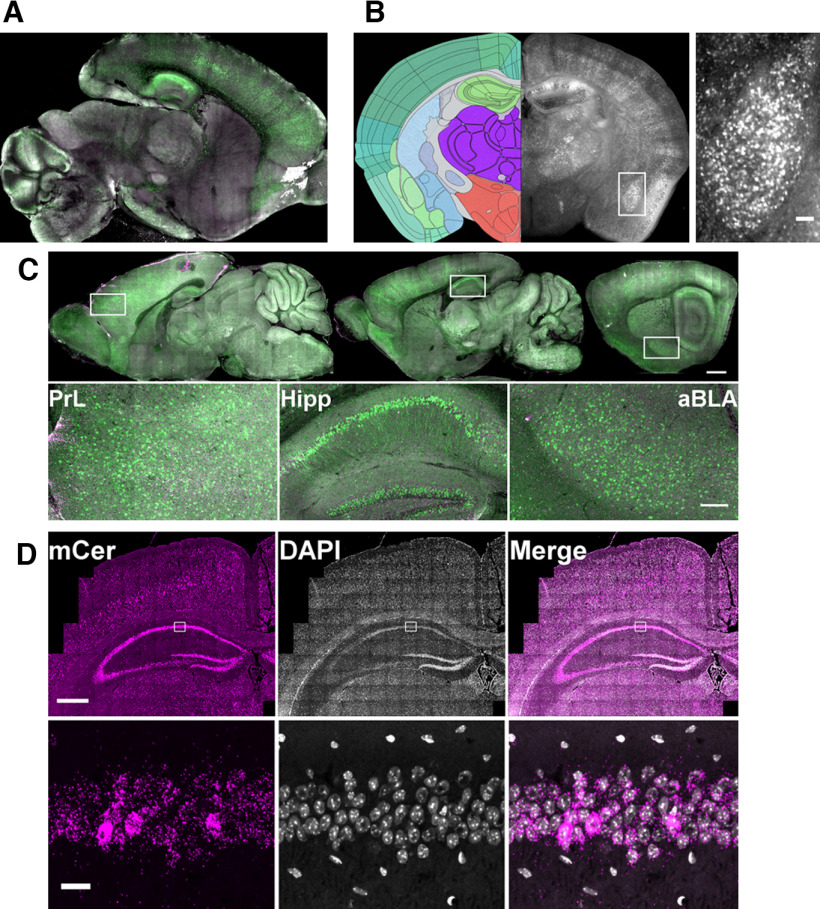
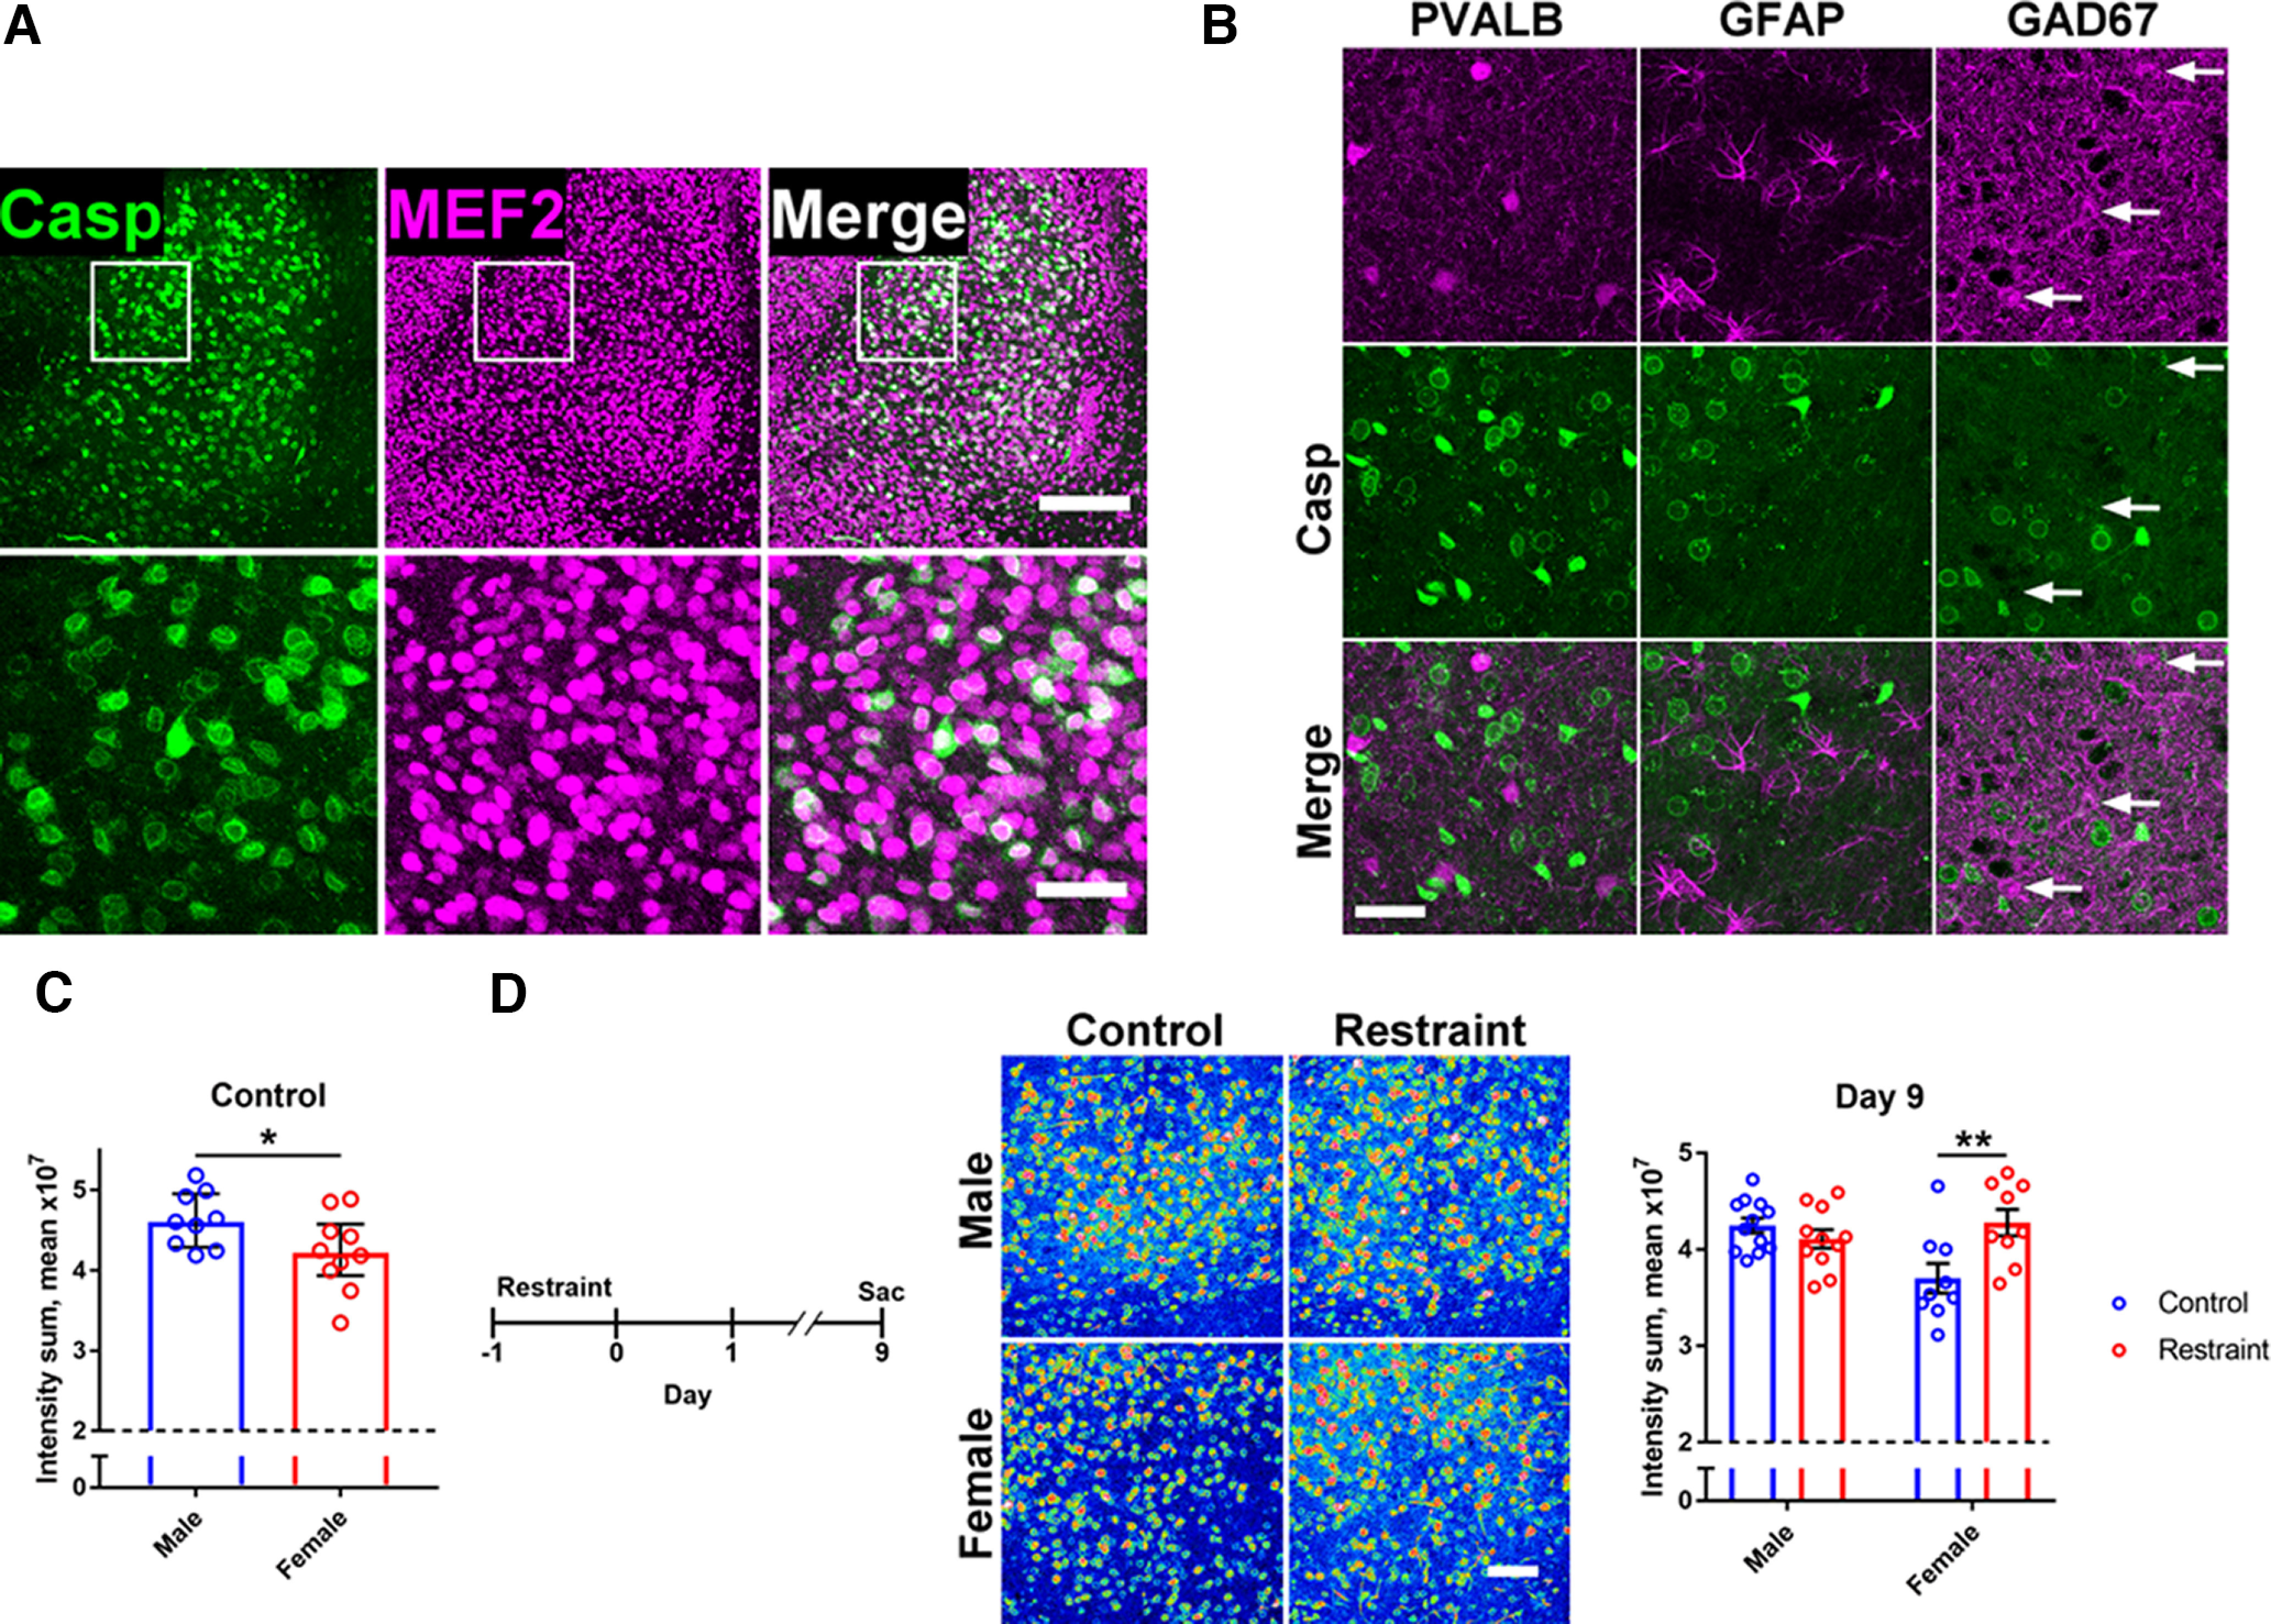
The protease caspase-3 is a key mediator of apoptotic programmed cell death. But weak or transient caspase activity can contribute to neuronal differentiation, axonal pathfinding, and synaptic long-term depression. Despite the importance of sublethal, or nonapoptotic, caspase activity in neurodevelopment and neural plasticity, there has been no simple method for mapping and quantifying nonapoptotic caspase activity (NACA) in rodent brains. We therefore generated a transgenic mouse expressing a highly sensitive and specific fluorescent reporter of caspase activity, with peak signal localized to the nucleus. As a proof of concept, we first obtained evidence that NACA influences neurophysiology in an amygdalar circuit. Then focusing on the amygdala, we were able to quantify a sex-specific persistent elevation in caspase activity in females after restraint stress. This simple in vivo caspase activity reporter will facilitate systems-level studies of apoptotic and nonapoptotic phenomena in behavioral and pathologic models.

Keywords: amygdala; caspases; in vivo reporter; mapping; nonapoptotic; sex differences; stress.


Figures

Figure 1.
Figure 1.
Design of a transgenic caspase-3/7 activity reporter. A, Vector map. From left, Poly A, polyadenylation sequence; NLS, nuclear localization sequence; DEVDG, caspase cleavage site; PEST, protein degradation sequence; mCer, mCerulean fluorophore; C-, N-intein, carboxy-terminal and amino-terminal bacterial inteins; Kozak, initiation sequence; CAG, CAGGS promoter; NES, nuclear export sequence. B, Schematic of caspase-mediated and intein-mediated bimolecular fluorescence complementation. KFAEY, CFNKS, intein linkers; other abbreviations as in A. C, Examples of weak reporter signal at nuclear envelope (green arrows) and brighter reporter signal filling nucleus and soma (magenta arrows). Basolateral amygdala; scale bar, 50 μm. See also Table 2.
Figure 2.
Figure 2.
Detection of apoptosis in vitro. A, In U2OS cells, transiently transfected caspase activity reporter (green) colocalized with cleaved caspase-3 antibody (magenta) in morphologically apoptotic cells (gray). Scale bar, 40 μm (above), 10 μm (below). B, Above, A375 melanoma cells transfected with caspase activity reporter then treated with apoptotic stimuli showed an increase in fluorescent signal that was abolished by the caspase inhibitor Q-VD-OPh (QVD, 20 μm). TNFCHX, hTNFa 20 ng/ml + cycloheximide 1 μg/ml; AU, ABT-736 10 μm + UMI-77 10 μm; STS, staurosporine 1 μm. Two-way RM-ANOVA (treatment: left, F(1,4) = 529.5; middle, F(1,4) = 47.88; right, F(1,4) = 10.78); mean ± SEM; n = 3. *p < 0.05, **p < 0.01, ****p < 0.0001. Below, Example of in vitro conditions. Casp, caspase activity reporter. Scale bar, 100 μm. See also Table 2.
Figure 3.
Figure 3.
Validation of a transgenic caspase-3/7 activity reporter. A, Representative data (left) and time course (right) of caspase reporter intensity and cell death in primary hippocampal neurons treated with 100 nm staurosporine. Two-way RM-ANOVA with Tukey’s multiple comparisons test (Reporter × Time F(2,12) = 216.7); mean ± SEM; n = 4. n.s., not significant, ***p < 0.001, ****p < 0.0001. Scale bar, 100 μm. B, Apoptotic reporter signal (magenta) in the substantia nigra pars compacta ipsilateral to a 6-hydroxydopamine injection (Casp Inj), but not contralateral to the injection (Casp Uninj) or in injected wild-type (WT Inj), and confirmed by TUNEL stain (Casp Inj TUNEL). Green (Casp Uninj, Casp Inj) represents nonapoptotic reporter signal. Scale bar, 100 μm. C, Caspase reporter distribution after MCAO (arrow) versus sham. Red-blue is high-low signal intensity. Scale bar, 1 mm. D, Attenuation of reporter signal by a caspase inhibitor (3.7 μm Z-DEVD-FMK) in acute hippocampal slices. SR, stratum radiatum. Dashed line denotes threshold of detection. Mann–Whitney test (U = 9); median ± IQR; n = 12 DMSO, 5 DEVD. *p < 0.05. Scale bar, 200 μm. E, Hippocampal nonapoptotic reporter signal is predominantly in neurons of the stratum pyramidale. Acute hippocampal slice. Scale bar, 50 μm. See also Table 2.
Figure 4.
Figure 4.
Separation of apoptotic and nonapoptotic reporter signal. A, Separation of nonapoptotic (above) from apoptotic (below) reporter signal by comparing short-wavelength (green) and long-wavelength (magenta) emission. Data are the same experiment as Figure 3B. Scale bar, 200 μm. B, Quantitative comparison of apoptotic and nonapoptotic reporter signal in short-wavelength (green) and long-wavelength (magenta) channels, derived from data used for Figure 7D (see Materials and Methods). C, Lack of colocalization between nonapoptotic reporter signal (green) and TUNEL stain (magenta) in the basolateral amygdala. Scale bar, 100 μm (above) and 25 μm (below). D, Colocalization of reporter signal (green) with TUNEL stain (magenta) in apoptotic epithelial cells of the choroid plexus. Scale bar, 100 μm (above) and 25 μm (below). E, Separation of apoptotic (row 1) from nonapoptotic (row 2) reporter signal in Purkinje cells of Arpc3 conditional knock-out mice, with and without Cre recombination. Scale bar, 100 μm (left) and 50 μm (right). F, Caspase reporter signal is present in shedding skin of a transgenic P0 mouse (left, Tg) and in apoptotic webbing between its toes (right). Weak signal in wild-type (WT) P0 mouse is autofluorescence in the stomach. See also Table 2.
Figure 5.
Figure 5.
Regional and cellular location of nonapoptotic reporter signal. A, Nonapoptotic reporter signal (green) in a clarified sagittal section of P22 brain. B, Nonapoptotic reporter signal in a coronal section of P44 brain (right). Left atlas tracing image credit: Allen Institute (Lein et al., 2007). Inset, Anterior basolateral amygdala. Scale bar, 100 μm. C, Nonapoptotic signal (green) is elevated in prelimbic cortex (PrL), hippocampus (Hipp), and anterior basolateral amygdala (aBLA). Scale bar, 1 mm (above) and 200 μm (below). D, RNA in situ hybridization against mCerulean (mCer, magenta). In the insets, note lack of colocalization with DAPI signal outside of the pyramidal cell layer. Scale bar, 500 μm (above) and 20 μm (below). See also Table 2.
Figure 6.
Figure 6.
NACA contributes to functional connectivity in a stress-associated amygdalar circuit. A, Pharmacokinetics of 5 mg/kg Q-VD-OPh in mouse brain and plasma after intraperitoneal injection. Mean ± SEM; three to five mice per time point. B, Receptors and transporters screened for interaction with Q-VD-OPh. C, Representative traces of LFPs recorded from amygdala (Amy), hippocampus (Hip), and prelimbic cortex (PrL) in a freely behaving mouse. D, Spectral coherence between three area pairs (Amy-Hip, Amy-PrL, and Hip-PrL). Data are presented as 95% confidence intervals; 15 mice. E, Table of spectral coherence differences across functional connectivity bands depicted in D, and representative β (15–30 Hz) frequency traces. Two-way RM-ANOVA with Box–Cox transform; magenta highlights significant value. F, Representative spectral coherence data between basal amygdala and prelimbic cortex. Magenta box shows decreased coherence after caspase inhibitor treatment. G, Reduced functional connectivity between basal amygdala and prelimbic cortex after caspase inhibitor treatment (QVD). Two-way RM-ANOVA with Sidak’s multiple comparisons test (Drug × Time F(1,13) = 6.594). H, Decreased LFP power after QVD treatment in basal amygdala (left), but not in prelimbic cortex (right). Two-way RM-ANOVA with uncorrected Fisher’s LSD (Drug × Time: left, F(1,13) = 6.811; right, F(1,13) = 3.343). I, Table of spectral power differences. Two-way RM-ANOVA with Box–Cox transform; magenta highlights significant value. D, E, G–I, n = 7 DMSO, 8 QVD; *p < 0.05.
Figure 7.
Figure 7.
NACA, the amygdala, and behavioral stress. A, Colocalization of reporter signal (Casp, green) with the neuronal marker myocyte enhancer factor 2 (MEF2, magenta) in basolateral amygdala. Scale bar, 200 μm (above) and 50 μm (below). B, Lack of colocalization of reporter signal (Casp, green) with (all magenta): parvalbumin (PVALB), glial fibrillary acidic protein (GFAP), and glutamic acid decarboxylase 67 kDa (GAD67). White arrows indicate cells with elevated antibody staining. Scale bar, 50 μm. C, Reduced baseline NACA in female mice. Dashed line represents threshold of detection. Mann–Whitney test (U = 20); median ± IQR; n = 9 M, 10 F. D, Left, Time course of the experiment. Middle, Representative caspase reporter intensity data (red-blue, high-low intensity). Right, Sex-specific increase in NACA 9 d after restraint stress. Dashed line denotes threshold of detection. Two-way ANOVA with Sidak’s multiple comparisons test (Sex × Stress F(1,37) = 9.931); mean ± SEM; n = 12 M. Cont., 11 M. Rest., 9 F Cont., 9 F Rest. from two independent experiments. Scale bar, 100 μm. *p < 0.05, **p < 0.01. See also Table 2.

References

    1. Bardet PL, Kolahgar G, Mynett A, Miguel-Aliaga I, Briscoe J, Meier P, Vincent JP (2008) A fluorescent reporter of caspase activity for live imaging. Proc Natl Acad Sci U S A 105:13901–13905. 10.1073/pnas.0806983105 - DOI - PMC - PubMed
    1. Beevor C (1883) Die Kleinhirnrinde. Arch Amt Physiol 365–388.
    1. Beraldo FH, Arantes CP, Santos TG, Queiroz NG, Young K, Rylett RJ, Markus RP, Prado MA, Martins VR (2010) Role of alpha7 nicotinic acetylcholine receptor in calcium signaling induced by prion protein interaction with stress-inducible protein 1. J Biol Chem 285:36542–36550. 10.1074/jbc.M110.157263 - DOI - PMC - PubMed
    1. Beraldo FH, et al.. (2013) Stress-inducible phosphoprotein 1 has unique cochaperone activity during development and regulates cellular response to ischemia via the prion protein. FASEB J 27:3594–3607. 10.1096/fj.13-232280 - DOI - PubMed
    1. Besnard J, et al.. (2012) Automated design of ligands to polypharmacological profiles. Nature 492:215–220. 10.1038/nature11691 - DOI - PMC - PubMed

Publication types