. 2022 Oct;2(10):923-940.
doi: 10.1038/s43587-022-00290-0. Epub 2022 Oct 12.

Alzheimer's disease-associated U1 snRNP splicing dysfunction causes neuronal hyperexcitability and cognitive impairment

Affiliations

Alzheimer's disease-associated U1 snRNP splicing dysfunction causes neuronal hyperexcitability and cognitive impairment

Ping-Chung Chen et al. Nat Aging. 2022 Oct.

Abstract

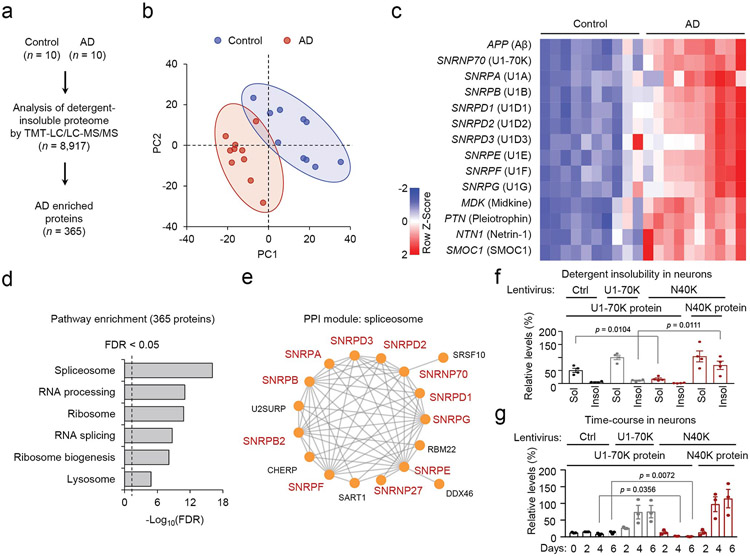
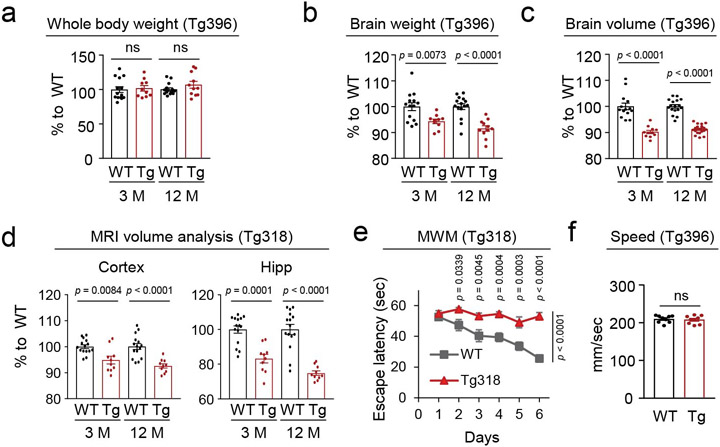
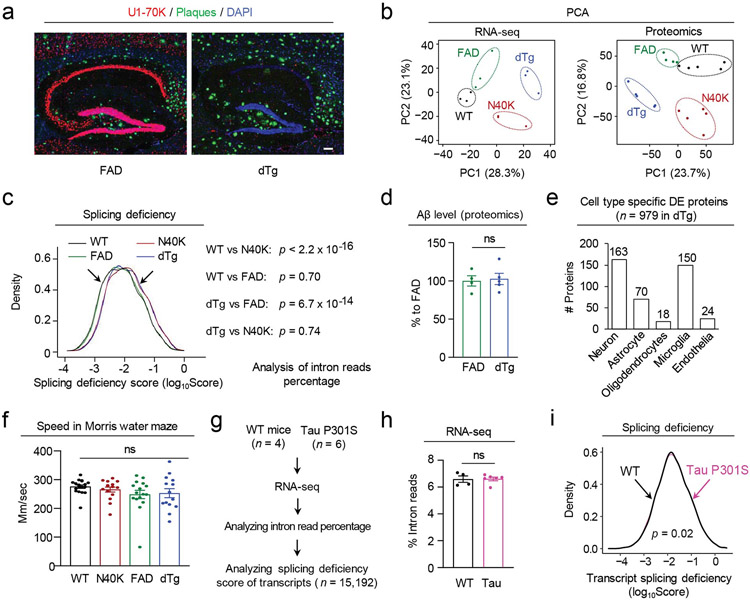
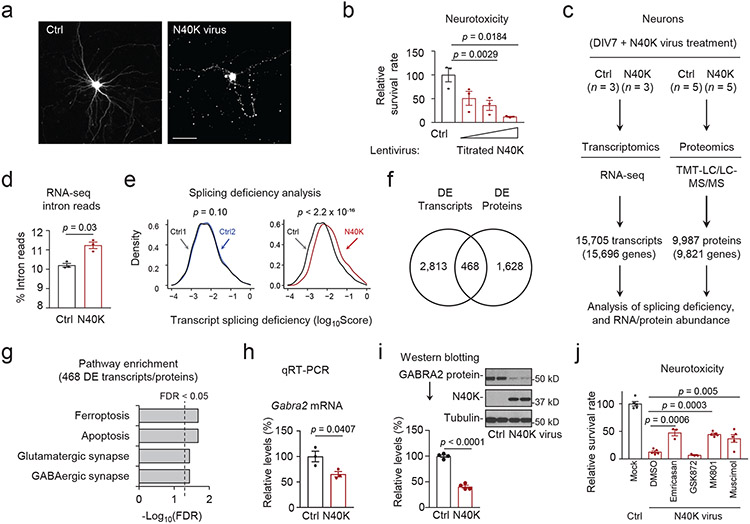
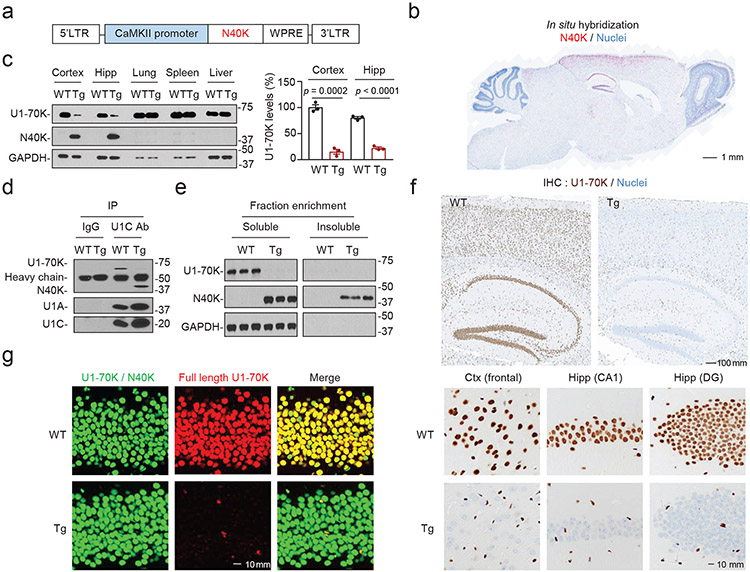
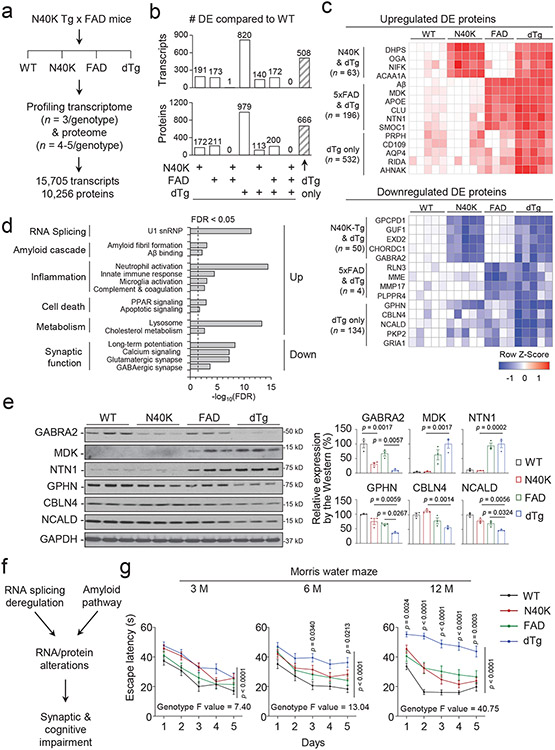
Recent proteome and transcriptome profiling of Alzheimer's disease (AD) brains reveals RNA splicing dysfunction and U1 small nuclear ribonucleoprotein (snRNP) pathology containing U1-70K and its N-terminal 40-KDa fragment (N40K). Here we present a causative role of U1 snRNP dysfunction to neurodegeneration in primary neurons and transgenic mice (N40K-Tg), in which N40K expression exerts a dominant-negative effect to downregulate full-length U1-70K. N40K-Tg recapitulates N40K insolubility, erroneous splicing events, neuronal degeneration and cognitive impairment. Specifically, N40K-Tg shows the reduction of GABAergic synapse components (e.g., the GABA receptor subunit of GABRA2), and concomitant postsynaptic hyperexcitability that is rescued by a GABA receptor agonist. Crossing of N40K-Tg and the 5xFAD amyloidosis model indicates that the RNA splicing defect synergizes with the amyloid cascade to remodel the brain transcriptome and proteome, deregulate synaptic proteins, and accelerate cognitive decline. Thus, our results support the contribution of U1 snRNP-mediated splicing dysfunction to AD pathogenesis.


Figures

Extended Data Fig. 1.
Extended Data Fig. 1.. Deep TMT profiling of detergent insoluble proteome in AD and quantitative analysis of western blotting.
a, Proteomic profiling of detergent-insoluble proteome of 10 control and 10 AD cases by TMT-LC/LC-MS/MS. A total of 8,917 proteins were identified, out of which 365 proteins were found to be increased in AD detergent insoluble proteome. b, Principal component analysis of the insoluble proteome in control and AD cases. c, Heatmap of selected top proteins and U1 snRNP components enriched in AD. d, Pathway enrichment analysis of the proteins enriched in the AD insoluble proteome (Fisher's exact test and the BH procedure to generate FDR values). e, Enriched protein-protein interaction module of spliceosome. f, Quantified data of western blotting (4 replicates) in Fig. 1d (Student’s t-test). g, Quantified data of western blotting (triplicates) in Fig. 1e to show that the N40K expression leads to the depletion of endogenous U1-70K in neurons (Student’s t-test). Data are shown as mean ± SEM. * p < 0.05, ** p < 0.01.
Extended Data Fig. 2.
Extended Data Fig. 2.. Generation of multiple N40K Tg lines with N40K expression and U1-70K downregulation.
a, Strategy for producing N40K Tg lines by the injection of N40-expressing lentivirus. b, Chromosomal localization of Tg determined by fluorescence in situ hybridization (FISH) analysis. Left: Chr18 (green), N40K (red) in Tg396 line; Right: Chr10 (green), N40K (red) in Tg318 line. c, Western blotting of U1-70K and N40K in Tg396 and Tg318 Tg lines. N40K expression led to similar depletion of U1-70K protein in the hippocampus of both lines. d, Quantitation of relative N40K levels in cortex and hippocampus of Tg396 lines by western blotting. Titrated Tg proteins produce a linear response curve (R2 = 0.98). According to the curve equation, N40K is at a ~2-fold level of native U1-70K as in WT mice (Student t-test). Data are shown as mean ± SEM. * p < 0.05.
Extended Data Fig. 3.
Extended Data Fig. 3.. Proteomics analysis of insoluble fraction in WT and N40K-Tg mice.
a, Proteomic profiling of detergent-insoluble proteome of WT and N40K-Tg mice (12-month-old, WT n = 3, Tg n = 3). b, Principal component analysis of the insoluble proteome of WT and N40K. c, Heatmap of differentially expressed proteins in N40K-Tg insoluble fraction. d, Pathway enrichment analysis of differentially expressed proteins in N40K-Tg insoluble fraction (Fisher's exact test) followed by FDR analysis by the BH procedure. e, Enriched PPI module of spliceosomal snRNP complex (Fisher's exact test and the BH procedure, FDR < 0.05). Each dot represents a protein, whereas the interaction is indicated by connected lines.
Extended Data Fig. 4.
Extended Data Fig. 4.. N40K Tg mice exhibit brain weight loss and brain volume reduction, but with normal locomotive activities.
a-c, N40K Tg mice showed reduction of brain weight and brain volume, whereas the body weight had no change at different ages (3-month-old: WT n = 14, Tg n = 10-11; 12-month-old: WT n = 14-16, Tg n = 11-19, Student t-test). d, Volume change of Tg318 mouse in cortex, and hippocampus (Hipp) measured by MRI at different ages (3-month-old: WT n = 15, Tg n = 10; 12-month-old: WT n = 15, Tg n = 10, two-way ANOVA followed by Sidak's multiple comparison test). e, Morris water maze task for Tg318 mice. Compared to WT control, Tg318 mice showed significant difference at day 3-6 (two-way ANOVA followed by Sidak's multiple comparison test). f, Speed in the probe trial of Morris water maze at day 6 showed no significant difference between WT and Tg mice in Figure 4g (12-month-old: WT n = 9, Tg n = 9, Student t-test). Data are shown as mean ± SEM, ns (not significant); * p < 0.05; ** p < 0.01; *** p < 0.001; **** p < 0.0001.
Extended Data Fig. 5.
Extended Data Fig. 5.. Validation of splicing deficient transcripts of synaptic pathway in N40K-Tg mice.
a-b, Quantitation of intron accumulation at the selected region of Gabra2, Gng7, Kcnh1, and Camk1d. IGV software was used to display RNA read density with same scale range in each gene from RNA-seq (ex: exon; in: intron). Red boxes show selected regions for quantification. Intron reads % was analyzed by RNA-seq ((intron-exon junctions + introns)/(intron-exon junctions + introns + exons + exon-exon junctions)). Intron retention % was analyzed by RT-PCR ((intron-containing PCR band intensity)/(intron-containing PCR band intensity + exon-exon PCR band intensity)). Gabra2: intron 6 vs exon 6 and 7; Gng7: intron 2 vs exon 2 and 3, Kcnh1: intron 9 vs exon 9 and 10, and Camk1d: intron 5 vs exon 5 and 6. 12-month-old: WT n = 3, Tg n = 3. Scale bar, 10 kb. Data are shown as mean ± SEM. Statistical significance was analyzed by Student's t-test. Data are shown as mean ± SEM, * p < 0.05; ** p < 0.01; *** p < 0.001.
Extended Data Fig. 6.
Extended Data Fig. 6.. Profiling analysis of dTg and tau mice.
a, Representative co-immunofluorescence staining of 5xFAD and dTg brain slides with Thioflavin S for plaques and the U1-70K C-terminal antibody for U1-70K depletion. Scale bar, 100 μm. b, PCA for RNA-seq and proteomics studies. c, Distribution of splicing deficiency scores of mapped transcripts. Statistical comparisons between different genotypes are shown (Kolmogorov–Smirnov test). d, Relative Aβ level in 5xFAD and dTg by the proteomics analysis (mean ± SEM, Student’s t-test, ns: not significant). e, Cell type enriched DE proteins in the dTg mice. The 979 DE proteins were overlapped with the cell type expression data from RNA-seq analysis. f, Swimming speed of WT, N40K Tg, 5xFAD, dTg in the Morris water maze experiment (mean ± SEM, one-way ANOVA, ns: not significant). g, RNA-seq analysis of WT and Tau (P301S) mice. h, The percentage of mapped intron reads in all transcripts from the cortices of WT (n = 5) and Tau P301S (n = 6) mice (mean ± SEM, Student’s t-test, ns: not significant). i, Distribution of splicing deficiency scores of mapped transcripts (Kolmogorov–Smirnov test).
Extended Data Fig. 7.
Extended Data Fig. 7.. Proteomic comparison of the three mouse models and AD.
a, The workflow to examine the consistent changes in the three mouse models and human AD cases by overlapping differentially expressed proteins. b, DE protein numbers in the mouse models, human cases, and the overlapped portions. c, Enriched pathways of the human-overlapped DE proteins in three genotypes (selected from supplementary table 19, Fisher's exact test and the BH procedure to derive FDR, FDR cutoff of 0.05). d, Enriched protein-protein interaction modules (selected from supplementary table 20, Fisher's exact test and the BH procedure to derive FDR). FDR cutoff is 0.05 except the Aβ binding module, which is selected due to biological significance.
Extended Data Fig. 8.
Extended Data Fig. 8.. Analysis of the role of TDP-43 in human cases and the mouse models.
a, The weak correlation between the percentage of intron reads and the stages of TDP-43 pathology. Pearson correlation coefficient (r) is shown. b, The percentage of mapped intron reads in all transcripts from human cases of different TDP-43 stages (mean ± SEM, Student’s t-test, ns: not significant). As the sample size was small, we merged stages 0-1 and stages 2-3 in the analysis. c, Distribution of splicing deficiency scores of mapped transcripts (Kolmogorov–Smirnov test). d, Staining of plaques, Tau, TDP-43, and nuclei in a human AD brain sample (positive controls) and in the mouse models (cortex, ~12-month-old). Phosphorylated Tau and TDP-43 antibodies were used.
Figure 1.
Figure 1.. Tissue proteomics confirms U1 snRNP aggregation and N40K shows detergent insolubility and dominant negative effects to deplete U1-70K through proteasomal degradation.
a, Volcano plot of detergent-insoluble proteome by deep TMT-LC/LC-MS/MS analysis (10 AD and 10 non-dementia control cases). Among 8,917 identified proteins, 365 proteins were accumulated in the AD samples. Dashed lines indicate the cutoffs (FDR < 0.05, log2(AD/Ctrl) > 0.30, equivalent to 2-fold of the standard deviation). b, Diagram of the U1 snRNP complex. c, Diagrams of U1-70K and N40K domains: RRM: RNA recognition motif, LC: low complexity domain. d, Aggregation analysis of U1-70K and N40K. Control EGFP (Ctrl), U1-70K-FLAG, and N40K-FLAG were expressed in mouse cortical neurons (DIV 12) by lentiviruses (MOI 10) and extracted with 1% sarkosyl to produce detergent soluble (Sol) and insoluble (Insol) fractions for immunoblotting. The experiment was repeated 4 times and quantified (Extended Data Fig. 1f). e, The dominant-negative effect of N40K in a time course analysis. Cortical neurons were infected with lentiviruses for the analysis (DIV 12, MOI 10). The experiment was triplicated with quantification (Extended Data Fig. 1g). f, Endogenous U1-70K mRNA quantitated by qRT-PCR in the control and N40K-expressing neurons (3 replicates, mean ± SEM, Student’s t-test, ns: not significant). g, The model of U1-70K downregulation induced by N40K expression. h, U1-70K or N40K assembled in U1 snRNP. Control EGFP (Ctrl), U1-70K-FLAG or N40K-FLAG was expressed in HEK 293T cells and immunoprecipitated by FLAG Ab for SDS-PAGE, followed by Ponceau S staining and immunoblotting by U1A and U1C antibodies. i, U1-70K downregulation is mediated by the ubiquitin-proteasome pathway. Neurons were infected with the N40K lentivirus for 2 days (DIV 12, MOI 10), then treated with solvent DMSO 0.1% (Ctrl), the proteasome inhibitor MG132 (10 μM) or the autophagy inhibitor bafilomycin A (Baf, 10 nM) for 1 or 2 days, and harvested for immunoblotting. The experiment was repeated 4 times and the U1-70K levels were quantified (two-way ANOVA and Tukey's multiple comparison test). Data are shown as mean ± SEM. Full statistical information is in Source Data Statistics.
Figure 2.
Figure 2.. Comprehensive analysis of transcriptome and proteome reveals synaptic pathway in N40K-induced neuron death.
a, Morphology of representative cultured neurons with lentiviral expression of control EGFP (Ctrl) and N40K (with EGFP for visualization). Scale bar: 20 μm. The experiment was repeated three times independently. b, Neuron survival rate under dose-dependent N40K expression. Mouse cortical neurons were transduced with the control or N40K lentivirus at MOI 7, 20, or 60 for 5 days followed by the CellTiter-Glo luminescent cell viability assay (n=3),). Cortical neurons were transduced with control or N40K lentivirus at MOI 10 for 4 days and harvested for c-I. c, Transcriptomic and proteomic profiling. Sample sizes are indicated. To simplify data processing, we analyzed the major transcripts without considering alternative splicing forms. d, Mapped intronic reads increase in N40K-expressing neurons. e, Histograms of splicing deficiency scores of individual transcripts in N40K-expressing neurons analyzed by Kolmogorov-Smirnov test (left: comparison of Ctrl1 and Ctrl2 is shown as a null (p = 0.1), right: comparison of average score of control and N40K neurons (n = 3, p < 2 .2 x 10−16). f, Overlapping of DE RNAs (FDR < 0.05) and proteins (FDR < 0.05). g, Pathway enrichment of the overlapped DE transcripts/proteins (selected from Supplementary Table 7). FDR was derived from p values (Fisher's exact test) by the BH procedure. h, Quantitative RT-PCR of Gabra2 mRNA (n=3). i, Western blotting of GABRA2 and N40K in cultured neurons transduced by control and N40K lentivirus. The analysis was repeated with 4 different wells of neurons. j, Relative survival rate of pharmacological inhibitors on N40K transduced neurons. Cortical neurons were transduced with vector (Ctrl) or N40K lentivirus for 2 days followed with pharmacological treatments for 3 days: 100 μM emricasan (apoptosis inhibitor), 50 μM GSK872 (necrosis inhibitor), 10 μM MK801 (NMDAR antagonist), or 50 μM muscimol (GABAAR agonist). All replicates were from different wells of neuron culture. Data presented as means ± SEM, p values as indicated by two-tailed Student’s t-test (d, h, i) or one-way ANOVA followed by Tukey's multiple comparison test (b, j). Full statistical information is in Source Data Statistics.
Figure 3.
Figure 3.. Biochemical and cellular characterization of the N40K-Tg mouse model.
a, Tg construct expressing N40K specifically in neurons, including CaMKIIα (CaMKII) promoter, a woodchuck hepatitis virus posttranscriptional regulatory element (WPRE) and long terminal repeats (LTR). b, N40K mRNA expression by in situ hybridization. Tg brain slides were stained with RNAscope probe specific for human N40K (Red) and hematoxylin for nuclei (blue). Scale bar: 1 mm. c, Western blotting to confirm N40K expression and loss of U1-70K specifically in the brain. Ctx: cortex; Hipp: hippocampus. The experiments were performed with three replicates and the loss of U1-70K by western blotting was quantified (mean ± SEM, Student’s t-test, two-tailed). d, N40K-assembled U1 snRNP complex in the Tg brain occludes the binding of U1-70K. Immunoprecipitation of U1C Ab was followed by immunoblotting (3 replicates). e, Aggregation analysis of N40K in the Tg brain. The mouse brain tissues were differentially extracted to generate detergent soluble (Sol) and insoluble (Insol) fractions, followed by immunoblotting (3 replicates). f, Immunostaining of WT and Tg brain tissue with U1-70K C-terminal Ab (brown) that recognized only full length U1-70K but not N40K. Slides were counter-stained with hematoxylin for nuclei (blue). DG: dentate gyrus. Scale bar, 100 μm (upper), 10 μm (lower) (n = 3 replicates). g, Confocal images of immunofluorescence staining (hippocampal DG region, green: U1-70K and N40K detected by U1-70K N-terminal Ab, red: full length U1-70K detected by U1-70K C-terminal Ab. Scale bar, 10 μm. In b, f, g, each assay was repeated from three mice. Full statistical information is in Source Data Statistics.
Figure 4.
Figure 4.. N40K-Tg mice display neuron loss and cognitive impairment.
Tg396 was used in these studies. a, Volume change of mouse whole brain, cortex and hippocampus (Hipp) measured by MRI at different ages (1-month-old: WT n = 11, Tg n = 8; 3-month-old: WT n = 14, Tg n = 11; 12-month-old: WT n = 17, Tg n = 20; two-way ANOVA and Sidak's multiple comparison test). b, Quantification of NeuN+ neurons in 12-month-old mouse cortex, CA1 and DG of hippocampus (WT n = 3-4, Tg n = 3-4, Student's t-test, two-tailed). c, Novel object recognition test (3-month-old: WT n = 14, Tg n = 11; 12-month-old: WT n = 17, Tg n = 10, Student's t-test, two-tailed). d, Percent of correct choice in Y-maze (3-month-old: WT n = 12, Tg n = 12; 12-month-old: WT n = 15, Tg n =12, Student’s t-test, two-tailed). e, Morris water maze task (12-month-old: WT n = 18, Tg n = 14, two-way ANOVA and Sidak's multiple comparison test). f, Morris water maze probe test. At day 6, the hidden platform was removed to measure distance traveled in the target quadrant (12-month-old: WT n = 14, Tg n = 12, two-way ANOVA and Sidak's multiple comparison test). g, Visual test of 12-month-old WT and N40K-Tg mice (12-month-old: WT n = 9, Tg n =9, Student's t-test, two-tailed). h, Open field test. Left: total traveling distance. Right: center/total ratio (12-month-old: WT n = 11, Tg n = 12, Student's t-test, two-tailed). Data are shown as mean ± SEM. Full statistical information is in Source Data Statistics.
Figure 5.
Figure 5.. N40K-Tg mice exhibit AD-related splicing defects enriched in synaptic function.
a, Age-dependent increase of mapped intronic reads and histogram of splicing deficiency score of individual transcripts in Tg mice (Tg396, 3-month-old: WT n = 3, and Tg n = 3, 12-month-old: WT n = 3, and Tg n = 3 biologically independent mouse samples). We quantified the percentage of intron reads (Student's t-test, two-tailed) and transcript splicing deficiency (Kolmogorov–Smirnov test). b, Increase of mapped intron reads and histograms of splicing deficiency scores of individual transcripts in ROS/MAP human AD cases (Ctrl n = 18, AD n = 35, left: Student's t-test, two-tailed; right: Kolmogorov–Smirnov test). Each point represents data of individual human cases c, Venn diagram of mouse and human splicing-defective transcripts. d, Pathway enrichment analysis of shared splicing-defective transcripts in the Tg and AD, showing selected pathways from Supplementary Table 12. FDR was derived from p values (Fisher's exact test) by the BH procedure. e, Four examples of enriched PPI modules (Supplementary Table 13), with the proteins in iPSD highlighted in red. Each dot represents a protein, whereas the interaction is indicated by connected lines. f, Validation of intron retention in selected transcripts by the density of RNA reads (ex: exon; in: intron) and RT-PCR. Red boxes show genomic regions selected for quantifying RNA-seq reads (Student's t-test, two-tailed). Scale bar, 10 kb. g, qRT-PCR analysis of Gabra2 transcripts (Student's t-test). Data are shown as mean ± SEM. in a, f, g. each point represents a data point of one mouse (WT n = 3, and Tg n = 3). Full statistical information is in Source Data Statistics.
Figure 6.
Figure 6.. N40K-Tg mice show GABRA2 reduction, post-synaptic hyperexcitation and LTP impairment.
a, GABRA2 protein reduction in N40K-Tg by western blotting (n = 5 mice in each group, Student’s t-test). b, GABRA2 protein in AD cases by western blotting (Ctrl n = 8, and AD n = 8, Student’s t-test). c, Synaptic activity assay in perforant pathway, stimulating from entorhinal cortex and recording on dentate gyrus (DG). d, LTP was shown as field excitatory postsynaptic potential (fEPSP) slope versus recording time, showing impairment in Tg396 mice. Representative traces before and after Theta-burst stimulation (TBS) were shown (WT animals n = 5, slices n = 7; Tg animals n = 5, Tg slices n = 11). The data of the last 20 min were used for statistical analysis (two-way ANOVA). e, Paired-pulse ratios that quantify presynaptic function, showing no significant difference between WT and Tg mice. two-way ANOVA). f-g, The plot of fEPSP slope against stimulus intensity shows a larger excitability in Tg compared with WT, which were alleviated upon the treatment with 2.5 μM muscimol (an agonist of GABAA receptor). Data are shown as mean ± SEM. Statistical significance was analyzed by two-way ANOVA: all four conditions together (vertical line), or any of the two conditions. (WT animals n = 5, slices n = 7; Tg animals n = 5, Tg slices n = 11, WT + muscimol animals n = 5, slices n = 5; Tg + muscimol animals n = 5, slices n = 5 in d, e, f, g). Full statistical information is in Source Data Statistics.
Figure 7.
Figure 7.. Synergistic effects of human N40K and amyloid pathway on synaptic deregulation and cognitive deficiency.
a, N40K-Tg mice bred with 5xFAD mice to obtain WT, N40K (N40K-Tg, Tg396), FAD (5xFAD), and double transgenic mice (dTg) to profile transcriptome (3 mice/genotype, 6-month-old) and proteome (5 mice/genotype except 4 mice for FAD, 6-month-old). To simplify data processing, we only analyzed the major transcripts without considering alternative splicing forms. b, Numbers of transcripts and proteins differentially expressed (DE, FDR < 0.05) in N40K, FAD or dTg mice alone and in any combinations of these three genotypes. c, Heatmaps of selected DE proteins to show synergistic effects. d, Pathway enrichment of the DE proteins in dTg (selected from Supplementary Table 17). FDR was derived from p values (Fisher's exact test) by the BH procedure. e, Expression levels of GABRA2, MDK, NTN1, GPHN, CBLN4, and NCALD in 6-month-old WT, N40K, FAD, and dTg mice (3 mice/genotype) were analyzed by western blotting and quantified. Data are shown as mean ± SEM. Statistical significance was analyzed by one-way ANOVA followed by Tukey's multiple comparison test. The ANOVA overall p value is significant for each protein. dTg vs FAD or dTg vs N40K comparisons: f, The diagram of synergistic effect of splicing dysfunction and amyloid pathway. g, Morris water maze test of 4-genotyped mice at three different ages (3-month-old: WT n = 18, N40K n = 19, FAD n = 19, dTg n = 19; 6-month-old: WT n = 18, N40K n = 19, FAD n = 19, dTg n = 18; 12-month-old: WT n = 18, N40K n = 16, FAD n = 15, dTg n = 14). Statistical significance at each age was analyzed by two-way ANOVA. The effect of genotype in all three ages is significant, and the F value of the genotype increases with ages, consistent with larger difference at the older ages. The comparison of FAD and dTg at each training day using Tukey's multiple comparison test, the difference was not significant at 3-month-old, but became significant at 6-month-old (3 and 5 days) and 12-month-old (all five individual days). Full statistical information is in Source Data Statistics.

References

    1. Raj B & Blencowe BJ Alternative Splicing in the Mammalian Nervous System: Recent Insights into Mechanisms and Functional Roles. Neuron 87, 14–27 (2015). - PubMed
    1. Cooper TA, Wan L & Dreyfuss G RNA and disease. Cell 136, 777–793 (2009). - PMC - PubMed
    1. Scotti MM & Swanson MS RNA mis-splicing in disease. Nat Rev Genet 17, 19–32 (2016). - PMC - PubMed
    1. Mathieu C, Pappu RV & Taylor JP Beyond aggregation: Pathological phase transitions in neurodegenerative disease. Science 370, 56–60 (2020). - PMC - PubMed
    1. Lefebvre S et al. Identification and characterization of a spinal muscular atrophy-determining gene. Cell 80, 155–165 (1995). - PubMed

Publication types

Substances