. 2022 Dec 27:12:942328.
doi: 10.3389/fcimb.2022.942328. eCollection 2022.

The oral cancer microbiome contains tumor space-specific and clinicopathology-specific bacteria

Affiliations

The oral cancer microbiome contains tumor space-specific and clinicopathology-specific bacteria

Bin Zeng et al. Front Cell Infect Microbiol. .

Abstract

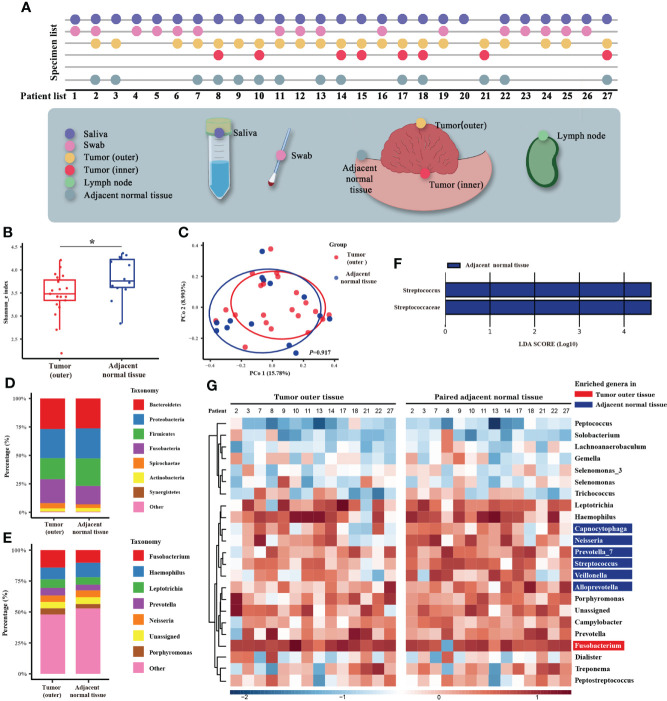
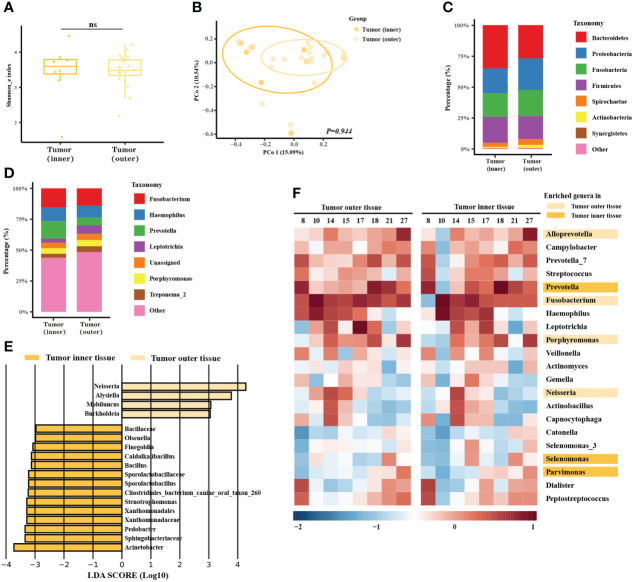
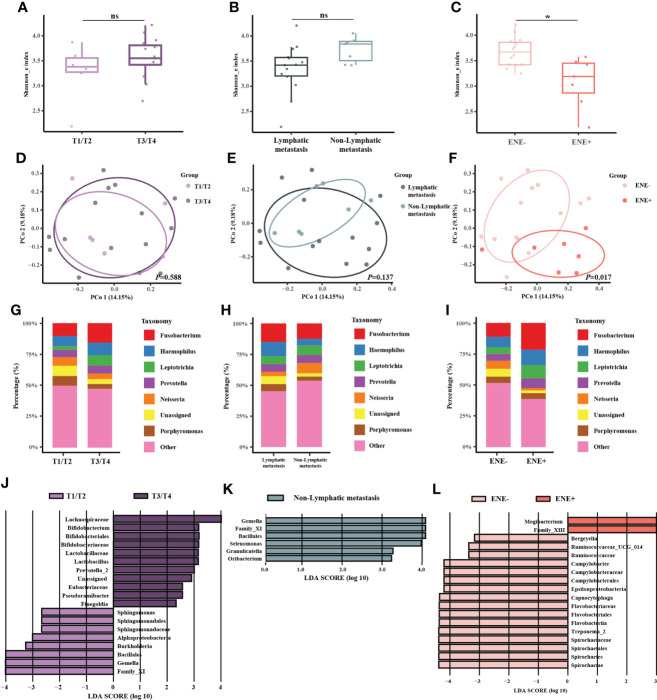
The crosstalk between the oral microbiome and oral cancer has yet to be characterized. This study recruited 218 patients for clinicopathological data analysis. Multiple types of specimens were collected from 27 patients for 16S rRNA gene sequencing, including 26 saliva, 16 swabs from the surface of tumor tissues, 16 adjacent normal tissues, 22 tumor outer tissue, 22 tumor inner tissues, and 10 lymph nodes. Clinicopathological data showed that the pathogenic bacteria could be frequently detected in the oral cavity of oral cancer patients, which was positively related to diabetes, later T stage of the tumor, and the presence of cervical lymphatic metastasis. Sequencing data revealed that compared with adjacent normal tissues, the microbiome of outer tumor tissues had a greater alpha diversity, with a larger proportion of Fusobacterium, Prevotella, and Porphyromonas, while a smaller proportion of Streptococcus. The space-specific microbiome, comparing outer tumor tissues with inner tumor tissues, suggested minor differences in diversity. However, Fusobacterium, Neisseria, Porphyromonas, and Alloprevotella were more abundant in outer tumor tissues, while Prevotella, Selenomonas, and Parvimonas were enriched in inner tumor tissues. Clinicopathology-specific microbiome analysis found that the diversity was markedly different between negative and positive extranodal extensions, whereas the diversity between different T-stages and N-stages was slightly different. Gemella and Bacillales were enriched in T1/T2-stage patients and the non-lymphatic metastasis group, while Spirochaetae and Flavobacteriia were enriched in the extranodal extension negative group. Taken together, high-throughput DNA sequencing in combination with clinicopathological features facilitated us to characterize special patterns of oral tumor microbiome in different disease developmental stages.

Keywords: 16S rDNA sequencing; clinicopathology; intratumoral bacteria; oral cancer (OC); oral microbiome.


Conflict of interest statement

The authors declare that the research was conducted without any commercial or financial relationships that could be construed as a potential conflict of interest.

Figures

Figure 1
Figure 1
Microbiome analysis between tumor and normal adjacent tissues. (A) Diagram of the patient list and original collection sites of the specimens. Different colors mark six types of specimens, and detailed sampling sites are shown. In the specimen list, the dots represent the specimens that were qualified and sequenced. (B) Box plot of the alpha diversity of outer tumor tissues and normal adjacent tissues, shown by Shannon index. The horizontal bars within boxes represent medians. The tops and bottoms of boxes represent the 75th and 25th percentiles, respectively. (C) Principal coordinate analysis (PCoA) of outer tumor tissues and normal adjacent tissues based on Bray-Curtis distance. The dots represent the specimens, and the circles represent the microbial community associated with outer tumor tissues (red) and normal adjacent tissues (blue). (D, E) The microbial composition of the outer tumor tissues and normal adjacent tissues. D = phylum level and E = genera level. (F) Significantly different bacteria in two groups as determined by LEfSe analysis. (G) Alignment-based analysis based on the relative abundance of genera in the matched specimens of outer tumor tissues and normal adjacent tissues. Significantly different genera are marked with blue (for normal adjacent tissues) and red (outer tumor tissues).
Figure 2
Figure 2
Microbiome analysis between different spatial features of the tumors. (A) Box plot of the alpha diversity of outer and inner tumor tissues, shown by Shannon index. The horizontal bars within boxes represent medians. The tops and bottoms of boxes represent the 75th and 25th percentiles, respectively. (B) Principal coordinate analysis (PCoA) of outer tumor tissues and normal adjacent tissues based on Bray-Curtis distance. The dots represent the specimens, and the circles represent the microbial community associated with the outer tumor tissues (light orange) and normal adjacent tissues (dark orange). (C, D) The microbial composition of the outer tumor tissues and inner tissues. C = phylum level and D = genera level. (E) Significantly different bacteria in two groups as determined by LEfSe analysis. (F) Alignment-based analysis based on the relative abundance of genera in the matched specimens of outer and inner tumor tissues. Significantly different genera are marked with dark orange (inner tumor tissues) and light orange (outer tumor tissues).
Figure 3
Figure 3
Microbiome analysis between different T-stages, N-stages, and ENE status. (A–C) Box plot of the alpha diversity of outer tumor tissues between T1/T2-stage and T3/T4-stage, between lymphatic metastasis and non-lymphatic metastasis, and between ENE- and ENE+ shown by Shannon index. The horizontal bars within boxes represent medians. The tops and bottoms of boxes represent the 75th and 25th percentiles, respectively. (D–F) Principal coordinate analysis (PCoA) of outer tumor tissues and normal adjacent tissues based on Bray-Curtis distance. The dots represent the specimens, and the circles represent the microbial community associated with T1/T2-stage (light purple) and T3/T4-stage (dark purple) in (D), lymphatic metastasis (dark green) and non-lymphatic metastasis (light green) in (E), ENE-(light pink) and ENE+ (pink) in (F–I) The microbial composition of different groups at the genera level. (J–L) Significantly different bacteria in the two groups as determined by LEfSe analysis.

Similar articles

Cited by

References

    1. Bankfalvi A., Piffko J. (2000). Prognostic and predictive factors in oral cancer: The role of the invasive tumour front. J. Oral. Pathol. Med. 29 (7), 291–298. doi: 10.1034/j.1600-0714.2000.290701.x - DOI - PubMed
    1. Bharucha T., Oeser C., Balloux F., Brown J. R., Carbo E. C., Charlett A., et al. . (2020). STROBE-metagenomics: A STROBE extension statement to guide the reporting of metagenomics studies. Lancet Infect. Dis. 20 (10), e251–e260. doi: 10.1016/S1473-3099(20)30199-7 - DOI - PMC - PubMed
    1. Callahan B. J., McMurdie P. J., Rosen M. J., Han A. W., Johnson A. J. A., Holmes S. P. (2016). DADA2: High-resolution sample inference from illumina amplicon data. Nat. Methods 13 (7), 581–583. doi: 10.1038/nmeth.3869 - DOI - PMC - PubMed
    1. Castellarin M., Warren R. L., Freeman J. D., Dreolini L., Krzywinski M., Strauss J., et al. . (2012). Fusobacterium nucleatum infection is prevalent in human colorectal carcinoma. Genome Res. 22 (2), 299–306. doi: 10.1101/gr.126516.111 - DOI - PMC - PubMed
    1. Chen Z., Wong P. Y., Ng C. W. K., Lan L., Fung S., Li J. W., et al. . (2020). The intersection between oral microbiota, host gene methylation and patient outcomes in head and neck squamous cell carcinoma. Cancers 12 (11), 3425. doi: 10.3390/cancers12113425 - DOI - PMC - PubMed

Publication types

Substances