

Tubulin polyglutamylation differentially regulates microtubule-interacting proteins
- PMID: 36636822
- PMCID: PMC9975938
- DOI: 10.15252/embj.2022112101
Tubulin polyglutamylation differentially regulates microtubule-interacting proteins
Abstract
Tubulin posttranslational modifications have been predicted to control cytoskeletal functions by coordinating the molecular interactions between microtubules and their associating proteins. A prominent tubulin modification in neurons is polyglutamylation, the deregulation of which causes neurodegeneration. Yet, the underlying molecular mechanisms have remained elusive. Here, using in-vitro reconstitution, we determine how polyglutamylation generated by the two predominant neuronal polyglutamylases, TTLL1 and TTLL7, specifically modulates the activities of three major microtubule interactors: the microtubule-associated protein Tau, the microtubule-severing enzyme katanin and the molecular motor kinesin-1. We demonstrate that the unique modification patterns generated by TTLL1 and TTLL7 differentially impact those three effector proteins, thus allowing for their selective regulation. Given that our experiments were performed with brain tubulin from mouse models in which physiological levels and patterns of polyglutamylation were altered by the genetic knockout of the main modifying enzymes, our quantitative measurements provide direct mechanistic insight into how polyglutamylation could selectively control microtubule interactions in neurons.
Keywords: katanin; kinesin-1; microtubule-associated Tau; microtubules; polyglutamylation; tubulin posttranslational modifications.
© 2023 The Authors. Published under the terms of the CC BY NC ND 4.0 license.
Figures
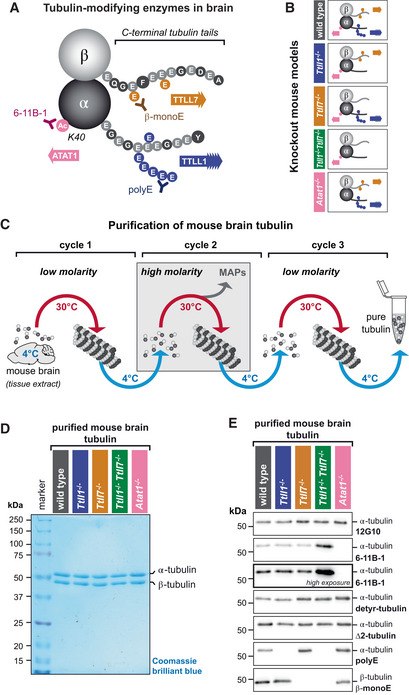
Schematic representation of the tubulin PTMs acetylation and polyglutamylation, both highly enriched on brain tubulin. The acetylation of α‐tubulin at lysine‐40 (K40) is catalysed by ATAT1 and is detected by the 6‐11B‐1 antibody (Appendix Table S2). Polyglutamylation takes place within the C‐terminal tubulin tails of both α‐ and β‐tubulin and is catalysed by TTLL1 and TTLL7, respectively. Glutamate chains of longer than three residues, predominantly found on α‐tubulin, are specifically detected by polyE antibody, while a β‐tubulin‐specific monoglutamylation at amino acid residue 435 (β2‐tubulin) is detected by β‐monoE antibody (Bodakuntla et al, ; Appendix Table S2).
Overview of the PTM patterns of tubulin purified from knockout mouse models used in this study (Bodakuntla et al, 2021).
Schematic overview of the tubulin purification pipeline from mouse brains using three cycles of temperature‐induced polymerisation‐depolymerisation, including a polymerisation step in high molarity buffer to remove microtubule‐associated proteins.
SDS‐PAGE analysis of purified tubulin from brains of all mouse models used in the current study, stained with Coomassie brilliant blue. Alpha‐ and β‐tubulin are separated using a specific SDS‐PAGE protocol (Souphron et al, 2019).
Immunoblot analysis of all purified tubulin variants. The molecular weight in (D) and (E) is indicated in kDa.
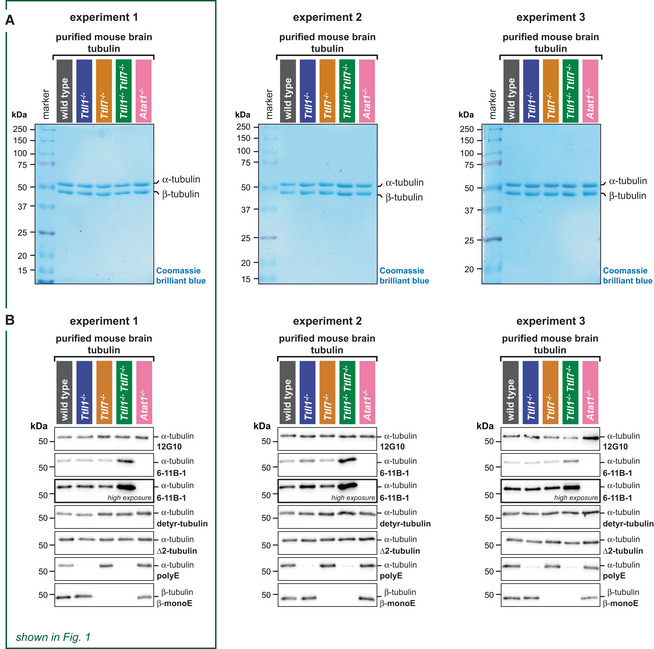
Direct comparison of SDS‐PAGE analysis of purified tubulin from brains of all mouse models in three independent experiments, stained with Coomassie brilliant blue. Alpha‐ and β‐tubulin are separated using a specific SDS‐PAGE protocol (Souphron et al, 2019). Experiment 1 is also shown in Fig 1D.
Direct comparison of immunoblot analyses of all purified tubulin variants from three independent experiments. Experiment 1 is also shown in Fig 1E. The molecular weight in (A) and (B) is indicated in kDa. Source data are available.
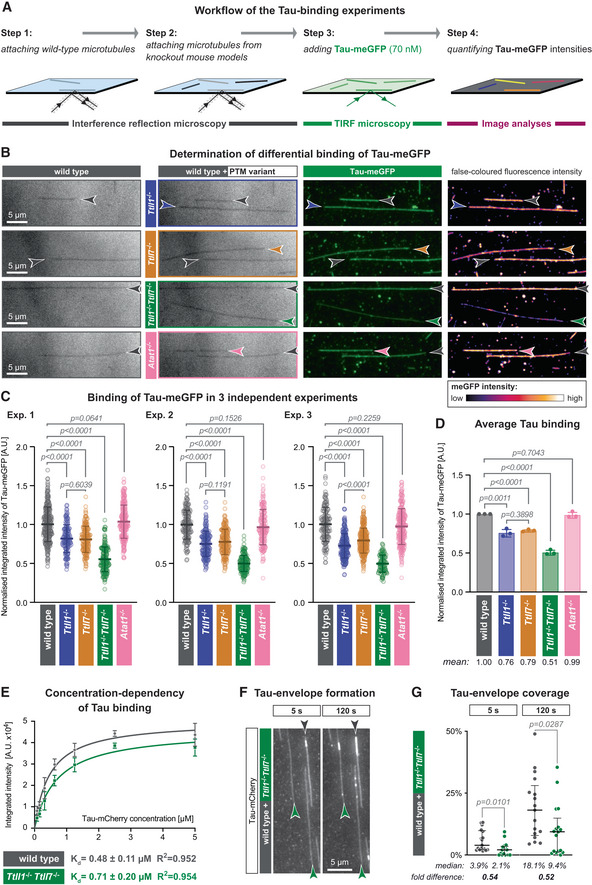
Schematic representation of the TIRF microscopy assay setup. Label‐free GMPCPP‐stabilised microtubules, polymerised from wild‐type and knockout‐mouse brain tubulin, are attached to a glass coverslip chamber sequentially and imaged in IRM mode. Their identity is retained by their positions on the coverslip (Steps 1 and 2). Next, 70 nM purified Tau‐meGFP is added to the chamber and its microtubule binding recorded in TIRF microscopy mode (Step 3). The fluorescence intensity of Tau‐meGFP on each microtubule in the chamber is measured in the subsequent affinity analysis (Step 4).
Representative IRM and TIRF microscopy images showing microtubule positions and Tau‐meGFP intensities for different PTM variants (grey: wild type; blue: Ttll1 −/−; yellow: Ttll7 −/−; green: Ttll1 −/− Ttll7 −/−; pink: Atat1 −/−). In the last column, false‐coloured TIRF images highlight differences in Tau‐meGFP intensities on different types of microtubules (Movie EV1). Scale bars 5 μm.
Quantification of the integrated intensity of Tau‐meGFP on GMPCPP microtubules in three independent sets of experiments performed with independently purified tubulin samples. Single assays (Fig EV2A) of one experiment were combined after normalisation to the wild‐type microtubule values (A.U., arbitrary units). Each data point represents the normalised fluorescence intensity value of one microtubule. Mean values and standard deviation are shown for each scatter plot. Student's t‐test; P‐values displayed.
Summary quantification of the three independent experiments shown in (C). Each point is a normalised mean of the triplicates, and error bars represent standard deviation. Student's t‐test; P‐values displayed.
Saturation curve of increasing concentration Tau‐mCherry binding to GMPCPP wild‐type and Ttll1 −/− Ttll7 −/− microtubules. Each data point is shown as mean ± standard deviation of the raw integrated intensity values (A.U. × 104) of three experiments with independently purified tubulin samples (Fig EV2D). Dissociation constants K d and R 2 coefficient from non‐linear fits of each microtubule type are indicated below the plot.
Tau‐envelope formation on Taxol‐stabilised wild‐type and Ttll1 −/− Ttll7 −/− microtubules (grey and green arrowheads, respectively) 5 and 120 s after the addition of 40 nM Tau‐mCherry to the TIRF microscopy flow‐chamber (Movie EV2). Scale bars 5 μm.
Analysis of percentage total microtubule length in the flow‐chamber covered by Tau envelopes. Pooled data points from three experiments (each data point represents tau coverage of microtubules within one field of view) with medians and interquartile ranges represented. Mann–Whitney test, P‐values displayed.
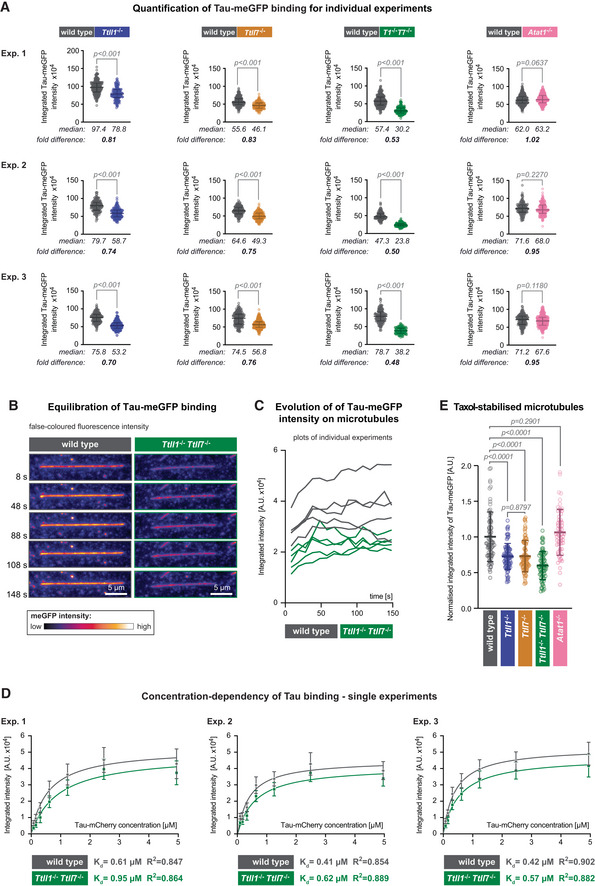
Quantification of the integrated intensity of Tau‐meGFP on GMPCPP microtubules shown for the single assays that were combined in Fig 2C after normalisation to the median values measured on wild‐type microtubules. Three independent sets of experiments were performed with independently purified tubulin samples. Each data point represents the quantification of one microtubule. Median values and interquartile ranges are shown for each scatter plot. Mann–Whitney test, P‐values displayed.
Representative still images from a time lapse of Tau‐meGFP binding to GMPCPP microtubules. The images are false coloured to better reveal the intensity evolution over time. Scale bars 5 μm.
Raw integrated intensity values (A.U. × 104) of Tau‐meGFP binding to GMPCPP wild‐type and Ttll1 −/− Ttll7 −/− microtubules over a 150 s time interval (data points every 10 s). For each type 5 microtubules from the same assay were analysed.
Saturation curves from individual experiments with microtubules from independently purified tubulin samples. Increasing concentration Tau‐mCherry binding to GMPCPP wild‐type and Ttll1 −/− Ttll7 −/− microtubules were quantified in one assay with each of the shown concentrations per experiment. Each data point is a mean (±standard deviation) of the raw integrated intensity values of single microtubules for the respective concentration (A.U. × 104). The derived dissociation constants K d and R 2 coefficient from the nonlinear fit for each microtubule type are indicated below the plots. The means of the three independent experiments shown here are combined in Fig 2E.
Quantification of normalised integrated intensity of Tau‐meGFP fluorescent intensity on Taxol‐stabilised microtubules. Data of individual assays were normalised to mean values from wild‐type microtubules, and then combined as in Fig 2C. Each data point represents a single microtubule measurement from one experiment (n = 57–80 microtubules). Scatter plots with mean values (A.U.) and standard deviation. Student's t‐test, P‐values are shown.
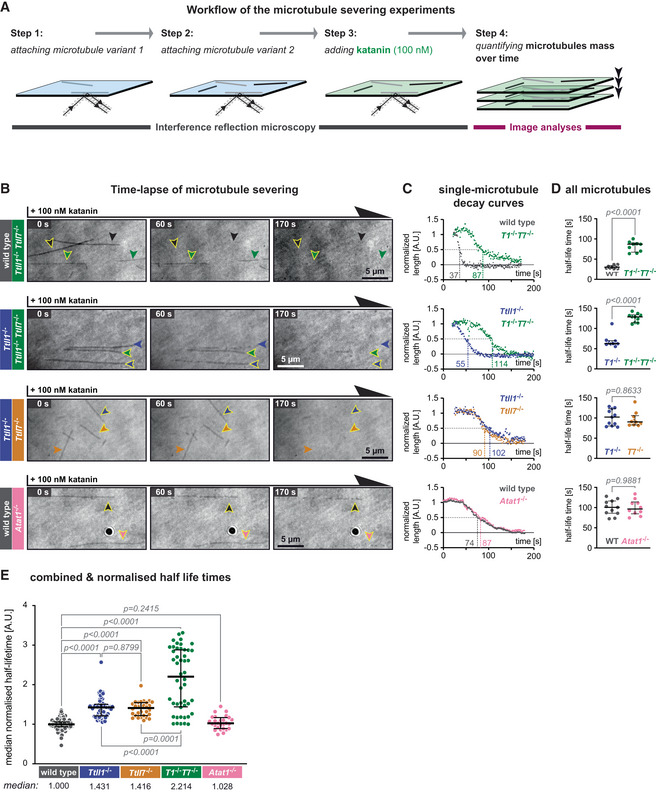
Schematic representation of the katanin severing assay. Label‐free Taxol‐stabilised microtubules, polymerised from wild‐type and knockout‐mouse brain tubulin, are attached to a glass coverslip sequentially and imaged in IRM mode. Their identity is retained by their positions at the coverslip (Steps 1 and 2). Next, 100 nM purified p60/p80 katanin complex is added to the chamber (Step 3). The change in the microtubule length over time is recorded in IRM and quantified in subsequent analyses (Step 4).
Representative IRM still images at different time points from time‐lapse following the addition of 100 nM p60/p80 katanin complex on microtubules (Movie EV3). Arrowheads indicate microtubules of a certain type (colour‐coded, as labels on the left). Scale bars 5 μm.
Decay curves of normalised microtubule length plotted against time upon incubation with katanin (A.U., arbitrary units) for single microtubules highlighted by arrow heads with yellow borders in (B).
Half‐life times (seconds) of all microtubules from the assays of which representative images are displayed in (B) and representative decay curves are shown in (C). Each data point represents the half‐life of a single microtubule. Medians with interquartile ranges are shown. Mann–Whitney test, P‐values displayed.
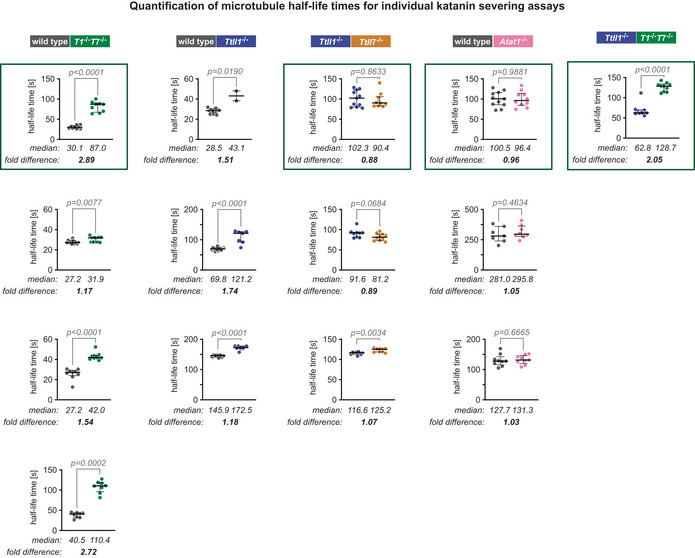
Analysis of normalised microtubule half‐lifetimes from 14 independent experiments (Fig EV3). Each data point represents half‐life of a single microtubule. Medians with interquartile ranges shown, Mann–Whitney test and P‐values displayed.
- A
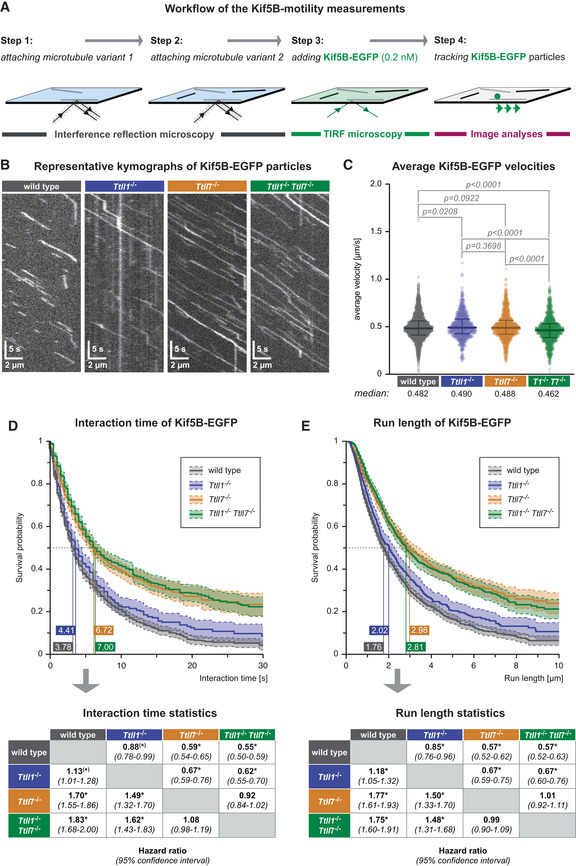
Schematic representation of the single‐molecule kinesin‐1 motility assay. Taxol‐stabilised microtubules of two different types are subsequently attached in the flow‐chamber (Steps 1, 2), 0.2 nM Kif5b‐EGFP are added, the motility of single kinesin motors recorded in TIRF microscopy (Step 3) and subsequently analysed (Step 4).
- B
Kymographs showing single Kif5B‐EGFP motor molecules moving on one single microtubule of known PTM state (Movie EV4). Horizontal scale bars 2 μm; vertical scale bars 5 s.
- C
Scatter plots showing the average velocities (μm/s) exhibited by single Kif5b‐EGFP molecules on the different microtubule types (each data point represents one Kif5b‐EGFP molecule). Data pooled from 29 independent experiments (Appendix Fig S2). Medians with interquartile ranges shown, Mann–Whitney test and p‐values displayed.
- D, E
Survival probability (Kaplan–Meier plots, taking varying microtubule lengths into account; see Materials and Methods) of the interaction time (D) and run length (E) of Kif5b‐EGFP molecules on different microtubule types. Data in (C–E) were pooled from individual experiments (Appendix Fig S2) without normalisation. The 50% probability values are shown in the plots. Statistical analysis displayed in the tables below: hazard ratios with 95% confidence intervals pairing all data from different microtubule types (*pairs differing with significance level P < 0.05).
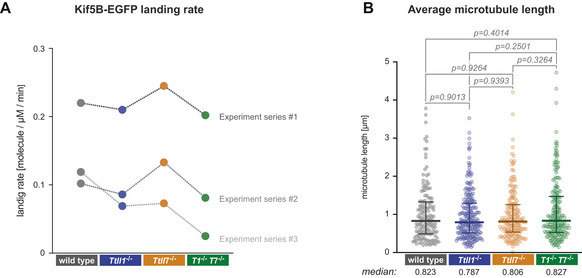
Comparison of the Kif5B‐EGFP landing rates in three independent sets of experiments. Landing rates were calculated by summing up the total number of single‐molecule Kif5B‐EGFP landing events on microtubules relative to the total (summed up) length of microtubules in the field of view and the observation time. Note that landing rates differ between different sets of experiments, but are mostly similar for different PTM subtypes of microtubules within all experimental sets.
Median microtubule length (each data point represents one microtubule) determined from all microtubules observed in three independent sets of experiments. Medians with interquartile ranges shown, Mann–Whitney test and P‐values displayed.
References
-
- Bodakuntla S, Schnitzler A, Villablanca C, Gonzalez‐Billault C, Bieche I, Janke C, Magiera MM (2020b) Tubulin polyglutamylation is a general traffic‐control mechanism in hippocampal neurons. J Cell Sci 133: jcs241802 - PubMed
Publication types
MeSH terms
Substances
LinkOut - more resources
Full Text Sources
Molecular Biology Databases
