

Association between body mass index, weight loss and the chance of pregnancy in women with polycystic ovary syndrome and overweight or obesity: a retrospective cohort study in the UK
- PMID: 36637246
- PMCID: PMC9977115
- DOI: 10.1093/humrep/deac267
Association between body mass index, weight loss and the chance of pregnancy in women with polycystic ovary syndrome and overweight or obesity: a retrospective cohort study in the UK
Erratum in
-
Correction to: Association between body mass index, weight loss and the chance of pregnancy in women with polycystic ovary syndrome and overweight or obesity: a retrospective cohort study in the UK.Hum Reprod. 2023 Apr 3;38(4):776. doi: 10.1093/humrep/dead037. Hum Reprod. 2023. PMID: 36869736 Free PMC article. No abstract available.
Abstract
Study question: What are the associations between baseline BMI (Study 1) and change in body weight (Study 2) with the likelihood of pregnancy in women with polycystic ovary syndrome (PCOS).
Summary answer: In women with PCOS, higher baseline BMI was associated with a lower chance of pregnancy; however, weight loss was associated with an increased chance of pregnancy versus maintaining a stable weight or gaining weight.
What is known already: Two studies in large cohorts of Danish women with the intention to become pregnant showed a decline in fecundability ratios with higher BMI. Furthermore, a meta-analysis found that overweight/obesity significantly worsened metabolic and reproductive outcomes in women with PCOS.
Study design, size, duration: Data were extracted from the UK Clinical Practice Research Datalink GOLD database. Patients included women aged 18-45 years with BMI ≥18.5 (Study 1) or ≥25 kg/m2 (Study 2) at time of PCOS diagnosis (index date). The primary outcome was the time to first pregnancy recorded during 36-months' follow-up, analysed with Cox proportional hazard models and presented as hazard ratios (HRs).
Participants/materials, setting, methods: Study 1 included 9955 women with PCOS. Study 2 included 7593 women with PCOS and median BMI of 34.0 kg/m2.
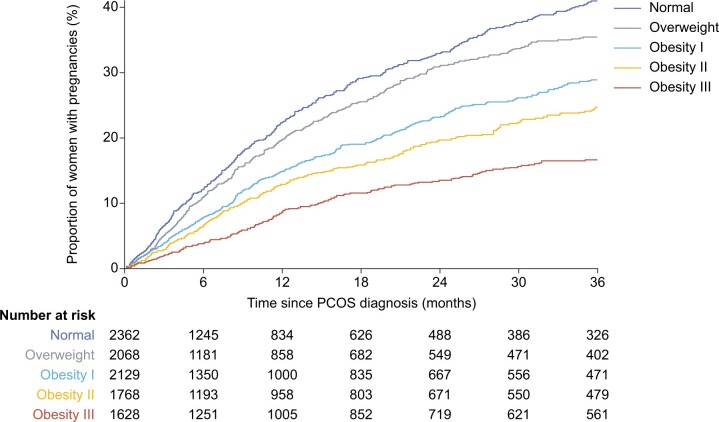
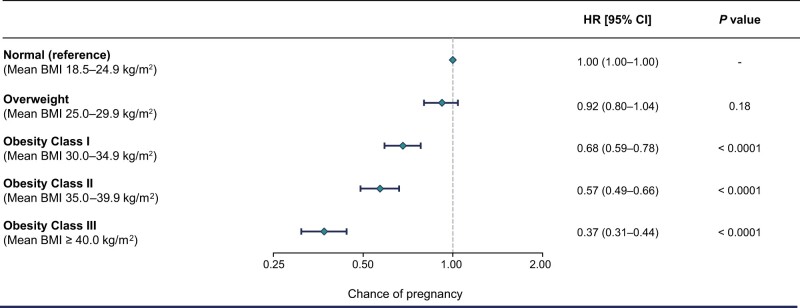
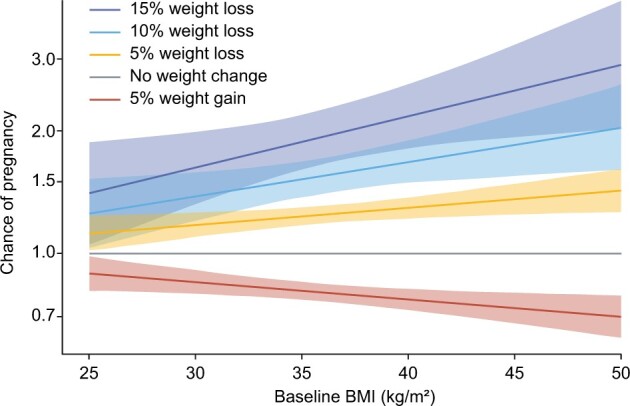
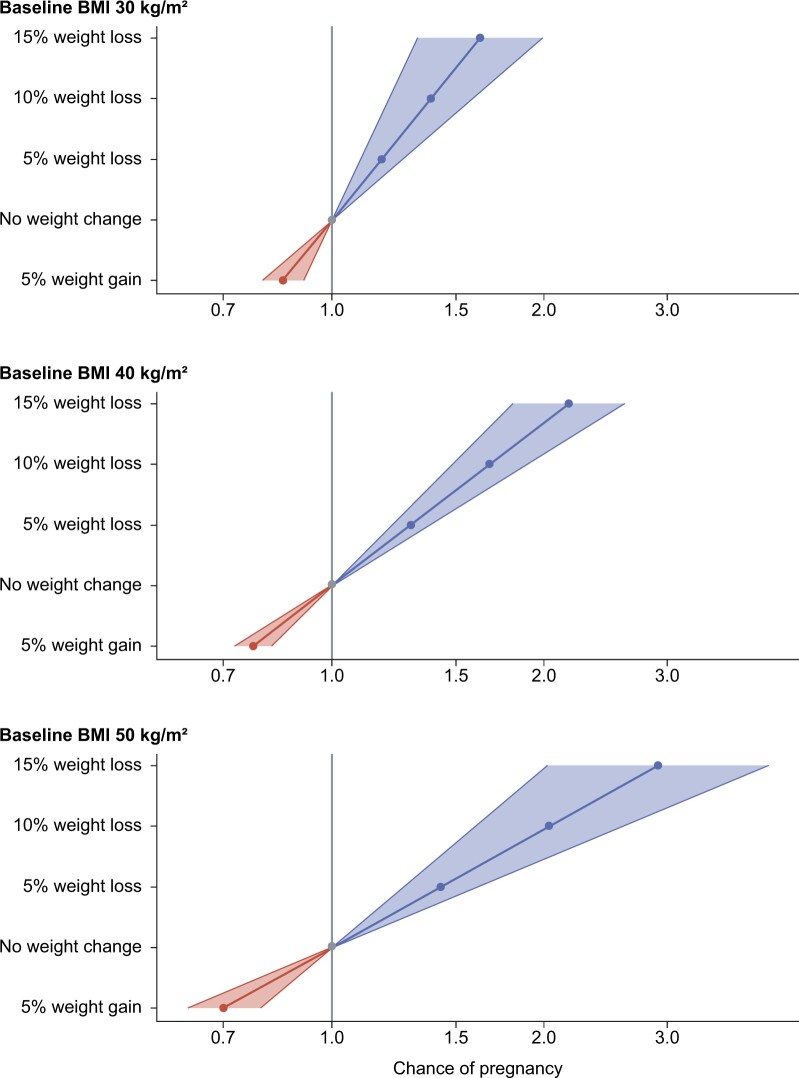
Main results and the role of chance: Higher BMI was associated with a lower chance of pregnancy in the 3 years following diagnosis. It was estimated that 41% of women with normal weight (18.5-24.9 kg/m2) would become pregnant compared to 17% of women with obesity class III (BMI ≥40.0 kg/m2) during follow-up. Furthermore, the chance of pregnancy for women with obesity class III was estimated to be 63% lower than for women with normal weight, with the same age and glycaemic status (HR 0.37, 95% CI 0.31-0.44; P < 0.0001). A significant inverse association was found between BMI change and chance of pregnancy: 10% weight loss was estimated to increase the chance of pregnancy by 68% for women with baseline BMI of 40 kg/m2 (HR 1.68, 95% CI 1.49-1.90).
Limitations, reasons for caution: Multiple factors influence the chance of pregnancy (the ability and willingness to become pregnant), which was addressed by exclusion criteria employed. The real-world nature of the study means that use of non-prescription contraceptives was not available. Bias may have been introduced by the fact that only around 40% of women with PCOS in the CPRD GOLD database had their BMI recorded during the year prior to PCOS diagnosis. BMI categories used in the analyses may not be applicable to women of all ethnicities. The study population was only representative of women in the UK and results may not be generalizable to other regions. PCOS diagnoses were based on codes entered into the system by primary care providers, and no information was available regarding the criteria used for diagnosis, although symptoms used to diagnose PCOS have not changed over time.
Wider implications of the findings: Our observations provide further evidence of the benefits of weight loss in women with overweight/obesity and PCOS who are seeking to become pregnant.
Study funding/competing interest(s): Novo Nordisk A/S. A.H.B. declares fees for consultancy from Novo Nordisk. P.N.L. and C.L.H. are employees of Novo Nordisk. V.S. and A.V. are employees of, and hold shares in, Novo Nordisk.
Trial registration number: N/A.
Keywords: BMI; cohort study; fecundity; obesity; overweight; polycystic ovary syndrome; pregnancy; weight loss.
© The Author(s) 2023. Published by Oxford University Press on behalf of European Society of Human Reproduction and Embryology.
Figures
References
-
- Bahri Khomami M, Joham AE, Boyle JA, Piltonen T, Arora C, Silagy M, Misso ML, Teede HJ, Moran LJ.. The role of maternal obesity in infant outcomes in polycystic ovary syndrome—a systematic review, meta-analysis, and meta-regression. Obes Rev 2019a;20:842–858. - PubMed
-
- Bahri Khomami M, Joham AE, Boyle JA, Piltonen T, Silagy M, Arora C, Misso ML, Teede HJ, Moran LJ.. Increased maternal pregnancy complications in polycystic ovary syndrome appear to be independent of obesity—a systematic review, meta-analysis, and meta-regression. Obes Rev 2019b;20:659–674. - PubMed
-
- Balen AH, Morley LC, Misso M, Franks S, Legro RS, Wijeyaratne CN, Stener-Victorin E, Fauser BCJM, Norman RJ, Teede H.. The management of anovulatory infertility in women with polycystic ovary syndrome: an analysis of the evidence to support the development of global WHO guidance. Hum Reprod Update 2016;22:687–708. - PubMed
-
- Best D, Avenell A, Bhattacharya S.. How effective are weight-loss interventions for improving fertility in women and men who are overweight or obese? A systematic review and meta-analysis of the evidence. Hum Reprod Update 2017;23:681–705. - PubMed
Publication types
MeSH terms
LinkOut - more resources
Full Text Sources
Medical
Research Materials
