. 2023 Jan 1;7(1):49-63.
doi: 10.4049/immunohorizons.2200092.

CD19 Is Internalized Together with IgM in Proportion to B Cell Receptor Stimulation and Is Modulated by Phosphatidylinositol 3-Kinase in Bone Marrow Immature B Cells

Affiliations

CD19 Is Internalized Together with IgM in Proportion to B Cell Receptor Stimulation and Is Modulated by Phosphatidylinositol 3-Kinase in Bone Marrow Immature B Cells

Megan R McCaleb et al. Immunohorizons. .

Abstract

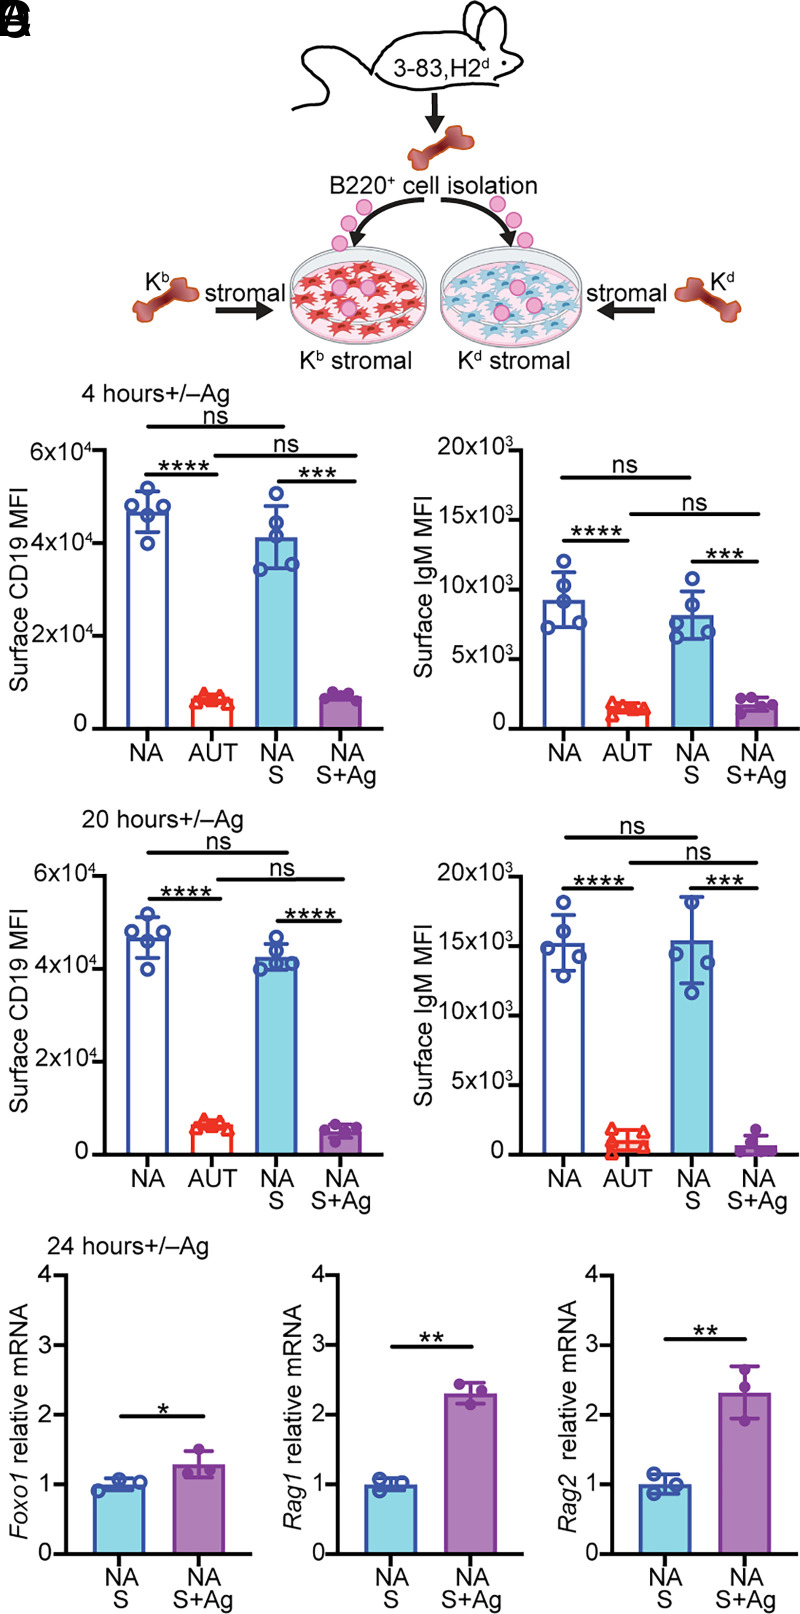
Newly generated immature B cells that bind self-antigen with high avidity arrest in differentiation and undergo central tolerance via receptor editing and clonal deletion. These autoreactive immature B cells also express low surface levels of the coreceptor CD19, a key activator of the PI3K pathway. Signals emanating from both CD19 and PI3K are known to be critical for attenuating receptor editing and selecting immature B cells into the periphery. However, the mechanisms that modulate CD19 expression at this stage of B cell development have not yet been resolved. Using in vivo and in vitro models, we demonstrate that Cd19 de novo gene transcription and translation do not significantly contribute to the differences in CD19 surface expression in mouse autoreactive and nonautoreactive immature B cells. Instead, CD19 downregulation is induced by BCR stimulation in proportion to BCR engagement, and the remaining surface IgM and CD19 molecules promote intracellular PI3K-AKT activity in proportion to their level of expression. The internalized CD19 is degraded with IgM by the lysosome, but inhibiting lysosome-mediated protein degradation only slightly improves surface CD19. In fact, CD19 is restored only upon Ag removal. Our data also reveal that the PI3K-AKT pathway positively modulates CD19 surface expression in immature B cells via a mechanism that is independent of inhibition of FOXO1 and its role on Cd19 gene transcription while is dependent on mTORC1.


Conflict of interest statement

The authors have no financial conflicts of interest.

Figures

FIGURE 1. Surface CD19 is downmodulated in BCR-stimulated immature B cells independently of Cd19 gene transcription and splicing. (A) Mean ± SD of surface CD19 fluorescence intensity (MFI) on B220+CD24highCD23− bone marrow immature B cells from 3-83Igi,H-2b autoreactive (AUT; red) and 3-83Igi,H-2d nonautoreactive (NA; blue) mice (gating strategy of immature B cells is shown in Supplemental Fig. 1A). n = 5 mice/group in five independent experiments; p values were calculated by Mann–Whitney U test. (B) Relative Cd19 mRNA levels (mean ± SD) in B220+IgD− bone marrow cells of NA (n = 3) and AUT (n = 3) 3-83Igi mice and one WT CB17 mouse control. Cells were isolated from the mice in three independent experiments, and all samples were run by RT-PCR at the same time to minimize technical variations. Cd19 mRNA was normalized to Cd79b mRNA in each sample, and the normalized Cd19 mRNA levels are expressed as fold change over the average Cd19 mRNA levels in NA cells. The p values were calculated using a Mann–Whitney U test. (C) Left, Schematic of the mouse Cd19 genomic and mRNA structures (in scale), indicating the location of the primers used to amplify exons 1–7 and 7–14. (C) Right, Agarose gel analysis of Cd19 mRNA exons 1–7 and 7–14 amplified on cDNA from B220+IgD− bone marrow cells of AUT (H-2b; n = 2) and NA (H-2d; n = 3) 3-83Igi mice and one WT control mouse. (D) Mean MFI ± SD of surface CD19 and IgM of immature B cells from 3-83Igi,H-2d NA mice (n = 5) after 20 h of culture with or without (i.e., PBS) 10 μg/ml of anti-3-83Ig S23 antibodies and relative to immature B cells from 3-83Igi,H-2b AUT mice (n = 5). Data are from five experiments, and p values were calculated using a paired t test for the NA mice and an unpaired t test for AUT mice. (E) Relative surface CD19 and Igκ on B220+CD24highCD2+CD23−IgD−Igκ+ immature B cells from WT CB17 mice (n = 5, analyzed in four independent experiments) after 20 h of culture with 5 μg/ml of anti-IgM F(ab’)2 antibodies relative to control with PBS. Relative MFI (rMFI) data were calculated by dividing the MFI of cells treated with anti-IgM for each individual mouse by the average MFI of cells treated with PBS. The p values were calculated using a paired t test. In all bar graphs, **p ≤ 0.01, ***p ≤ 0.001, ****p ≤ 0.0001.
FIGURE 1.
Surface CD19 is downmodulated in BCR-stimulated immature B cells independently of Cd19 gene transcription and splicing. (A) Mean ± SD of surface CD19 fluorescence intensity (MFI) on B220+CD24highCD23 bone marrow immature B cells from 3-83Igi,H-2b autoreactive (AUT; red) and 3-83Igi,H-2d nonautoreactive (NA; blue) mice (gating strategy of immature B cells is shown in Supplemental Fig. 1A). n = 5 mice/group in five independent experiments; p values were calculated by Mann–Whitney U test. (B) Relative Cd19 mRNA levels (mean ± SD) in B220+IgD bone marrow cells of NA (n = 3) and AUT (n = 3) 3-83Igi mice and one WT CB17 mouse control. Cells were isolated from the mice in three independent experiments, and all samples were run by RT-PCR at the same time to minimize technical variations. Cd19 mRNA was normalized to Cd79b mRNA in each sample, and the normalized Cd19 mRNA levels are expressed as fold change over the average Cd19 mRNA levels in NA cells. The p values were calculated using a Mann–Whitney U test. (C) Left, Schematic of the mouse Cd19 genomic and mRNA structures (in scale), indicating the location of the primers used to amplify exons 1–7 and 7–14. (C) Right, Agarose gel analysis of Cd19 mRNA exons 1–7 and 7–14 amplified on cDNA from B220+IgD bone marrow cells of AUT (H-2b; n = 2) and NA (H-2d; n = 3) 3-83Igi mice and one WT control mouse. (D) Mean MFI ± SD of surface CD19 and IgM of immature B cells from 3-83Igi,H-2d NA mice (n = 5) after 20 h of culture with or without (i.e., PBS) 10 μg/ml of anti-3-83Ig S23 antibodies and relative to immature B cells from 3-83Igi,H-2b AUT mice (n = 5). Data are from five experiments, and p values were calculated using a paired t test for the NA mice and an unpaired t test for AUT mice. (E) Relative surface CD19 and Igκ on B220+CD24highCD2+CD23IgDIgκ+ immature B cells from WT CB17 mice (n = 5, analyzed in four independent experiments) after 20 h of culture with 5 μg/ml of anti-IgM F(ab’)2 antibodies relative to control with PBS. Relative MFI (rMFI) data were calculated by dividing the MFI of cells treated with anti-IgM for each individual mouse by the average MFI of cells treated with PBS. The p values were calculated using a paired t test. In all bar graphs, **p ≤ 0.01, ***p ≤ 0.001, ****p ≤ 0.0001.
FIGURE 2. Stronger BCR stimulation induces larger CD19 downregulation and correlates with markers of receptor editing. (A) Schematic of stromal Ag stimulation of bone marrow B cells from 3-83Igi,H-2d nonautoreactive (NA) mice. Mean MFI ± SD of surface CD19 and IgM on B220+CD24highCD23− immature B cells (gated as in Supplemental Fig. 1A) from NA mice, cultured for 4 h (B) or 20 h (C) on stromal cell layers expressing either Kb (NA+S+Ag) or Kd (NA+S) and from ex vivo 3-83Igi autoreactive (AUT) and NA immature B cells (n = 5 mice/group in five independent experiments). (D) Relative Foxo1, Rag1, and Rag2 mRNA levels (mean ± SD) in NA B220+ cells (n = 3 in two experiments) cultured for 24 h over Kb or Kd stromal cell layers. Normalized mRNA levels are expressed as fold change over the average mRNA levels of NA cells cultured on Kd stromal cell layer. The p values in all bar graphs were calculated using a paired t test for all comparisons, except when compared with AUT ex vivo cells in (C), in which an unpaired t test was used. In all bar graphs, *p ≤ 0.05, **p ≤ 0.01, ***p ≤ 0.001, ****p ≤ 0.0001.
FIGURE 2.
Stronger BCR stimulation induces larger CD19 downregulation and correlates with markers of receptor editing. (A) Schematic of stromal Ag stimulation of bone marrow B cells from 3-83Igi,H-2d nonautoreactive (NA) mice. Mean MFI ± SD of surface CD19 and IgM on B220+CD24highCD23 immature B cells (gated as in Supplemental Fig. 1A) from NA mice, cultured for 4 h (B) or 20 h (C) on stromal cell layers expressing either Kb (NA+S+Ag) or Kd (NA+S) and from ex vivo 3-83Igi autoreactive (AUT) and NA immature B cells (n = 5 mice/group in five independent experiments). (D) Relative Foxo1, Rag1, and Rag2 mRNA levels (mean ± SD) in NA B220+ cells (n = 3 in two experiments) cultured for 24 h over Kb or Kd stromal cell layers. Normalized mRNA levels are expressed as fold change over the average mRNA levels of NA cells cultured on Kd stromal cell layer. The p values in all bar graphs were calculated using a paired t test for all comparisons, except when compared with AUT ex vivo cells in (C), in which an unpaired t test was used. In all bar graphs, *p ≤ 0.05, **p ≤ 0.01, ***p ≤ 0.001, ****p ≤ 0.0001.
FIGURE 3. Surface CD19 molecules that internalize following BCR stimulation are degraded by the lysosome and not the proteasome. (A) Mean ± SD of intracellular CD19 and total Igκ MFIs (representative flow cytometry is shown in Supplemental Fig. 2B) in 3-83Igi nonautoreactive (NA) B220+CD24highCD23− immature B cells cultured for 20 h on Kb or Kd stromal cell layers and in ex vivo autoreactive (AUT) and NA immature B cells. Intracellular CD19 was stained separately from the surface pool by using the same anti-CD19 mAb in different colors. n = 4 mice/group analyzed in four independent experiments. The p values were calculated using a paired t test for all comparisons, except when compared with AUT ex vivo, in which an unpaired t test was used. (B) Mean ± SD of surface and intracellular CD19 and of surface IgM and total (surface plus intracellular) Igκ (analyzed as shown in Supplemental Fig. 2B) in B220+CD24highCD23− NA immature B cells cultured for 24 h with 2 μM of the translation inhibitor cycloheximide (CHX) or DMSO control. Relative MFI (rMFI) data are from n = 6 mice analyzed in four independent experiments and are expressed for each sample as fold change over cells treated with DMSO. The p values were calculated using a one-sample t test. Mean ± SD of intracellular CD19 and total Igκ MFIs in 3-83Igi,H-2b AUT B220+CD24highCD23− immature B cells cultured for 24 h with 0.5 μM of the proteasome inhibitor bortezomib (BZ) (C), 12 nM of the lysosome inhibitor bafilomycin (BAF) (D), or DMSO control (C and D). NA cells cultured with DMSO are included in (D). n = 5 mice/group from five independent experiments. The p values were calculated using a paired t test, except when AUT cells were compared with NA cells, in which case an unpaired t test was used. (E) Mean ± SD of intracellular CD19 and total Igκ MFIs in NA B220+CD24highCD23− immature B cells cultured first with or without 10 μg/ml S23 Ab for 4 h and then also with 12 nM bafilomycin or DMSO control for an additional 20 h. n = 5 mice from five independent experiments. The p values were calculated using a paired t test. In all bar graphs, *p ≤ 0.05, **p ≤ 0.01, ***p ≤ 0.001, ****p ≤ 0.0001.
FIGURE 3.
Surface CD19 molecules that internalize following BCR stimulation are degraded by the lysosome and not the proteasome. (A) Mean ± SD of intracellular CD19 and total Igκ MFIs (representative flow cytometry is shown in Supplemental Fig. 2B) in 3-83Igi nonautoreactive (NA) B220+CD24highCD23 immature B cells cultured for 20 h on Kb or Kd stromal cell layers and in ex vivo autoreactive (AUT) and NA immature B cells. Intracellular CD19 was stained separately from the surface pool by using the same anti-CD19 mAb in different colors. n = 4 mice/group analyzed in four independent experiments. The p values were calculated using a paired t test for all comparisons, except when compared with AUT ex vivo, in which an unpaired t test was used. (B) Mean ± SD of surface and intracellular CD19 and of surface IgM and total (surface plus intracellular) Igκ (analyzed as shown in Supplemental Fig. 2B) in B220+CD24highCD23 NA immature B cells cultured for 24 h with 2 μM of the translation inhibitor cycloheximide (CHX) or DMSO control. Relative MFI (rMFI) data are from n = 6 mice analyzed in four independent experiments and are expressed for each sample as fold change over cells treated with DMSO. The p values were calculated using a one-sample t test. Mean ± SD of intracellular CD19 and total Igκ MFIs in 3-83Igi,H-2b AUT B220+CD24highCD23 immature B cells cultured for 24 h with 0.5 μM of the proteasome inhibitor bortezomib (BZ) (C), 12 nM of the lysosome inhibitor bafilomycin (BAF) (D), or DMSO control (C and D). NA cells cultured with DMSO are included in (D). n = 5 mice/group from five independent experiments. The p values were calculated using a paired t test, except when AUT cells were compared with NA cells, in which case an unpaired t test was used. (E) Mean ± SD of intracellular CD19 and total Igκ MFIs in NA B220+CD24highCD23 immature B cells cultured first with or without 10 μg/ml S23 Ab for 4 h and then also with 12 nM bafilomycin or DMSO control for an additional 20 h. n = 5 mice from five independent experiments. The p values were calculated using a paired t test. In all bar graphs, *p ≤ 0.05, **p ≤ 0.01, ***p ≤ 0.001, ****p ≤ 0.0001.
FIGURE 4. Blocking lysosomal degradation does not fully restore surface CD19 in BCR-stimulated immature B cells. (A) Mean ± SD of surface CD19 and IgM on 3-83Igi,H-2b autoreactive (AUT) B220+CD24highCD23− immature B cells cultured for 24 h with 12 nM bafilomycin (BAF) or DMSO control and in nonautoreactive (NA) immature B cells cultured with DMSO. n = 5 mice analyzed in five independent experiments. The p values were calculated using a paired t test, except when compared with NA plus DMSO cells, in which case an unpaired t test was used. (B) Mean ± SD of surface CD19 and IgM in B220+CD24highCD23− NA immature B cells cultured first with or without 10 μg/ml S23 Ab for 4 h and then also with 12 nM bafilomycin or DMSO control for an additional 20 h. n = 5 mice analyzed in five independent experiments. The p values were calculated using a paired t test. (C) Relative mean ± SD of intracellular CD19, surface CD19, total (surface plus intracellular) Igκ, and surface IgM relative MFI (rMFI) (analyzed as shown in Supplemental Fig. 2B) measured in AUT (left) and NA (right) B220+CD24highCD23− immature B cells in culture and treated as indicated in (A) and (B). Data from n = 5 mice/group analyzed in five independent experiments are expressed as fold change over NA cells treated with DMSO (represented with a dashed blue line) in each individual experiment. The p values for differences between each experimental AUT or NA group and control NA plus DMSO samples were calculated using a one-sample t test and are displayed above each bar. The p values for differences between two AUT or two NA experimental groups were calculated using a paired t test and are displayed on top of lines. In all bar graphs, *p ≤ 0.05, **p ≤ 0.01, ***p ≤ 0.001, **** p ≤ 0.0001.
FIGURE 4.
Blocking lysosomal degradation does not fully restore surface CD19 in BCR-stimulated immature B cells. (A) Mean ± SD of surface CD19 and IgM on 3-83Igi,H-2b autoreactive (AUT) B220+CD24highCD23 immature B cells cultured for 24 h with 12 nM bafilomycin (BAF) or DMSO control and in nonautoreactive (NA) immature B cells cultured with DMSO. n = 5 mice analyzed in five independent experiments. The p values were calculated using a paired t test, except when compared with NA plus DMSO cells, in which case an unpaired t test was used. (B) Mean ± SD of surface CD19 and IgM in B220+CD24highCD23 NA immature B cells cultured first with or without 10 μg/ml S23 Ab for 4 h and then also with 12 nM bafilomycin or DMSO control for an additional 20 h. n = 5 mice analyzed in five independent experiments. The p values were calculated using a paired t test. (C) Relative mean ± SD of intracellular CD19, surface CD19, total (surface plus intracellular) Igκ, and surface IgM relative MFI (rMFI) (analyzed as shown in Supplemental Fig. 2B) measured in AUT (left) and NA (right) B220+CD24highCD23 immature B cells in culture and treated as indicated in (A) and (B). Data from n = 5 mice/group analyzed in five independent experiments are expressed as fold change over NA cells treated with DMSO (represented with a dashed blue line) in each individual experiment. The p values for differences between each experimental AUT or NA group and control NA plus DMSO samples were calculated using a one-sample t test and are displayed above each bar. The p values for differences between two AUT or two NA experimental groups were calculated using a paired t test and are displayed on top of lines. In all bar graphs, *p ≤ 0.05, **p ≤ 0.01, ***p ≤ 0.001, **** p ≤ 0.0001.
FIGURE 5. Expression of surface CD19 correlates with IgM and p-AKT. (A) Kinetics of surface IgM and CD19 on 3-83Igi,H-2d nonautoreactive (NA) B220+CD24highCD23− immature B cells that were treated with 10 μg/ml of S23 Ab for indicated times. (B) Kinetics of surface Igκ downregulation in immature B cells from BL/6 wild-type (WT) and CD19 knockout (KO) mice. Surface Igκ was measured on B220+CD24highCD23−IgD− immature B cells cultured for indicated times with 5 μg/ml of anti-IgM F(ab’)2 antibodies. Data in (A) and (B) are mean ± SD from n = 3 mice/group in three independent experiments and are expressed as fold change MFI of cells treated with stimulating Ab over cells treated with PBS for each mouse at the same time point. The p values indicate differences in the kinetics of downregulation of IgM and CD19 in (A) and of Igκ between the two strains in (B) and were calculated using an unpaired t test that compared the proportion of downregulation between the two groups during each time segment. (C) Bone marrow B cells from NA (H-2d) mice (n = 3 mice in three experiments) were cultured for 4 h on Kb stromal cell layers (NA+S+Ag) and then without stromal for an additional 20 h of culture (NA+S+Ag+OFF). Bar graphs display surface CD19 and IgM MFIs (mean ± SD) from B220+CD24highCD23− immature B cells cultured on Kb relative to control cells cultured without Ag (i.e., on Kd stromal), the latter being represented by a blue dashed line. Differences between cells cultured with or without Ag were calculated using a one-sample t test and are displayed with p values placed above each bar. Differences between groups, calculated with a paired t test, are displayed with p values above horizontal lines. (D) Kinetics of surface IgM and CD19 reexpression. Relative surface CD19 and IgM on B220+CD24highCD23− NA immature B cells that were cultured on Kb stromal for 20 h (time 0 on graph) and then without stromal for indicated times. MFIs were normalized to NA cells cultured without Ag (i.e., on Kd stromal) for 20 h and then without stromal for each time point. Data are from one experiment with one mouse and are representative of three independent experiments. (E) Relative surface CD19 and IgM on ex vivo B220+CD24highCD23− immature B cells from 3-83Igi mice that were nonautoreactive (NA; IgM+ cells from H-2d mice), autoreactive (AUT; IgM−/low cells from H-2b mice), and edited (IgM+ cells from H-2b mice). Data (mean ± SD from n = 9 mice analyzed in three experiments) are relative to the average values measured in NA cells. The p values were calculated using an unpaired Mann–Whitney U test. (F) Simple linear regression analyses between surface CD19 and Igκ (left) and total (surface plus intracellular) CD19 and intracellular p-AKT (right) in ex vivo B220+CD24highCD23−IgD−Igκ+ immature B cells from BL/6 mice. Small serial gates (Supplemental Fig. 3D) were made based on either surface Igκ to correlate MFIs of surface CD19 and Igκ or total CD19 to compare MFIs of total CD19 and p-AKT. Each symbol represents gated cells from each individual mouse. Data on the left are from three mice analyzed in three independent experiments. Data on the right are from two mice analyzed in one experiment; analysis of an additional mouse (r2 = 0.948; p < 0.0001) is not in the graph because it was obtained with an older anti–p-AKT Ab with generally lower MFIs. (G) Simple linear regression analysis between p-AKT and total (surface plus intracellular) IgM in bone marrow B220+CD24highCD23−IgD− B cells from indicated mice (n = 3 mice/group analyzed in one experiment). Small serial gates (Supplemental Fig. 3E) were made based on increasing IgM levels. Each symbol represents gated cells from each individual mouse. Filled symbols represent IgM− cells. In all bar or line graphs, *p ≤ 0.05, **p ≤ 0.01.
FIGURE 5.
Expression of surface CD19 correlates with IgM and p-AKT. (A) Kinetics of surface IgM and CD19 on 3-83Igi,H-2d nonautoreactive (NA) B220+CD24highCD23 immature B cells that were treated with 10 μg/ml of S23 Ab for indicated times. (B) Kinetics of surface Igκ downregulation in immature B cells from BL/6 wild-type (WT) and CD19 knockout (KO) mice. Surface Igκ was measured on B220+CD24highCD23IgD immature B cells cultured for indicated times with 5 μg/ml of anti-IgM F(ab’)2 antibodies. Data in (A) and (B) are mean ± SD from n = 3 mice/group in three independent experiments and are expressed as fold change MFI of cells treated with stimulating Ab over cells treated with PBS for each mouse at the same time point. The p values indicate differences in the kinetics of downregulation of IgM and CD19 in (A) and of Igκ between the two strains in (B) and were calculated using an unpaired t test that compared the proportion of downregulation between the two groups during each time segment. (C) Bone marrow B cells from NA (H-2d) mice (n = 3 mice in three experiments) were cultured for 4 h on Kb stromal cell layers (NA+S+Ag) and then without stromal for an additional 20 h of culture (NA+S+Ag+OFF). Bar graphs display surface CD19 and IgM MFIs (mean ± SD) from B220+CD24highCD23 immature B cells cultured on Kb relative to control cells cultured without Ag (i.e., on Kd stromal), the latter being represented by a blue dashed line. Differences between cells cultured with or without Ag were calculated using a one-sample t test and are displayed with p values placed above each bar. Differences between groups, calculated with a paired t test, are displayed with p values above horizontal lines. (D) Kinetics of surface IgM and CD19 reexpression. Relative surface CD19 and IgM on B220+CD24highCD23 NA immature B cells that were cultured on Kb stromal for 20 h (time 0 on graph) and then without stromal for indicated times. MFIs were normalized to NA cells cultured without Ag (i.e., on Kd stromal) for 20 h and then without stromal for each time point. Data are from one experiment with one mouse and are representative of three independent experiments. (E) Relative surface CD19 and IgM on ex vivo B220+CD24highCD23 immature B cells from 3-83Igi mice that were nonautoreactive (NA; IgM+ cells from H-2d mice), autoreactive (AUT; IgM−/low cells from H-2b mice), and edited (IgM+ cells from H-2b mice). Data (mean ± SD from n = 9 mice analyzed in three experiments) are relative to the average values measured in NA cells. The p values were calculated using an unpaired Mann–Whitney U test. (F) Simple linear regression analyses between surface CD19 and Igκ (left) and total (surface plus intracellular) CD19 and intracellular p-AKT (right) in ex vivo B220+CD24highCD23IgDIgκ+ immature B cells from BL/6 mice. Small serial gates (Supplemental Fig. 3D) were made based on either surface Igκ to correlate MFIs of surface CD19 and Igκ or total CD19 to compare MFIs of total CD19 and p-AKT. Each symbol represents gated cells from each individual mouse. Data on the left are from three mice analyzed in three independent experiments. Data on the right are from two mice analyzed in one experiment; analysis of an additional mouse (r2 = 0.948; p < 0.0001) is not in the graph because it was obtained with an older anti–p-AKT Ab with generally lower MFIs. (G) Simple linear regression analysis between p-AKT and total (surface plus intracellular) IgM in bone marrow B220+CD24highCD23IgD B cells from indicated mice (n = 3 mice/group analyzed in one experiment). Small serial gates (Supplemental Fig. 3E) were made based on increasing IgM levels. Each symbol represents gated cells from each individual mouse. Filled symbols represent IgM cells. In all bar or line graphs, *p ≤ 0.05, **p ≤ 0.01.
FIGURE 6. PI3K signaling positively modulates surface CD19 in immature B cells via the AKT-mTORC1 axis. (A) Relative surface CD19 and IgM levels on ex vivo B220+CD24highCD23− immature B cells from 3-83Igi,H-2b autoreactive (AUT) mice that did or did not express the active PI3Kα form P110*. Data (mean ± SD; n = 5 mice analyzed in four independent experiments) are expressed as fold change over ex vivo immature B cells from 3-83Igi,H-2d nonautoreactive (NA) mice, represented by a blue dashed line. The p values were calculated using one-sample t test and are displayed above each bar, whereas differences between bars were calculated using an unpaired t test displayed on top of horizontal lines. (B) Relative surface CD19 and IgM measured on NA and NA-P110* B220+CD24highCD23− immature B cells that were cultured for 20 h on a Kb stromal cell layer. Data (mean ± SD; n = 3 mice analyzed in three independent experiments) are expressed as fold change over NA immature B cells cultured on Kd stromal. The p values were calculated using an unpaired t test. (C and D) Relative surface CD19 and IgM on B220+CD24highCD23− immature B cells from indicated mice that were cultured for 20 h with inhibitors for ERK (FR180204, 30 μM), AKT (afuresertib, 5 μM), or mTORC1 (rapamycin, 10 μM) and relative to cells treated with DMSO control. Data [mean ± SD; 5 mice/group from five experiments in (C) and 4 mice/group from two experiments in (D)] are expressed as fold change over NA immature B cells cultured with DMSO. The p values denoting differences from NA plus DMSO samples were calculated using a one-sample t test and are placed above each bar. Differences between bars were calculated with a t test and are displayed above horizontal lines. Relative surface CD19 on ex vivo B220+CD24highCD23− immature B cells from 3-83Igi,H-2b AUT mice (E) in which B cells express or not the active PI3Kα P110* or carry the deletion of FOXO1 or from 3-83Igi,H-2d NA mice (F) in which B cells express or not the constitutively active FOXO1-AAA. Data [mean ± SD; 6 mice/group from five experiments in (E) and 5 mice/group from three experiments in (F)] are expressed as fold change over AUT immature B cells in (E) or fold change over NA immature B cells in (F). The p values were calculated using a one-sample t test and displayed above each bar. Differences between bars in (E) were calculated with an unpaired t test. (G) Relative surface CD19 on NA B220+CD24highCD23− immature B cells cultured for 20 h with inhibitors for transcription (actinomycin D [ActD], 0.1 μM) or AKT (afuresertib, 5 μM). Data (mean ± SD; n = 4 mice/group from two experiments) are expressed as fold change over NA treated with DMSO. The p values were calculated using a one-sample t test and displayed above each graph or a paired t test displayed above a horizontal line. In all bar graphs, *p ≤ 0.05, **p ≤ 0.01, ***p ≤ 0.001, ****p ≤ 0.0001.
FIGURE 6.
PI3K signaling positively modulates surface CD19 in immature B cells via the AKT-mTORC1 axis. (A) Relative surface CD19 and IgM levels on ex vivo B220+CD24highCD23 immature B cells from 3-83Igi,H-2b autoreactive (AUT) mice that did or did not express the active PI3Kα form P110*. Data (mean ± SD; n = 5 mice analyzed in four independent experiments) are expressed as fold change over ex vivo immature B cells from 3-83Igi,H-2d nonautoreactive (NA) mice, represented by a blue dashed line. The p values were calculated using one-sample t test and are displayed above each bar, whereas differences between bars were calculated using an unpaired t test displayed on top of horizontal lines. (B) Relative surface CD19 and IgM measured on NA and NA-P110* B220+CD24highCD23 immature B cells that were cultured for 20 h on a Kb stromal cell layer. Data (mean ± SD; n = 3 mice analyzed in three independent experiments) are expressed as fold change over NA immature B cells cultured on Kd stromal. The p values were calculated using an unpaired t test. (C and D) Relative surface CD19 and IgM on B220+CD24highCD23 immature B cells from indicated mice that were cultured for 20 h with inhibitors for ERK (FR180204, 30 μM), AKT (afuresertib, 5 μM), or mTORC1 (rapamycin, 10 μM) and relative to cells treated with DMSO control. Data [mean ± SD; 5 mice/group from five experiments in (C) and 4 mice/group from two experiments in (D)] are expressed as fold change over NA immature B cells cultured with DMSO. The p values denoting differences from NA plus DMSO samples were calculated using a one-sample t test and are placed above each bar. Differences between bars were calculated with a t test and are displayed above horizontal lines. Relative surface CD19 on ex vivo B220+CD24highCD23 immature B cells from 3-83Igi,H-2b AUT mice (E) in which B cells express or not the active PI3Kα P110* or carry the deletion of FOXO1 or from 3-83Igi,H-2d NA mice (F) in which B cells express or not the constitutively active FOXO1-AAA. Data [mean ± SD; 6 mice/group from five experiments in (E) and 5 mice/group from three experiments in (F)] are expressed as fold change over AUT immature B cells in (E) or fold change over NA immature B cells in (F). The p values were calculated using a one-sample t test and displayed above each bar. Differences between bars in (E) were calculated with an unpaired t test. (G) Relative surface CD19 on NA B220+CD24highCD23 immature B cells cultured for 20 h with inhibitors for transcription (actinomycin D [ActD], 0.1 μM) or AKT (afuresertib, 5 μM). Data (mean ± SD; n = 4 mice/group from two experiments) are expressed as fold change over NA treated with DMSO. The p values were calculated using a one-sample t test and displayed above each graph or a paired t test displayed above a horizontal line. In all bar graphs, *p ≤ 0.05, **p ≤ 0.01, ***p ≤ 0.001, ****p ≤ 0.0001.

Similar articles

Cited by

References

    1. Wardemann H., Yurasov S., Schaefer A., Young J. W., Meffre E., Nussenzweig M. C.. 2003. Predominant autoantibody production by early human B cell precursors. Science 301: 1374–1377. - PubMed
    1. Grandien A., Fucs R., Nobrega A., Andersson J., Coutinho A.. 1994. Negative selection of multireactive B cell clones in normal adult mice. Eur. J. Immunol. 24: 1345–1352. - PubMed
    1. Nemazee D. 2006. Receptor editing in lymphocyte development and central tolerance. Nat. Rev. Immunol. 6: 728–740. - PubMed
    1. Pelanda R., Torres R. M.. 2012. Central B-cell tolerance: where selection begins. Cold Spring Harb. Perspect. Biol. 4: a007146. - PMC - PubMed
    1. Pelanda R., Greaves S. A., Alves da Costa T., Cedrone L. M., Campbell M. L., Torres R. M.. 2022. B-cell intrinsic and extrinsic signals that regulate central tolerance of mouse and human B cells. Immunol. Rev. 307: 12–26. - PMC - PubMed

Publication types

MeSH terms

Substances